Fertilizers - GPCA Fertilizer Convention
←
→
Page content transcription
If your browser does not render page correctly, please read the page content below

September 2019

Mapping fertilizer trends in major producing regions
Oliver Hatfield, VP Business Development, Argus Media Ltd

                                                                                    Market Reporting
 Fertilizers
                                                                                      Consulting
 Fertilizers
 illuminating      the markets
 illuminating the markets
                                              Copyright © 2019 Argus Media group.
                                                        All rights reserved                   Events
Disclaimer and Notices This presentation (the “Report”) is confidential, made available strictly under licence and has been prepared solely for the internal use of the applicable Argus licensee (a “Client”). Any use or disclosure of this Report and its contents without specific written permission from Argus is strictly prohibited. No duty of care is owed by Argus to any third party and Argus disclaims all liability in relation to any third party who seeks to rely upon or use the Report or any of its contents. The Report, including the Argus trademarks and logo/legal notices, may not be altered. Derivative works of all or part of the Report may not be created without prior written permission. The data, information or opinions contained in this Report are provided on an “as is” basis without any warranty, condition or other representation as to its accuracy, completeness, or suitability for any particular purpose and shall not confer rights or remedies upon the recipients of this presentation or any other person. Data and information contained in the Report come from a variety of sources, some of which are third parties outside Argus’ control and some of which may not have been verified. Argus does not warrant that this Report is in all respects accurate and complete and does not warrant any results obtained or conclusions drawn from the use of this Report. Argus has no obligation to maintain or update this Report. All analysis and opinions, data, projections and forecasts provided may be based on assumptions that are not correct or which change, being dependent upon fundamentals and other factors and events subject to change and uncertainty; future results or values could be materially different from any forecast or estimates described in the Report. Subject to any agreement between Argus and its Client, Argus expressly disclaims any and all liability for any direct, indirect or consequential loss or damage, claims, costs and expenses, whether arising in negligence or otherwise, in connection with access to, use or application of these materials or suffered by any person as a result of relying on any information included in, or omission from, this Report and related materials or otherwise in connection therewith, to the maximum extent permitted by law. The Client’s use of the Report is entirely at the Client’s own risk. This Report does not offer or provide financial, tax or legal advice. Copyright notice Copyright © 2019 Argus Media group. All rights reserved. All intellectual property rights in this presentation and the information herein are the exclusive property of Argus and and/or its licensors and may only be used under licence from Argus. Without limiting the foregoing, you will not copy or reproduce any part of its contents (including, but not limited to, single prices or any other individual items of data) in any form or for any purpose whatsoever without the prior written consent of Argus. Trademark notice ARGUS, the ARGUS logo, ARGUS MEDIA, INTEGER, ARGUS GLOBAL MARKETS, other ARGUS publication titles and ARGUS index names are trademarks of Argus Media Limited. For additional information, including details of our other trademarks, visit argusmedia.com/trademarks. illuminating the markets Copyright © 2019 Argus Media group. All rights reserved.

Over 30 experts globally across 7 offices

                                                                                      3
illuminating the markets   Copyright © 2019 Argus Media group. All rights reserved.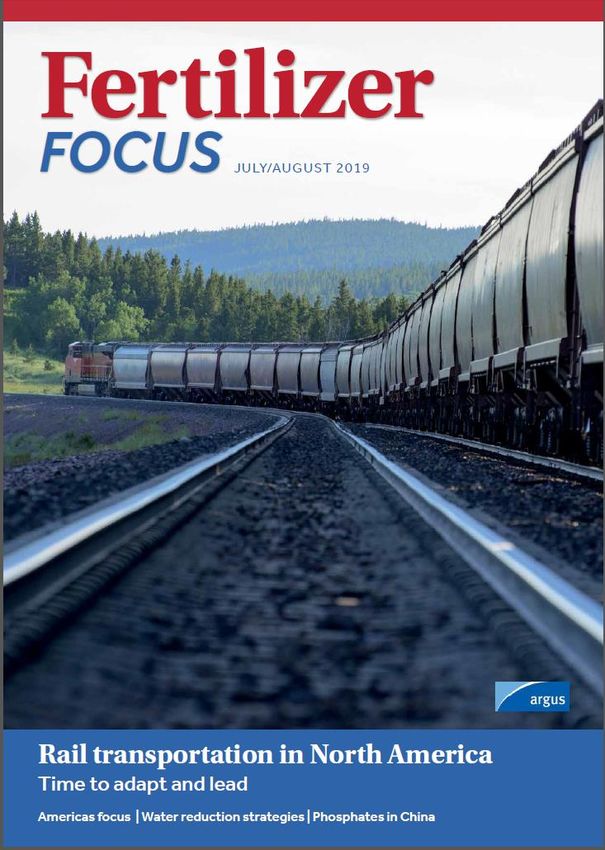
Analytics key content
                      Key content                                                                 New
                                     Published Methodology:
    Price forecast                   -15yr cyclical and reversion forecast updated quarterly
                                     -25yr LRMC forecast updated annually

    S&D analysis for major markets   Demand Forecasts derived from an Agricultural Model

    Assessment of new capacity       Project Screening to filter out future capacity

    Cost analysis                    Full Cost curve updated quarterly or annually (depending on product)

    Frequency of Updates             4 Quarterly updates + 1 Annual spotlight

    Data available on Argus Direct   Front End included

illuminating the markets               Copyright © 2019 Argus Media group. All rights reserved.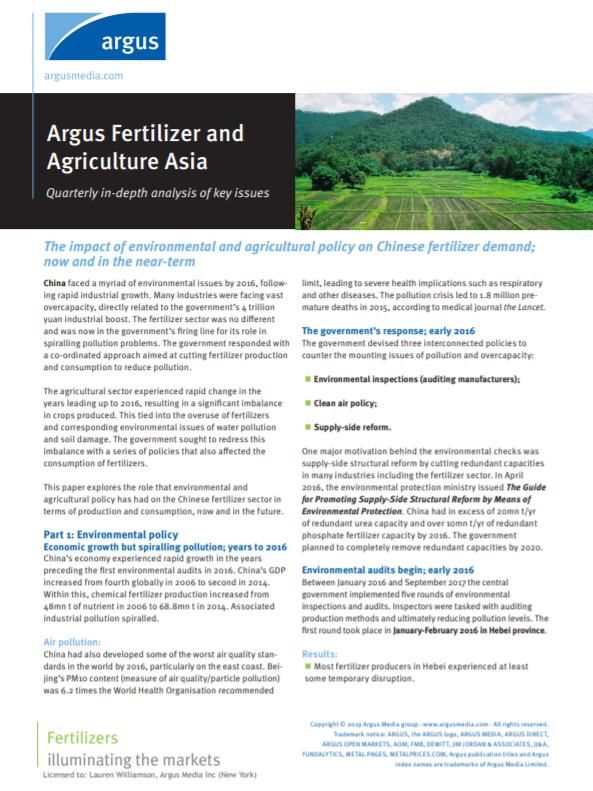
Presentation overview
Mapping fertilizer trends in major producing regions
• Recent developments and short to long term market analysis for:
• Potash
• Phosphate
• Nitrogen
• Focusing on regions and countries that move the supply balance
Fertilizers Copyright © 2019 Argus Media group.
illuminating the markets All rights reserved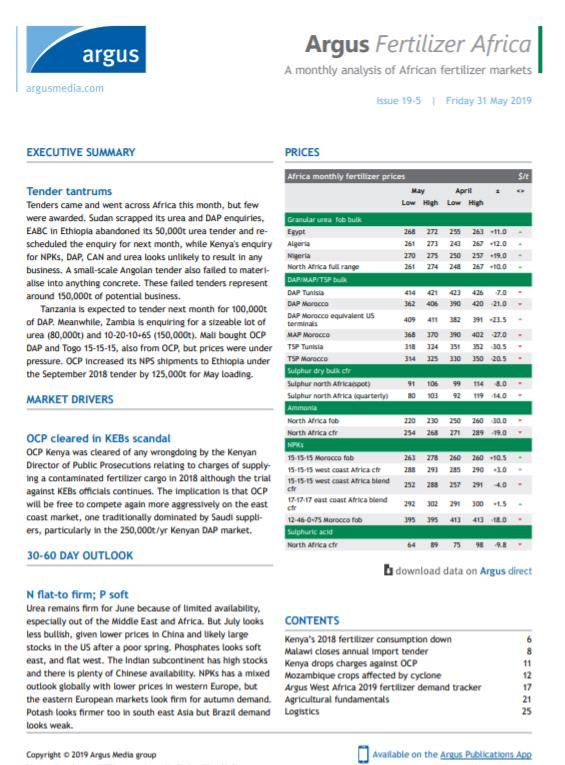
Potash

Fertilizers                Copyright © 2019 Argus Media group.
illuminating the markets             All rights reserved
• We are still feeling the effects of the upturn in potash            • Geography of expansions is focused on Canada, Russia, Belarus and China.
  prices in 2008!                                                     • While there have been some new entrants, generally the supply
• New capacity has exceeded new demand since 2009.                      concentration has remained relatively high.
• Creation of spare capacity normally weakens the market.             • Oligopoly has meant pricing has been reasonably stable until recently.

Fertilizers                                                  Copyright © 2019 Argus Media group.
illuminating the markets                                               All rights reserved
But we are starting to see the impact of the most recent expansions
Short-run MOP balance                                                                                                 Recent potash prices

     ‘000 t
1,500                    MOP balance                                               Forecast                Surplus
                                                                  1,327

1,000                                                                                             892

                   503
  500
                                                                                          301
                                                                          216     175
                                                          160
                            5                      34
    0

          -233
 -500

                                  -845
-1,000                                                                                                      Deficit

-1,500                                    -1,433
         Q1 2018 Q2 2018 Q3 2018 Q4 2018 Q1 2019 Q2 2019 Q3 2019 Q4 2019 Q1 2020 Q2 2020 Q3 2020 Q4 2020

 • 2018 was a strong demand year.                                                                                     •   Robust demand underlined a strong pick up in potash prices in 2018.
 • Q1 2019 was tight, but the balance shifted to equilibrium in mid-year.                                             •   But sentiment has softened in 2019.
 • As we look forwards, we’re moving in to a period of surplus supply.                                                •   Our expectations are for weaker market in the short term.
                                                                                                                      •   Key potash suppliers are adjusting capacity, looking for equilibrium.

  Fertilizers                                                                                   Copyright © 2019 Argus Media group.
  illuminating the markets                                                                                All rights reserved
Supply
Key themes in mid-2019

                   Nutrien and Mosaic curtail MOP
                   supply as weak demand allows MOP
                   prices to fall; K+S follows

                   Bethune continues to face quality
                   issues, production ramps up,
                   maintenance planned

                   SQM continues to focus on lithium

                   China ramps up pressure in SOP
                   market

Fertilizers                                     Copyright © 2019 Argus Media group.
illuminating the markets                                  All rights reserved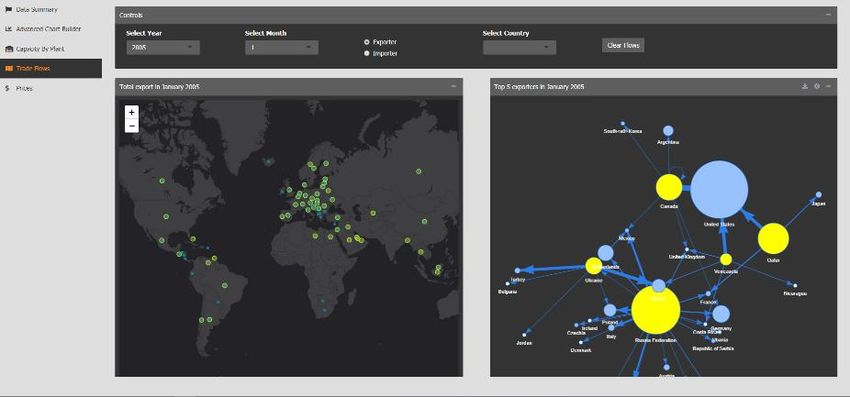
MOP capacity forecast to 2024: Includes firm and probable MOP projects
MOP Capacity Forecast

    Million t
                                                                                                                                                Bolivia
   3.0                                                                     2.8                            2.8                                   China + Laos
                                                                                              2.7
                                                                                                                                                Jordan
   2.5                                                                                                                                          Spain
                                                                                                                                                Turkmenisatan
                            2.0                                                                                                     Ø 2.2
   2.0                                     1.9                                                                           2.0                    Canada Greenfield
                                                          1.8
                                                                                                                                                Belarus Petrikov
                                                                                                                                                Canada Brownfield
   1.5          1.4
                                                                                                                                                Russia Greenfield
                                                                                                                                                Russia Brownfield
   1.0

                                                                                                                                      Capacity represents Argus’
   0.5                                                                                                                                assessment of operable
                                                                                                                                      capacity, rather than
   0.0                                                                                                                                design/nameplate capacity.
                2017       2018           2019           2020             2021               2022        2023           2024

• MOP incremental capacity addition run rate in recent years has been                • The biggest changes to capacity in 2019 are Belaruskali adding capacity
  around 2 million t/y.                                                                at Petrikov, and ongoing ramp up of Eurochem new mines.
• For the period between 2019 to 2024 this will increase to 2.4 million t/y.         • By 2021, we see brownfield expansions in Canada with Mosaic ramping
• Major recent projects in recent years were Bethune in Canada and two                 up Esterhazy K3, while K+S plans to increase production at Bethune (2nd
  Eurochem projects, which are gradually ramping up.                                   phase). Uralkali is also expanding capacity at Solikamsk 3
• Other small additions have been projects in China, Laos, Turkmenistan, by          • By 2023, we should see new capacity from Uralkali Ust-Yayvinksy starting
  APC in Jordan and YLB in Bolivia                                                     up. Nutrien is also planning substantial new brownfield capacity
                                                                                       expansion.

Fertilizers                                                      Copyright © 2019 Argus Media group.
illuminating the markets                                                   All rights reserved
Global Capacity Forecast: adjusting for mine closures
MOP Forecast Net Capacity
Million y/t Mine 2018 2019 2020 2024
2.8 2.7
3 2.6
1.9 Sigmundshall -900 0 0 0
2 1.4
1.0 1.1 Ø 1.4 Picadilly -2,000 0 0 0
1
Capacity expansions
0 Boulby -1,040 0 0 0
Closure: Germany (Sigmundshall)
-1 Closure: Canada (Picadilly)
Closure: UK (Boulby) Vilafruns (Sallent) 0 0 -500 0
-2.1
-2 Closure: Spain (Sallent)
Taquari Vassouras 0 0 0 -625
-3 Closure: Brazil (Taquari)
Closure: Russia (Berezniki 2)
-4 Net capacity Berezniki 2 -200 0 -290 -410
-5
2017 2018 2019 2020 2021 2022 2023 2024 Total -4,140 0 -790 -1,035
• Substantial closures will to some extent offset the additional capacity outlined previously.
• Nutrient announced the closure of it 2 million t/y Picadilly mine in Saskatchewan. However, it will have relatively minor
commercial impact.
• European closures have greater commercial impact in Spain, Germany and UK.
• Note that this is based on committed capacity, it doesn’t capture losses of production due to commercial decisions, e.g.
SQM.
Fertilizers Copyright © 2019 Argus Media group.
illuminating the markets All rights reservedSignificant ramp up in capacity, mostly in Russia
mn t EuroChem production ‘18-23
5.5 Usolskiy capacity Uralkali Russia 13,000 12,600 13,200 15,400 600
5.0 Volgakaliy capacity EuroChem Russia 0 400 5,300 7,500 4,900
4.5
Belaruskali Belarus 10,800 12,900 14,400 14,400 1,500
4.0
3.5 Turkmenhimya Turkmenistan 0 300 650 1,300 350
3.0 Uzkimyosanoat Uzbekistan 200 600 600 600 0
2.5 FSU nameplate capacity 24,000 26,800 34,150 39,200 7,350
2.0
FSU production 17,112 24,150 29,197 32,510 5,047
1.5
1.0 FSU op. rate 71% 90% 85% 83% -5%
0.5 FSU demand 2,220 2,026 2,199 2,370 173
0.0 FSU S/D Balance 21,780 22,124 26,998 30,140 4,874
2018 2019 2020 2021 2022 2023
• The biggest change in capacity in this region in the next five years is
mn t Regional demand Russian Production Eurochem’s potash investment.
35 Others Belarusian Production • Usolskiy first phase produced 467kt in 1H 2019, FY target of 1.1
30 mt. Design capacity likely by 2021, upgrade possible by 2022.
25 • Usolskiy phase II underway, likely 2023. Capacity total = 4mt.
20
• Volgakaliy more complicated. Assuming 2.3 mt by 2023, phase I;
phase II to follow.
15
• We expect to see other project activity also from Acron and Slavkaliy,
10 which could be new entrants in this timeframe.
5 • FSU regional exportable surplus increasing from 22mn t to 30 mn t by
0 2028.
2010 2015 2020 2025 2030
Fertilizers Copyright © 2019 Argus Media group.
illuminating the markets All rights reservedMOP capacity expansion in Canada will magnify the region’s exportable supply surplus
North American MOP balance North America MOP Capacity Expansions/Closures
Million t/y
35 Million t/y
45.9
46
30 Picadilly Bethune
44 43.5
25 Nutrien Various Esterhazy ramp up
42 Jansen Existing NAm capacity
20
40 38.9
15 38.2
Imports (Outside NAm) 38 37.0 36.7
10 33.9 36.1 35.9 36.3
Exports (Outside NAm) 36
5 9.6 11.3 10.5 11.1 10.7 10.8 10.9 11.0 11.1 11.5 11.8
Production 34
0 Apparent Demand
32
-5 -10.0 -11.5 -14.2 -13.6 -13.9 -13.9 -14.5 -14.9 -15.8 30
-10 -18.3
-22.1 28
-15
0
-20 -2
2017 2018 2019 2020 2021 2022 2023 2024 2028 2033
-25
2016 2017 2018 2019 2020 2021 2022 2023 2024 2028 2033
• Canadian potash capacity is predicted to continue to expand, resulting in an increasing exportable surplus.
• Brownfield investment will result in 3 million t/y of capacity being added in the next 5 years.
• The biggest increase is predicted to take place beyond 2024, with the emergence of BHP’s greenfield investment.
• With some modest increase in regional demand, it means that the exportable surplus of potash capacity should increase by
around 50%.
Fertilizers Copyright © 2019 Argus Media group.
illuminating the markets All rights reservedGlobal MOP balance
Unprecedented MOP demand growth in 2018 helped absorb capacity additions but from 2019 a supply surplus builds y-o-y until 2024
MOP net balance
Mn t Cumulative net change Inoperable
• Robust demand growth in 2017
8 Net change Capacity closures and 2018, combined with some
Demand growth Capacity expansions
7 closures, led to a significant deficit
To surplus
6 and tightening of the market.
5 • We are already seeing that shift in
4 to reverse in 2H 2019. Demand
3 growth this year is expected to be
2 flat while capacity ramps up at
1 various new/recent projects.
0 • As we move forward, we will see a
-1 gradual and persistent supply
-2 surplus as the ramp up of new
-3
project activity, adjusted for
-4
closures, exceeds incremental
-5
demand growth.
• Will new entrant tonnes make
To deficit
-6
2015 2016 2017 2018 2019 2020 2021 2022 2023 2024
pricing more competitive?
Fertilizers Copyright © 2019 Argus Media group.
illuminating the markets All rights reservedPhosphate Fertilizers Copyright © 2019 Argus Media group. illuminating the markets All rights reserved
Global phosphates market is becoming increasingly
 regionalised

                                                                      Europe
                            Canada &                               dominated by
                           Latin America                            North African
                           dominated by                           and Russian DAP
                                 US

                                                                           Africa –                  Indian
                                                                        increasingly             subcontinent
                                       Brazil still globally            targeted by
                                          competitive                                            dominated by
                                          market but                      OCP and                Saudi Arabia
                                       Chinese influence               Saudi product
                                           in retreat                        (east                 and China
                                                                            coast)

Fertilizers                                                Copyright © 2019 Argus Media group.
illuminating the markets                                             All rights reserved
Chinese phosphates sector undergoing consolidation
China becomes net DAP exporter in 2007
But Chinese production is facing come challenges
• Zero growth in domestic fertilizer demand by 2020
• Permitting of rock mining tightened
• Ongoing environmental control
• DAP exporters facing increased competition
Capacity additions are slowing due to the chronic DAP oversupply
Market consolidation is happening:
• Kailin-Wengfu merger was confirmed after a year of rumours
• China's 2nd and 3rd largest producers overtaking YTH with 10mn t/yr of DAP/NPK capacity
Likely future outcomes:
• Vertical integration encouraged
• Older, higher cost producers forced out of business
• Fewer participants remaining with higher utilisation
• Longer term capacity decline likely, but weighted against macro demands of China’s economy
Fertilizers Copyright © 2019 Argus Media group.
illuminating the markets All rights reservedChina DAP exports continue
‘t Total China DAP exports in
January-April 2017-19
600,000
• Weak domestic Chinese 500,000
demand in 1Q19 400,000 Source: GTT
• Suppliers look to meet
300,000
Indian DAP demand
• China ships 1.3mn t in 200,000
January-June 2019 to India –
100,000
up by 34%
0
2017 2018 2019
January February March April
Fertilizers Copyright © 2019 Argus Media group.
illuminating the markets All rights reservedNorth America – horizontal consolidation
Reason: 2005 • US Chem exits market
• Phosphate rock reserves depleting and permitting 2006 • Mosaic closes Green Bay plant
is difficult
• Environmental issues (Phosphogypsum) 2010 • Agrifos switches away from phosphates
• Mosaic acquires CF phosphate assets
2013
• PhosChem disbands
Result:
• Mosaic now owns 70pc of DAP/MAP/MES
• May: OCP agrees supply deal with PCS
capacity 2014
• December: MissPhos ceases production
• Nutrien owns 20pc
2016 • PCS /Agrium merger– Nutrien formed
Implications: 2017 • Mosaic idles Plant City (1.8mn t/yr, mainly DAP)
• Higher concentration
2019
• New export strategy orientation/MWSPC • Nutrien ceases MAP production at Redwater in
Canada, starts to convert unit to AS
• DAP Tampa no longer international benchmark
Fertilizers Copyright © 2019 Argus Media group.
illuminating the markets All rights reservedCapacity growth driven by Morocco and Saudi Arabia, timing is important
OCP, Morocco Egypt
DAP/MAP/NPS – JPH 3.4mn t/yr P2O5 Phosacid – NCIC (2019)– 360,000 t/yr P2O5
DAP/MAP/TSP/DCP/MCP – SPH - 1mn t/yr P2O5 Phosacid – Misr (2022)– 500,000 t/yr P2O5
DAP/MAP - PhosBoucraa 330,000 t/yr P2O5
Kazphosphate, Kazakhstan
MAP - Taraz (+110,000 t/yr P2O5, 2018)
Nutrien, US NPK/DCP – Eurochem ( +250,000 t/yr P2O5
Geismar plant to close end-2018
(-200,000 t/yr P2O5)
Kribhco/OCP JV, India
DAP/NPK – 1.2mn t/yr - 2022
Nutrien, Canada
Redwater MAP plant conversion to AS - 2019
(-345,000 t/yr P2O5)
China– Industry restructuring
Argus assumed the closure of small inefficient plants
Ma’aden, Saudi Arabia Equivalent to -0.7mn t P2O5 PhosAcid
DAP/MAP/NPS – Ma’aden 3 - +1.7 mn t/yr P2O5, ~2024
Mosaic, US – Plant City closure, -1mn t PhosAcid :
• Lower operating costs and improve system-wide margins
JPMC, Indonesia
• Reduce CAPEX requirements
China Molybdenum, Brazil Pupuk Kaltim, Bontang (200,000 t/yr P2O5, 2019)
• Serve own distribution business and other India customers
MAP/TSP - Catalao - +200,000 t/yr P2O5, 2020/21 Pupuk Sriwijaya (Pusri), Palembang (200,000 t/yr P2O5, 2020)
with low-cost MWSPC JV
Base Case assumes plant will not restart
Yara, Brazil
MAP/TSP - Galvani, Serra do Salitre (+180,000 t/yr P2O5, 2020/21)
Fertilizers Copyright © 2019 Argus Media group.
illuminating the markets All rights reservedNitrogen Fertilizers Copyright © 2019 Argus Media group. illuminating the markets All rights reserved
Global urea capacity forecast, 2018-2033
Argus is tracking 36.0 million t/y of new urea capacity; either at the construction stage or in feasibility
Limited investment potential in Global Capacity expansions
Europe and the Americas. Instead
capital is flowing to the following
regions.
Nigeria: Cheap gas priced at $1.50-
2.00/MMBtu and cheap building costs
are offsetting risk.
India: Government is supplying cheap
capital to offset imports and support
the subsidy domestically.
Russia Central Asia: Cheap gas
$0.50-3.50/MMBtu is providing a
steady stream of projects.
SE Asia: Stranded gas in Brunei and
Australia is seeking monetisation.
Iran and Egypt: Government backed
building to support local economy
Forecast capacity expansions
Possible capacity expansions
Speculative capacity expansions
Fertilizers Copyright © 2019 Argus Media group.
illuminating the markets All rights reservedGlobal urea capacity forecast, 2018-2024
mn t/y
7.5
Pro-rated urea capacity forecast
Americas Middle East
• Basis for inclusion in CIS Africa
our firm listing in this SE Asia South Asia
timeframe is projects 5.0
which are financed,
received all required
permits and have
begun construction.
Projects undergoing
feasibility are
2.6
excluded, as are those 2.5
without LT gas supply.
0.0
2015 2016 2017 2018 2019 2020 2021 2022 2023 2024
Fertilizers Copyright © 2019 Argus Media group.
illuminating the markets All rights reservedDramatic expansion of West African urea supply will expand continent’s exportable supply surplus
• Three new trains in Nigeria will add close to 6 million t/y of capacity. mn t/y
• The Dangote project recently signed a new gas supply contract with Chevron, though 18
still some questions.
Production
16
• Eleme project understood to be on track. 14
12
• Regional demand expected to grow, but exportable surplus set to grow substantially. 10
• The NCIC project is not yet firm, but seems likely to progress. Egypt gas situation is greatly 8
improved.
6
4
• Elsewhere, capacity in Algeria has stabilised, operations at around 90% utilization. Exports 2
of 3.2 million t in 2018 likely will be repeated in 2019. 0
2010 2015 2020 2025 2030
mn t
18
2010 2015 2018 2025 ‘18-25 Exportable
16 surplus
Egypt 5.1 5.9 6.8 7.3 +0.5 Jul- Production
Kima II Egypt 520 14
Algeria 0.0 3.0 3.4 3.4 +0.0 19
12
Nigeria 0.3 0.3 1.7 6.0 +4.3 Jul-
Dangote I Nigeria 1,271 10
21
Libya 0.9 0.9 0.9 0.9 +0.0 8
Jul-
African capacity 6.4 10.2 12.8 17.7 +4.9 Dangote II Nigeria 1,271
22 6
Technical surplus 4.0 7.7 10.1 14.3 +4.2 Jul- 4
Eleme II Nigeria 1,400
22 2
African production 5.8 4.8 11.4 15.6 +4.2 Existing
African op. rate 91% 47% 89% 88% -1% Expansion 0
2010 2015 2020 2025 2030
Possible/Spec. Jul-
African S/D Balance 3.4 2.2 8.7 12.2 +3.5 NCIC Egypt 380
23
Fertilizers Copyright © 2019 Argus Media group.
illuminating the markets All rights reservedBarauni has been connected to the Indian gas network
• We added the HURL project at Barauni to our list of firm projects, after progress on gas
supply.
mn t/y
50 Production
• This raises our expectations of firm new Indian urea capacity to 4 projects, adding 5 million Capacity: Bangladesh
t/y. Indian urea capacity would reach 30 million t/y.
40
• Two other projects are considered speculative at Talcher (coal-gasification) and in 30
Bangladesh. 20
• Collectively, firm project activity would reduce the regional urea import requirement from 10
nearly 13 million tonnes in 2015 to just over 5 million t/y. 0
2010
2015
2020
2025
2030
mn t
2010 2015 2018 2025 ‘18-25 50
India 23.0 24.0 24.0 30.4 +6.4 Ramagundam India Mar-20 1,271
40
Pakistan 4.6 6.3 6.3 6.3 +0.0 Matix Fert. India Oct-20 1,271
Bangladesh 3.0 3.0 3.5 3.5 +0.0 Gorakhpur India Mar-22 1,271 30
Afghanistan 0.1 0.1 0.1 0.1 +0.0 Barauni India Dec-22 1,271
Other South Asia 0.0 0.0 0.0 0.0 +0.0 Total firm 5,082 20
S. Asian capacity 30.7 33.4 33.9 40.3 +6.4 Sindri India Jul-23 1,271
Technical surplus -6.5 -9.4 -6.1 -1.3 +4.9 Talcher India Jul-23 1,271 10
S. Asian production 28.3 30.5 30.6 36.7 +6.1 Existing Polash Bangladesh Jul-24 924
Expansion 0
S. Asian op. rate 92% 91% 90% 91% +1% Total speculative 3,465 2010 2015 2020 2025 2030
Speculative
S. Asian S/D Balance -9.2 -12.8 -9.7 -5.3 +4.4 Total: Firm + Speculative 8,547
Fertilizers Copyright © 2019 Argus Media group.
illuminating the markets All rights reservedChinese urea output has increased with gas availability
Chinese urea capacity is forecast to stabilise between 65-70 million t/y over the medium term
Chinese urea plant closures Chinese capacity, 2010-33
1. Capacity closure rate is slowing, but for now mn t/y mn t/y
we are still seeing net decrease in capacity. 6 90
5.3
80
2. Operating rates have improved towards 4.5 4.5 70
80%, while higher gas availability means 4 3.8 60
more production over the winter. 50
40 Production
3. Urea production up ~2.0 mn t this year… 2 30 Consumption
20
4. …and we are seeing this increment being Chinese capacity
10
passed into the export market.
0 0
2016 2017 2018 2019 2010 2015 2020 2025 2030
Chinese Capacity Expansions Chinese urea production, 2017-19 Chinese urea production, 2017-19
mn t/m mn t/y mn t
Name Country Start Capacity
10 55 14
2015
Erdos Wulan In. Mongolia Sep-19 1,200 12
Annualised production 54
Runjin Chem Shanxi Nov-19 300 10
Sanning Hubei Nov-19 795 53 2016
8
Mingshengda Shandong H2 2020 795 5
52 6
XLX Jiangxi Jiangxi H2 2020 525 2017
4
Hongtaixing Heilongjiang H2 2020 300 51
2 2018
Linggu Chem Jinagsu H2 2021 1,680 Monthly Chinese production
Zhengyuan Hebei H2 2021 248 0 50 0
Jan- Jul- Jan- Jul- Jan- Jul- Jan Feb Mar Apr May Jun Jul Aug Sep Oct Nov Dec
Total firm 6,368 17 17 18 18 19 19
Fertilizers Copyright © 2019 Argus Media group.
illuminating the markets All rights reservedMarket Balance: Five-year Outlook
Cheaper inputs, a weak RMB and capacity make the market look moderately over-supplied in the year
ahead
mn t/y
• The withdrawal of Chinese exports in 2016 8
Net Change
and 2017 contributed to a reduction in Demand
Chinese export delta
the net change surplus, then a deficit in
7
Iran export delta
2018, which brought a tighter market in 6 Closures
that year.
Restarts
5
Capacity expansion
• We had been expecting a tighter 2019, 4
but a weak RMB and weak energy prices 3
mean that Chinese urea exports have 2
tipped the balance towards surplus.
For the period 2020-21, the market looks
1
•
to be shifting to surplus with 5 million t/y 0
of new export oriented capacity -1
exceeding new demand growth, so the -2
market likely to weaken. -3
• For 2023-2024, the rate of new capacity
-4
additions slows, and we can expect a
tighter market. But there’s a risk that some -5
projects move ahead and tip the balance. -6
2016 2017 2018 2019 2020 2021 2022 2023 2024
Fertilizers Copyright © 2019 Argus Media group.
illuminating the markets All rights reserved… thanks for your attention!
Copyright notice
Copyright © 2019 Argus Media Ltd. All rights reserved. All
intellectual property rights in this presentation and the
information herein are the exclusive property of Argus and
and/or its licensors and may only be used under licence from
Argus. Without limiting the foregoing, by reading this
presentation you agree that you will not copy or reproduce
any part of its contents (including, but not limited to, single
prices or any other individual items of data) in any form or for
any purpose whatsoever without the prior written consent of
Argus.
Trademark notice
ARGUS, ARGUS MEDIA, the ARGUS logo, DEWITT, FMB,
FUNDALYTICS, METAL-PAGES, JIM JORDAN & ASSOCIATES,
JJ&A, ARGUS publication titles and ARGUS index names are
trademarks of Argus Media Limited.
Disclaimer
All data and other information presented (the “Data”) are
provided on an “as is” basis. Argus makes no warranties,
express or implied, as to the accuracy, adequacy, timeliness, or
completeness of the Data or fitness for any particular purpose.
Argus shall not be liable for any loss or damage arising from
any party’s reliance on the Data and disclaims any and all
liability related to or arising out of use of the Data to the full
Fertilizers
extent permissible by law.
Copyright © 2019 Argus Media group.
illuminating the markets All rights reservedAppendix:
Update on Argus fertilizer sector coverage
Fertilizers Copyright © 2019 Argus Media group.
illuminating the markets All rights reservedBuilding on 30+ years of excellence
1982 2011 2012-2016 2018
2012-2013
FMB Consultants Argus acquires FMB Rapid expansion of Acquisition of
Argus acquires JJ&A,
Ltd founded market services and DeWitt expanding related services, global fertilizer Integer Research
conferences team and locations
market coverage
1980 1990 2000 2010 2020
2004 2013 2016-2019
2012
FCC Consultants Fertilizers win top awards from Launches enhanced
Argus acquires FCC
founded Trade Association Business data services,
International Analytics and mobile
tools
illuminating the markets Copyright © 2019 Argus Media group. All rights reserved.Over 30 experts globally across 7 offices
31
illuminating the markets Copyright © 2019 Argus Media group. All rights reserved.Analytics key content
Key content New
Published Methodology:
Price forecast -15yr cyclical and reversion forecast updated quarterly
-25yr LRMC forecast updated annually
S&D analysis for major markets Demand Forecasts derived from an Agricultural Model
Assessment of new capacity Project Screening to filter out future capacity
Cost analysis Full Cost curve updated quarterly or annually (depending on product)
Frequency of Updates 4 Quarterly updates + 1 Annual spotlight
Data available on Argus Direct Front End included
illuminating the markets Copyright © 2019 Argus Media group. All rights reserved.Giving you an expanded portfolio of services
Over 650 price Fertilizer
assessments across
market reports
Market Intelligence Consulting Conferences
Over 200 news alerts each Multi-Client
month Global
Reports
Regional
Reports
Forecast and
Data Services
and Single-
Regional
Events
Regional
Forums
Client Work
Trusted for indexation in Nitrogen Europe
Outlooks WSF
physical contracts Ammonia
Phosphate
NorthAm
Brazil Analytics
EEF
Micronutrients
Africa, Asia, Added Value
Potash
Sub-Saharan
LatAm, FSU, Fertilizer
Sulphur Russia Cost
Africa Europe WSF & NPK
SulAcid Africa Curves
Short-term and long-term NPK Asia
forecast publications and
data sets
illuminating the markets Copyright © 2019 Argus Media group. All rights reserved.New in 2019: DEF, TGU, Sulphur, Africa and Asia content illuminating the markets Copyright © 2019 Argus Media group. All rights reserved.
Fertilizer Analytics services

          4 Quarterly Reports       Interactive Excel Spreadsheets                         1 Annual LT Report

illuminating the markets        Copyright © 2019 Argus Media group. All rights reserved.
Analytics key content
Key content New
Published Methodology:
Price forecast -15yr cyclical and reversion forecast updated quarterly
-25yr LRMC forecast updated annually
S&D analysis for major markets Demand Forecasts derived from an Agricultural Model
Assessment of new capacity Project Screening to filter out future capacity
Cost analysis Full Cost curve updated quarterly or annually (depending on product)
Frequency of Updates 4 Quarterly updates + 1 Annual spotlight
Data available on Argus Direct Front End included
illuminating the markets Copyright © 2019 Argus Media group. All rights reserved.Analytics data visualisation dashboard
Argus is continuously seeking to improve
data delivery and user experience. Our team
is developing a new interactive platform for
you to easily access all fundamentals data.
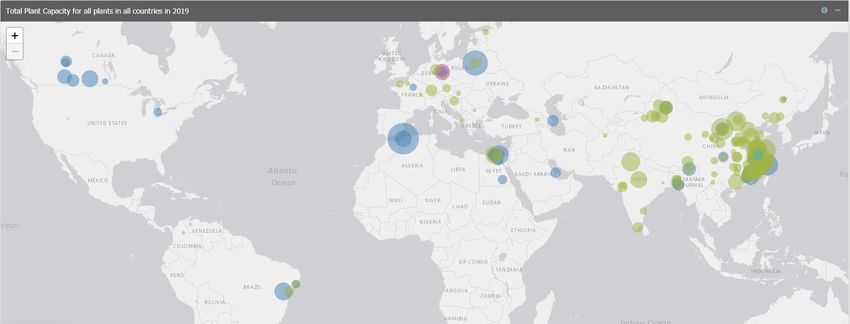
illuminating the markets Copyright © 2019 Argus Media group. All rights reserved.Dashboard shows capacity by country, location illuminating the markets Copyright © 2019 Argus Media group. All rights reserved.
Shows prices and trade flows plus advanced chart builder

illuminating the markets   Copyright © 2019 Argus Media group. All rights reserved.
… and last but not least, Fertilizer Focus magazine

                                                              The leading fertilizer industry magazine is
                                                              undergoing a revamp:
                                                              • Widest and most credible fertilizer industry
                                                                circulation
                                                              • Best in class articles on the sector
                                                              • The most compelling vehicle for advertising
                                                                to reach a qualified fertilizer audience

                                                                                                               40
illuminating the markets         Copyright © 2019 Argus Media group. All rights reserved.
You can also read