El Niño Southern Oscillation as an early warning tool for dengue outbreak in India
←
→
Page content transcription
If your browser does not render page correctly, please read the page content below
Preprint: Please note that this article has not completed peer review.

El Niño Southern Oscillation as an early warning tool
for dengue outbreak in India
CURRENT STATUS:                   UNDER REVIEW

Malay K. Pramanik
National Institute of Malaria Research

Poonam Singh
National Institute of Malaria Research

Gaurav Kumar
National Institute of Malaria Research

Vijay Prakash Ojha
National Institute of Malaria Research

Ramesh C. Dhiman
National Institute of Malaria Research

 r.c.dhiman@gmail.comCorresponding Author

DOI:
  10.21203/rs.2.21293/v1
SUBJECT AREAS
 Health Economics & Outcomes Research             Health Policy
KEYWORDS
 ENSO; Dengue case index; Early warning; Indian Ocean Dipole; Monsoon; post
 Monsoon.

                                                  1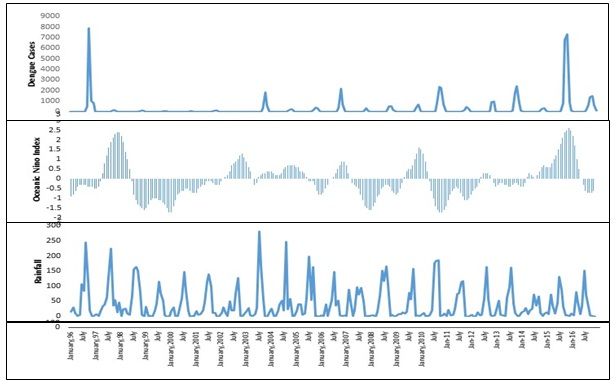
Abstract
Background Dengue is rapidly expanding climate-sensitive mosquito-borne disease worldwide.

Outbreaks of dengue occur in various parts of India as well but there is no tool to provide early

warning. The current study was, therefore, undertaken to find out the link between El Niño,

precipitation, and dengue cases, which could help in early preparedness for control of

dengue.Methods Data on Oceanic Niño Index was extracted from CPC-IRI (USA) while the data on

monthly rainfall was procured from India Meteorological Department. Data on annual dengue cases

was taken from the website of National Vector Borne Disease Control Programme (NVBDCP).

Correlation analysis was used to analyse the relationship between seasonal +ONI, ‘rainfall index’ and

‘dengue case index’ based on past 20 years state-level data. The ‘dengue case index’ representing

‘relative deviation from mean’ was correlated to the 3 months average Oceanic Niño Index (ONI). The

computed r values of ‘dengue case index’ and ‘+ONI’ were further interpreted using GIS software to

generate spatial correlation map. The short-term (1 year) prediction of dengue probability map has

been prepared based on phase-wise (El Niño, La Niña, and Neutral) 20 years averaged ONI.Results A

high correlation between +ONI and dengue incidence was found, particularly in the states of

Arunachal Pradesh, Chhattisgarh, Haryana, Uttarakhand, Andaman and Nicobar Islands, Delhi, Daman

and Diu. On the other hand, the states like Assam, Himachal Pradesh, Meghalaya, Manipur, Mizoram,

Jammu & Kashmir, Uttar Pradesh, Orissa, and Andhra Pradesh shown negative correlation between

summer El Niño and dengue incidence.Conclusion The generated map signifies the spatial correlation

between +ONI and ‘dengue case index’, indicating positive correlation in the central part, while

negative correlation in some coastal, northern, and north-eastern part of India. For improvement of

results, a study at micro-scale (district level) month-wise association with Indian Ocean Dipole and

local weather variables is desirable for better exploration of dengue outbreaks in the states with ‘no

association’. The findings offer reliable tool for national programme for early preparedness for

undertaking intervention measures on the basis of the forecast of El Niño Southern Oscillation (ENSO).

Introduction
Dengue is an emerging vector borne disease due to rapid urbanization, scarcity of water and

                                                   2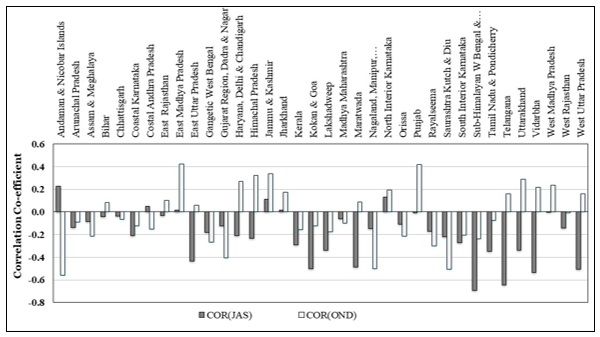
changing climatic conditions all over the globe. The transmission of dengue has close interaction of

vector, virus and human host, of which Aedes vectors are highly sensitive to climatic and

environmental factors [1]. Owing to inter-annual variability in climatic conditions, the sudden

occurrence of dengue (outbreaks) are generally witnessed in many subtropical and tropical countries

of the world [2, 3]. According to the World Health Organization [4], it is a firstly growing mosquito-

borne arboviral disease in the world that has increased 30-fold over the last 50 years. The geographic

distribution of this disease is extending its spatial and temporal limits to even new countries and from

urban to rural areas [4]. An estimated 390-million dengue infections occur annually [5], and 2.5 billion

population live in dengue-endemic countries [6] posing a serious public health challenge [7].

Several studies reveal that the dengue outbreaks are characterised by a seasonal and multi-annual

pattern of occurrence [8]. The ENSO is a naturally occurring, large scale, inter-annual climatic

phenomenon and its cold (La-Nina) and warm (El-Niño) phases trigger a significant number of climatic

anomalies worldwide which occur at 2–7 years interval over the tropical Pacific and Indian Ocean

region [9, 10]. The cycle of cooling (La-Nina) and Warming (El Niño) of sea surface temperatures (SST)

in the Tahiti and Darwin region result due to the changes in the oceanic circulation and closely are

interlinked to changing the air pressure in the East and West Pacific (Southern Oscillation) [10].

Therefore, ENSO influences the regional weather pattern (i.e., temperature and rainfall) in certain

geographic regions of the world [2]. In India, El-Niño phase triggers drier condition than normal and

La-Nina influences more rainfall [11–13]. For this reason, fluctuations in ENSO are likely to be

associated with inter-annual variation in occurrence of dengue and could even trigger the outbreaks.

Studies undertaken in several parts of the world provide evidence that the periodic outbreaks of

dengue are closely associated with local weather conditions and climate cycle of ENSO [14–16], but

the risk of outbreaks differ based on the strength of ENSO [17, 18]. According to a recent study

undertaken in India, a weak synchronous correlation was found between Niño 3.4, dipole mode index

(DMI), and dengue cases of 2010–2017 based on over dispersed datasets [19]. India consisting of 28

states and 9 union territories, with its varying topography, size and areas. It also has very diverse

climatic conditions, therefore, the association between dengue outbreaks, pre and post-monsoon

                                                    3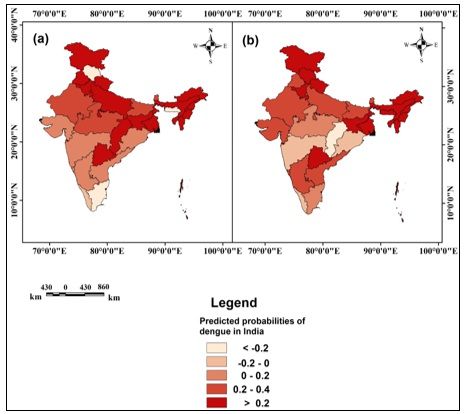
precipitation, and ENSO at least the state level is necessary. The present work focuses on finding the

relationship between ENSO, rainfall dengue cases in the post-monsoon and monsoon season in India.

The maps generated can help understand the seasonal variability of dengue outbreaks and would

help in timely response/preparedness by the NVBDCP to control outbreaks.

Database And Methodology
Data collection

Annual state-wise dengue cases datasets were collected from the ‘National Health Profile Reports’ for

the year of 1994-2009 and the website of NVBDCP for the year of 2010-2017 [20]. State-wise monthly

rainfall data from 1951 to 2016 were collected from annual summary reports of India Meteorological

Department (IMD) [21]. The three-month running mean of Oceanic Niño Index (ONI) in the Niño 3.4

regions (longitude 120°W-170°W and latitude 5°N-5°S) were collected from CPC-NOAA [22]. The

predicted data of ENSO were extracted from the IRI, Columbia University for the year of 2019.

Data processing

As the spatio-temporal fluctuation in dengue cases is very high in tropical countries like India, the

cases were brought to a single measure unit. The reported cases were converted to 3 months

averaged ‘dengue case index’. The ‘dengue case index’ (Equation no 1) calculated by ‘the relative

deviation of the number of dengue cases from mean cases’, is expressed as (See Equation 1 in the

Supplementary Files)

Where x represents average dengue cases, and indicates the mean annual dengue cases in the

Indian states.

Similarly, ‘Rainfall index’ (Equation no 2) was calculated by the ‘percent deviation rainfall from mean’.

Therefore, July-September and October-December period were considered for the seasonal analysis.

(See Equation 2 in the Supplementary Files)

Where x implies a seasonal average in a year and µ implies mean seasonal rainfall in the selected

year.

Data analysis and presentation

As the data is normally distributed based on the Shapiro-Wilk test, at 5% significant level, Therefore,

                                                    4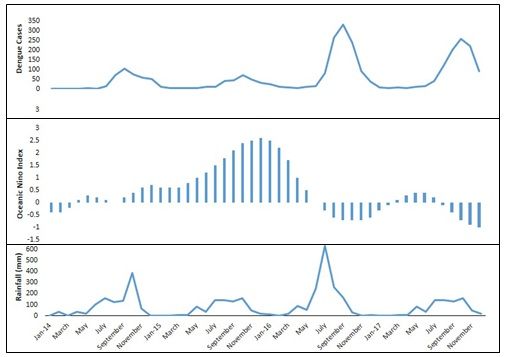
the association between +ONI and ‘rainfall index’, ‘dengue case index’ and ‘rainfall index’, and +ONI

and ‘dengue case index’ was evaluated using product-moment correlation coefficient (r)..The ‘r’

value of ≥ 0.5 and ≤ -0.5 was selected for positive and negative correlation, respectively, at 5%

significant level (P). The season-wise computed R-values between ‘dengue case index’ and +ONI were

imported to GIS platform to represent the spatial correlation map. The algorithm ‘Inverse distance

weighted’ (IDW) was used to spatially interpolate the all correlated values, creating a more precise

and smoother surface from which created from sparsely distributed datasets.

Dengue outbreak states based on ENSO outlook of 2019

To understand the phase-wise relationship between ENSO and dengue, historical Oceanic Niño Index

values were first divided into different phases, (i.e., El Niño, Neutral, and La Niña) and then correlated

with dengue cases. The values of +0.5 or higher ONI were considered as El Niño conditions, +0.5 to

-0.5 values as Neutral, and -0.5 or lower values were considered as a La Niña condition (NOAA, 2016).

The average ONI value of April, May, and June considered as + summer ONI, and July, August, and

September considered as +monsoon ONI. Thereafter, short-term probabilities of dengue outbreaks

were mapped on the basis of the predicted phase of ENSO in 2019.

Validation

To find out the relationship between monthly +ONI and ‘dengue cases’, and ‘rainfall’ and ‘dengue

cases’, Dengue data were collected from the Municipal Corporation, Delhi for Delhi and State

Programme Officer, Andhra Pradesh for the data of Visakhapatnam. Pearson’s correlation test was

adopted to find out the lag months association between +ONI and ‘dengue cases’ and ‘rainfall’ and

‘dengue cases’ based on 21 years (1996-2016) monthly data of Delhi and 4 years (2014-2017) data of

Visakhapatnam (Andhra Pradesh), where dengue outbreaks are more frequent.

Results
Correlation between ‘+ONI’ and ‘rainfall index’

The relationship between + summer ONI (April, May, June) and rainfall index of monsoon (July,

August, September) and post monsoon (October, November, December) rainfall is shown in fig 1.

During +summer ONI, when there was positive El Niño (+ONI) influence, negative correlation with

                                                    5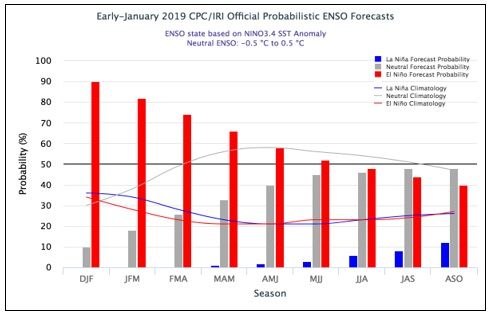
rainfall (deficit rainfall than normal ) was observed in the states of Haryana, Delhi, Chandigarh,
Kerala, West Bengal, Tamilnadu, Goa, Maharashtra, coastal Karnataka, East Uttar Pradesh, and
Gujarat. Whereas, in the states like Andaman & Nicobar Island, Coastal Andhra Pradesh, East Uttar
Pradesh, North Interior Karnataka, Jammu and Kashmir a positive correlation was found indicating
rainfall in excess of normal. A negligible relationship was found in the states of Arunachal Pradesh,
Maharashtra, east Rajasthan, east and west Madhya Pradesh.
The association between + monsoon ONI ( July, August, September) and ‘rainfall index (October,
November, December), negative correlation was found in the states of Assam, Nagaland, Andaman &
Nicobar Islands, Meghalaya, West Bengal, Tripura, Manipur, South Interior Karnataka, Tamilnadu,
Gujarat, and Pondicherry indicating rainfall deficit than normal. Whereas, the states like Haryana,
Delhi, Chandigarh, Himachal Pradesh, Jammu and Kashmir, Punjab, North Interior Karnataka,
Uttarakhand, and Vidarbha region showed positive correlation indicating excess rainfall than normal.
Insignificant relationship was found in Madhya Maharashtra, Lakshadweep, Chhattisgarh, Bihar,
Telangana, and West Rajasthan.
Correlation between ‘rainfall index’ and ‘dengue case index’
The correlation between rainfall index (monsoon season; July, August, September) and ‘dengue case
index’(July, August, September) show negative correlation that most of the states like Haryana,
Gujarat, Himachal Pradesh, Chhattisgarh, Chandigarh and Delhi, A & N Islands, Konkan and Goa,
Madhya Pradesh, Maharashtra, Nagaland, Manipur, Mizoram, Tripura, Tamil Nadu and Pondicherry,
Uttar Pradesh, Uttarakhand, Chattishgarh, and West Bengal register negative correlation (fig. 2),
indicating an increase in dengue with rainfall deficit in the monsoon season. However, when the
analyses in respect of Delhi was done with lag periods, it is found that 1-3 month lag between ‘rainfall
index’ and ‘dengue case index’. On the other hand in the states like Arunachal Pradesh, Bihar,
Jharkhand, Karnataka, Rajasthan, Andhra Pradesh & Orissa, a positive correlation was found indicating
dengue outbreaks during excess rainfall. No correlation was found in the states like Kerala, Punjab,
Assam, and Meghalaya.
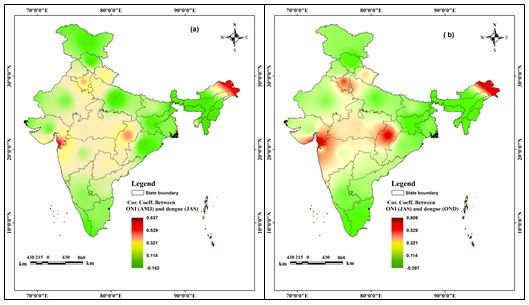
The mapping of correlation coefficient between + monsoon ONI (July, August, and September) and
6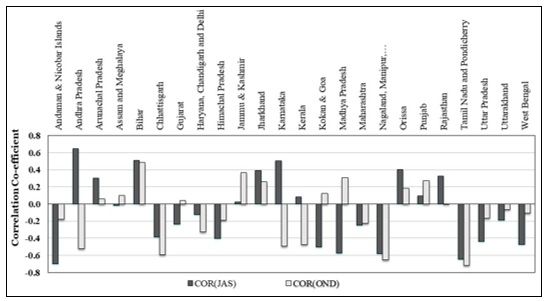
‘Dengue case index’ (October, November, and December) is shown in fig. 3b. A positive correlation

(0.40-0.68) was found in the states of Arunachal Pradesh, Chhattisgarh, Haryana, A & N Islands,

Daman & Diu, Delhi & Haryana indicating that with + monsoon ONI increase in ‘dengue cases’ is likely

to be witnessed in post monsoon months i.e. October, November and December. Whereas negative

correlation was found in the states of Assam, Himachal Pradesh, Andhra Pradesh, Jharkhand,

Meghalaya, Manipur, Nagaland, Sikkim and Mizoram reflecting decrease in dengue cases after +

monsoon ONI (monsoon El Niño). Rest of the states show ‘very low or no correlation’.

Predicted Dengue outbreak states based on ENSO outlook of 2019

As per probabilistic ENSO outlook (CPC/IRI) (fig. 4) extracted in January 2019, there are 55-72%

chances of moderate El Niño during April to June (summer season) indicating the possibility of

moderate rainfall deficit during July to September. Therefore, the states of Haryana, Himachal

Pradesh, Assam, Gujarat, Rajasthan, Delhi, Mizoram, Telangana, Madhya Pradesh, Jharkhand, Uttar

Pradesh, Tripura, and Manipur are likely to have dengue outbreaks during July to September month of

2019. (fig. 5a).

From July onwards the chances of low intensity of El-Niño (less than 50%) indicates the probability of

below-normal rainfall from July to September. The states of Rajasthan, Telangana, Haryana,

Jharkhand, Andhra Pradesh, and Gujarat are likely to have dengue outbreaks during October to

December month of 2019, provided surveillance and interventions remain unchanged (fig. 5b). From

June onwards, emerging La Nina conditions are visible, indicating that the states of Tamil Nadu,

Maharashtra, Himachal Pradesh, Chhattisgarh and Orissa are likely to have dengue outbreaks as in

these states there is negative correlation between +ONI and dengue cases.

Validation

As per results some states (i.e., Arunachal Pradesh, Chhattisgarh, Haryana, Uttarakhand, Andaman

and Nicobar Islands, Delhi, Daman and Diu) are positively correlated with ‘+ONI’ while some are

negatively correlated (i.e., Assam, Himachal Pradesh, Meghalaya, Manipur, Mizoram, Uttar Pradesh,

Orissa, Jammu and Kashmir and Andhra Pradesh). For validation of findings, long term data of one

district each from positively and negatively correlated states was showed for the detailed validation

                                                   7
of the association between +ONI and dengue cases for a micro-scale study. The results show that the
association between +ONI and occurrence of dengue cases in showed districts is statistically
significant based on hypothesis test. It indicates that in Delhi and Visakhapatnam, 1-3 months lag
between +ONI and reported dengue cases was observed. The results also showed that 2 month lag
was found between monthly rainfall index and dengue cases in both the places (Delhi and
Visakhapatnam). Lag month-wise correlation values between dengue cases and +ONI, rainfall were
shown in table 1. The largest El Niño events (ONI) resulted in very limited no. of dengue cases
reported in Visakhapatnam in 2015 (fig. 6) while Delhi recorded a very high no. of dengue cases in
2006, 2009, 2015 (fig. 7).
Table 1. Correlation Coefficients between monthly +ONI and Dengue Cases; and rainfall and Dengue
Cases (2014-2018) with different lag periods in Delhi and Visakhapatnam
Lag-months Delhi (Correlation coefficients, ‘r’) Visakhapatnam (Correlation coefficients, ‘r’)
+ONI & dengue Rainfall & dengue +ONI & dengue cases Rainfall & dengue cases
cases cases
0 0.368 -0.053 -0.541 0.316
1 0.429 0.189 -0.545 0.661
2 0.401 0.412 -0.552 0.742
3 0.217 0.285 -0.537 0.501
4 -0.152 0.093 -0.498 0.141
5 -0.178 0.079 -0.440 -0.111
6 -0.131 0.088 -0.431 -0.293
SD error 0.105 0.058 0.019 0.147
Discussion
We established an association between an intra-seasonal and inter-annual variation of ENSO and
dengue incidence in India. A significant and strong relationship was found between ENSO and inter-
seasonal and inter-annual variability of dengue via significant negative deviation of rainfall and drier
conditions suggesting that El Niño, La-Nina conditions significantly influence monsoon and post-
monsoon rainfall and subsequently dengue incidence in India. Moreover, the state-wise analysis of
dengue reveals that the great magnitude in dengue cases was observed during 2003, 2005, 2010,
and 2016 El Niño in India. In a number of studies undertaken in south Asia revealed the possibility of
8early warning of dengue outbreaks based on ENSO phases [14,16,18,23], Oceania, South America,
and in Central America [15,24,25]. The studies have affirmed that ENSO phases and intra-seasonal
and inter-annual climate prediction might offer preparedness and response for early management and
control of outbreaks of dengue [26].
Previous studies have addressed the close relationship between ENSO phases and fluctuation of
seasonal rainfall in India [11, 27]. Understanding of rainfall variability could explain the regional
variation and complexity of dengue outbreaks in India. Due to the great geographical variation in
India, transmission of dengue in all states of India is not equally influenced by the seasonal rainfall
(excess or deficit). In one region, deficit rainfall causes dengue outbreaks while in other very high
rainfall leads to outbreaks. Moreover, during El-Niño phase, the warmer temperature is possible to
favoured dengue outbreaks by increasing the replication rate of dengue viruses and by lengthening
the lifespan of mosquitoes [28]. Nevertheless, during El-Niño phase, temperature anomalies affect
small dengue incidence without the contribution of rainfall variability. Therefore, during this phase,
seasonal rainfall variabilities affect dengue incidence by the changes in the suitability of mosquito
breeding sites [29]. In addition, in some areas, collection and storage rainwater due to the poor
garbage disposal and unavailability of piped water affects the suitability of mosquito habitats and
subsequent mosquito transmission. Prolonged drier conditions during El-Niño years, water supply
problems and increasing storage of water gradually increase the suitability of breeding habitats of
vectors [30, 31].
The Indian Ocean Dipole events have been significantly influencing the rainfall during summer
monsoon season in India [32], and the values of ‘Indian Ocean Dipole index’ closely associated with
ONI [33], therefore, only ONI considered for the present study. Moreover, there are some other factors
like local climatic variables and ‘epochal variation of monsoon rainfall’, which are strongly correlated
with Indian seasonal rainfall [34-36]. In addition, dengue outbreak forecast and prediction based on
ENSO phases have limitations due to the coarse resolution data moreover, finer resolution and more
accurate real time data can improve the entire prediction and forecast scenario.
A micro-scale (City/district level) studies with month-wise association between Indian Ocean Dipole
9and local weather variables, are warranted where the low or negligible correlation between dengue
cases and ENSO events has been found. It is proposed that with the help of ENSO based analysis at
district level, early warning of outbreaks of dengue should be possible in India.
Conclusion
The current research has shown that the dengue outbreaks are very highly correlated with ENSO, and
pre-monsoon and post-monsoon rainfall particularly the states like Arunachal Pradesh, Chhattisgarh,
Haryana, Uttarakhand, Andaman and Nicobar Islands, Delhi, Daman and Diu. While the states like
Assam, Himachal Pradesh, Andhra Pradesh, Meghalaya, Manipur, Mizoram, Uttar Pradesh, Orissa,
Jammu and Kashmir shows a negative correlation between summer El Niño and dengue incidence. In
addition to predicted data of ONI and the phase-wise probability of predicted dengue outbreaks map
of the present study should possibly guide in the early warning system of dengue outbreaks system
via timely response and early preparedness by the national programme in view of ONI to control
dengue outbreaks. In order to better understand the association between ENSO and dengue, and
develop an early warning tool for mitigating and controlling dengue outbreaks in India, a more
comprehensive study at the microscale (city-level) month-wise association with Indian Ocean Dipole
and local climate variables is needed.
Declarations
Data Availability
Relevant data are within the manuscript and are freely available.
Author Contributions:
M.P.-data collection, data processing, analysis, and drafting of manuscript. P.S., G.K., and V.O.-data
collection and drafting of manuscript, R.C.D.-Conception, analysis, drafting and critical revision of
manuscript, All authors read and approved the final manuscript.
Acknowledgements
The authors would like to acknowledge Indian Council of Medical Research (New Delhi, India). Govt. of
India for funding this project (No. 6/9-7(153)/2017-ECD-II).
Competing interests
10We have no conflict of interest of any matter regarding manuscript, figures and tables that submitted
in your journal, all of submitted file is prepared by the authors.
References
1. Medlock JM, Leach SA. Effect of climate change on vector-borne disease risk in the
UK. Lancet Infect Dis. 2015;15: 721–730.
2. Kovats R, Bouma M, Haines A. El Niño and Health (WHO/SDE/PHE/99.4). Geneva;
1999.
3. Murray NEA, Quam MB, Wilder-Smith A. Epidemiology of dengue: Past, present and
future prospects. Clin Epidemiol. 2013;5: 299–309.
4. WHO. Global Strategy for Dengue Prevention and Control 2012–2020. 2012.
5. Bhatt S, Gething PW, Brady OJ, Messina JP, Farlow AW, Moyes CL, et al. The global
distribution and burden of dengue. Nature. 2013;496: 504–507.
6. Edelman R. Dengue Vaccines Approach the Finish Line. Clin Infect Dis. 2007;45: S56-
60.
7. Ferreira GLC. Global dengue epidemiology trends. Rev Inst Med Trop Sao Paulo.
2012;54: 5–6.
8. Oidtman RJ, Lai S, Huang Z, Yang J, Siraj AS, Reiner RC, et al. Inter-annual variation
in seasonal dengue epidemics driven by multiple interacting factors in Guangzhou,
China. Nat Commun. 2019;10: 1148.
9. Yeh SW, Kug JS, Dewitte B, Kwon MH, Kirtman BP, Jin FF. El Nĩo in a changing climate.
Nature. 2009;461: 511–514.
10. Stern PC, Easterling WE. Making Climate Forecasts Matter. Committee on the Human
Dimensions of Global Change. Commission on Behavioral and Social Sciences and
Education. National Research Council. [Internet]. Washington, D.C.: National
Academies Press; 1999.
1111. Kumar KK, Rajagopalan B, Hoerling M, Bates G, Cane M. Unraveling the Mystery of
Indian Monsoon Failure During El Niño. Science (80- ). 2006;314: 115–119.
12. Ropelewski CF, Halpert MS, Ropelewski CF, Halpert MS. Global and Regional Scale
Precipitation Patterns Associated with the El Niño/Southern Oscillation. Mon Weather
Rev. 1987;115: 1606–1626.
13. Ropelewski CF, Halpert MS, Ropelewski CF, Halpert MS. Precipitation Patterns
Associated with the High Index Phase of the Southern Oscillation. J Clim. 1989;2:
268–284.
14. van Panhuis WG, Choisy M, Xiong X, Chok NS, Akarasewi P, Iamsirithaworn S, et al.
Region-wide synchrony and traveling waves of dengue across eight countries in
Southeast Asia. Proc Natl Acad Sci U S A. 2015;112: 13069–13074.
15. Huang X, Clements ACA, Williams G, Devine G, Tong S, Hu W. El Niño-Southern
Oscillation, local weather and occurrences of dengue virus serotypes. Sci Rep.
2015;5: 16806.
16. Banu S, Guo Y, Hu W, Dale P, Mackenzie JS, Mengersen K, et al. Impacts of El Niño
Southern Oscillation and Indian Ocean Dipole on dengue incidence in Bangladesh. Sci
Rep. 2015;5: 16105.
17. Cazelles B, Chavez M, McMichael AJ, Hales S. Nonstationary Influence of El Niño on
the Synchronous Dengue Epidemics in Thailand. Pascual M, editor. PLoS Med. 2005;2:
e106.
18. Tipayamongkholgul M, Fang C-T, Klinchan S, Liu C-M, King C-C. Effects of the El Niño-
Southern Oscillation on dengue epidemics in Thailand, 1996-2005. BMC Public Health.
2009;9: 422.
19. Kakarla SG, Caminade C, Mutheneni SR, Morse AP, Upadhyayula SM, Kadiri MR, et al.
Lag effect of climatic variables on dengue burden in India. Epidemiol Infect.
122019;147: e170.
20. National Vector Borne Disease Control Programme (NVBDCP) [Internet]. [cited 2 Apr
2018]. Available: www.nvbdcp.gov.in/
21. Indian Meteorological Department (IMD,Pune) [Internet]. [cited 1 Feb 2018].
Available: http://www.imdpune.gov.in/
22. Climate Prediction Center, Center for Weather and Climate Prediction, NOAA, USA
(CPC-NOAA) [Internet]. [cited 4 Mar 2018].
http://www.cpc.ncep.noaa.gov/products/analysis_monitoring/ensostuff/ensoyears.shtml
23. Arcari P, Tapper N. The variable impact of ENSO events on regional dengue/DHF in
Indonesia. Singap J Trop Geogr. 2017;38: 5–24.
24. Vincent-Gonzalez MF, Tami A, Lizarazo EF, Grillet ME. ENSO-driven climate variability
promotes periodic major outbreaks of dengue in Venezuela. Sci Rep. 2018;8: 5727.
25. Brunkard JM, Cifuentes E, Rothenberg SJ. Assessing the roles of temperature,
precipitation, and ENSO in dengue re-emergence on the Texas-Mexico border region.
Salud Publica Mex. 2008;50: 227–34.
26. Kovats RS, Bouma MJ, Hajat S, Worrall E, Haines A. El Niño and health [Internet].
Lancet. Elsevier; 2003. pp. 1481–1489.
27. Dhiman RC, Sarkar S. El Niño Southern Oscillation as an early warning tool for
malaria outbreaks in India. Malar J. 2017;16: 122.
28. PAHO. Dengue and Dengue Hemorrhagic Fever in the Americas: Guidelines for
Prevention and Control [Internet]. Washington DC: Pan American Health Organization;
1994.
29. Aiken SR, Frost DB, Leigh CH. Dengue hemorrhagic fever and rainfall in Peninsular
Malaysia: Some suggested relationships. Soc Sci Med Part D Med Geogr. 1980;14:
307–316.
1330. Poveda GJ, Graham NE, Epstein P R, Rojas W, Velez ID, Quinones ML, et al. Climate
and ENSO variability associated with malaria and dengue fever in Colombia. The 10th
Symposium on Global Change Studies. Boston: American Meteorological Society;
1999. pp. 173–176.
31. Pontes RJ, Spielman A, Oliveira-Lima JW, Hodgson JC, Freeman J. Vector densities that
potentiate dengue outbreaks in a Brazilian city. Am J Trop Med Hyg. 2000;62: 378–
383.
32. Ashok K, Guan Z, Yamagata T. Impact of the Indian Ocean dipole on the relationship
between the Indian monsoon rainfall and ENSO. Geophys Res Lett. 2001;28: 4499–
4502.
33. Shao J, Wang J, Lv S, Bing J. Spatial and temporal variability of seasonal precipitation
in Poyang Lake basin and possible links with climate indices. Hydrol Res. 2016;47:
51–68.
34. Mooley DA, Parthasarathy B. Indian summer monsoon and El Niño. Pure Appl
Geophys. 1983;121: 339–352.
35. Kripalani RH, Kulkarni A. Climatic impact of El Niño/La Niña on the Indian monsoon: A
new perspective. Weather. 1997;52: 39–46.
36. Roy I, Roy, Indrani. Indian Summer Monsoon and El Niño Southern Oscillation in
CMIP5 Models: A Few Areas of Agreement and Disagreement. Atmosphere (Basel).
2017;8: 154.
Figures
14Figure 1
Correlation coefficient between ‘+ summer Oceanic Niño Index’ (April, May, June) and
‘rainfall index’ of monsoon (July, August, September) & post monsoon (October, November,
December) season.
15Figure 2
Relationship between ‘rainfall index’ and ‘dengue case index’
16Figure 3
Correlation coefficient between (a) + Summer ONI (April, May, June) and ‘dengue case
index’ in the monsoon season (July, August, September) and (b) + monsoon ONI (July,
August, September) and ‘dengue case index’ in the post monsoon season (October,
November, December).
17Figure 4
Month-wise SST anomaly and Probabilistic ENSO forecasts (Source: CPC/IRI)
18Figure 5
Predicted outbreak of Dengue in monsoon season (July to September) and post monsoon
season (October to December), 2019 based on + summer and monsoon ONI values of 2019.
19Figure 6
Reported monthly cases of Dengue, +ONI, and rainfall in Visakhapatnam for the year of
2014–2016.
20Figure 7
Reported monthly cases of dengue, ONI, and rainfall in Delhi, 1994–2016.
Supplementary Files
This is a list of supplementary files associated with this preprint. Click to download.
Equation 1.jpg
Equation 2.jpg
21You can also read


