It's Almost the End of the World and We Know It: An Examination of
←
→
Page content transcription
If your browser does not render page correctly, please read the page content below
It’s Almost the End of the World and We Know It: An Examination of
 the Future of Residential Lighting Programs
 David Barclay, NMR Group, Inc.
 Kiersten von Trapp, NMR Group, Inc.
 Melissa Meek, NMR Group, Inc.
 Shirley Pon, NMR Group, Inc.
 Lisa Wilson-Wright, NMR Group, Inc.
 Lynn Hoefgen, NMR Group, Inc.

ABSTRACT

 Residential lighting has been the workhorse of energy-efficiency programs ever since the
CFL was introduced, historically accounting for the largest share of all residential energy
savings. Depending on housing type and size, consumers can expect to replace about seven bulbs
each year. No other end use comes close to this level of turnover, which has created an
unprecedented opportunity for program intervention. While there is no doubt that residential
lighting programs have been hugely successful to date, the future is less certain.
 Right now, program administrators across the U.S. are planning the next few years of
programs and, as regulators set savings targets, we must have an informed conversation about the
future of lighting. The implementation of federal (EISA) and state standards (California CEC
standards), as well as the rapid advancement and adoption of LEDs, has program administrators
and regulators talking about the end of traditional residential lighting programs.
 In this paper, we explore data based on recently completed LED market assessments in a
program state and a non-program comparison area – as well as over a decade of LED saturation
observations. The authors leverage this data to help paint a picture of the current lighting market
and to forecast the future in the program and non-program areas (based on current market
conditions). In addition, we explore the potential impact of the second phase of the Energy
Independence and Security Act of 2007. This look into the future helps to answer the question,
“When is the end for residential lighting programs?”

Introduction
 In this paper, we examine long-term trends in residential lighting socket saturation for
Massachusetts and a non-program comparison area. We chose portions of New York
(comprising Westchester County and 40-mile radiuses around the cities of Albany, Buffalo,
Rochester, and Syracuse) as a comparison area because they present a unique opportunity to
understand how the residential lighting market has responded to the cessation of standard spiral
CFL incentives in 2012 and nearly all upstream incentives in 2014.1 In addition, the demographic
profile of the combined New York comparison area offers a close approximation to that of
Massachusetts.

1
 Note: we refer to the comparison portion of the state as New York throughout the paper. The comparison area does
not include Long Island or New York City, where some upstream program activity continues.
Prior to 2014, both Massachusetts and New York had upstream lighting program activity
and evaluations. However, in 2012, at the direction of the New York Department of Public
Service (NY DPS), New York began to exit the residential upstream market with the cessation of
standard spiral CFL incentives. In 2014, New York essentially ceased all upstream incentives
(for CFLs and LEDs). The NY DPS directive was based on the premise that the residential
lighting market would continue to transform without further intervention. At the same time,
Massachusetts continued to support CFLs through the end of 2016 and continues to support
LEDs.
 On-site lighting saturation surveys in the New York comparison area serve as a proxy to
help understand what may have happened in Massachusetts had the Massachusetts Program
Administrators (PAs) similarly eliminated standard spiral CFL incentives in 2012 or at some
point thereafter.

Methodology
Field technicians collected data for this paper were through on-site lighting inventories
conducted in both Massachusetts and New York, with on-site participants recruited via consumer
surveys. From 2013 through 2018, 2,797 on-site visits were completed in both states combined –
766 in New York and 2,031 in Massachusetts. There were two types of visits: new visits (the
first visit to a home) and panel visits (subsequent visits to homes). The 2017-18 Market
Assessment relied entirely on visits to panel households (because previous rounds had detected
no statistical difference in lighting use between new and panel households).2
 This paper also presents predicted socket saturation through 2030. We developed and
fitted adoption curves to estimate efficiency improvement and acceleration (Buskirk 2012).
Using observed changes in LED saturation, we applied a simplified logistic function to forecast
LED saturation for Massachusetts (assuming continued program support) and New York
(assuming no program support). For both forecasts, we used the following function:

 ( ) =
 1 + − ( − )
 Where,
 M = Maximum saturation, the maximum expected saturation for LEDs.
 α = Alpha, the rate at which efficiency is increasing over time. A lower alpha results in a
 flatter curve and a higher alpha results in a steeper curve.
 T = half point, the point in time where we expect saturation to reach 50%.

 For the purposes of our forecast, we assumed that LED saturation would reach a
maximum (M) of 90% saturation – with 10% of sockets being ultimately out of reach either due
to specialized features or requirements or lack of willingness to adopt LEDs. We manipulated the
alpha and half point such that the curve aligned with the observed saturation levels between 2008
and 2018. The section on these forecasts provides additional details.

2
 Site visits typically occurred in the fall and winter (crossing two calendar years). We label visits by the ending
year, as the data reflect the state of the market at that time. Therefore, the 2015-16 visits are labeled 2016 and the
2016-17 visits are labeled 2017.
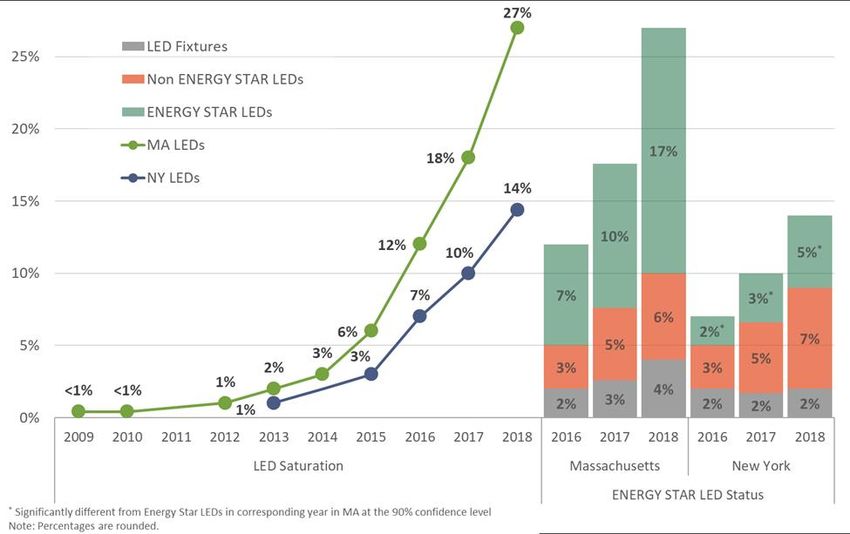
Evidence of Historical Program Effect
 Figure 1 provides saturation by bulb types over time in Massachusetts. To aid in
understanding trends, we have interpolated data to represent 2011, a year when a study was not
completed. As the data show, after a brief period of stagnation (2009 to 2012) efficient bulb
saturation has grown steadily, while inefficient bulb saturation has decreased.
 Between 2003 and 2014, gains in efficient bulb saturation were driven largely by CFL
adoption. However, after 2014, we observed a modest but steady decline in CFL saturation. At
the same time, LED adoption (and resulting saturation) began to increase rapidly. This pattern
mirrors program activity in Massachusetts, which heavily supported CFLs between 2003 and
2013 and then began to transition program support to LEDs in 2013, virtually ending program
support for CFLs as of December 31, 2016.

 Figure 1 Massachusetts saturation over time

 Figure 2 provides an overview of efficient and inefficient saturation trends from 2009 to
2018 in both Massachusetts and the New York comparison area.3 In this figure, we exclude
linear fluorescent lamps and focus on LEDs and CFLs because linear fluorescent socket
saturation has remained relatively unchanged in both areas since 2009.

3
 Prior to 2013, the New York data was collected in a broader area in New York – representing the full state.
Starting in 2013, the data shown are limited to visits conducted in a 40-mile radius around Buffalo, Rochester,
Syracuse, and Albany, and all of Westchester County.
As the figure shows, Massachusetts and the New York comparison area had similar levels
of efficient lamp saturation between 2009 and 2013. It was not until New York began to exit the
upstream lighting market that we began to observe differences in saturation between the two
states. Over a relatively short period, we see that continued program support in Massachusetts
created a substantial gap in saturation between the two areas.

Figure 2 Efficient and inefficient saturation (MA vs. NY)

 Starting with the 2016 Market Assessment, technicians collected model numbers for all
screw-base LED bulbs (but not for integrated LED fixtures) while on site. Using these model
numbers and the list of ENERGY STAR®-qualified LED bulbs, we determined whether LEDs
observed during on-site visits were ENERGY STAR qualified. Figure 3 provides the results of
this analysis for each area, as well as LED saturation overall from 2009 to 2018. In the figure, we
separate LED saturation into three distinct categories: ENERGY STAR qualified, non-ENERGY
STAR qualified, and integrated LED fixtures.
 As the data show, ENERGY STAR LED saturation was significantly higher among
Massachusetts households than New York households each year between 2016 and 2018.
Interestingly, since 2016, the two states have had nearly the same saturation levels for non-
ENERGY STAR LEDs (6% in Massachusetts and 7% in New York) and integrated LED fixtures
(4% in Massachusetts and 2% in New York). ENERGY STAR models account for the entire
LED saturation difference between the two states. Since the Massachusetts PAs’ programs
provide incentives only for ENERGY STAR LEDs, this is compelling evidence that the
Massachusetts programs are directly leading to increased adoption of ENERGY STAR LEDs.
Figure 3 LED bulb saturation MA vs. NY

Estimating LED Saturation Growth
 The first residential LED screw-base light bulb became available in 2008, but 60-watt
equivalent omni-directional LEDs did not become readily available until about three years later
(2011). In just seven years, we have witnessed LEDs being installed in 27% of the sockets in
Massachusetts and 14% in the New York comparison area. Naturally, the question facing
program administrators is, “to what extent can we expect LED saturation to continue to grow
with and without program support?” To answer this question, we sought to create a forecast of
market adoption through a market adoption curve.
 As mentioned above, we used observed data to forecast socket saturation using the
following simplified logistic function, setting M to 90% and manipulating a and T to match
observed 2009 to 2018 data for each state:

 ( ) =
 1 + − ( − )

Figure 4 below provides an overview of the final fitted curves. For both areas, an alpha of 0.28
fit the data best. The curves fit observed data best with the assumption that Massachusetts would
reach its half point in mid-2019 (assuming continued program support) and New York would
reach its half point at the start of 2021 – about one and a half years later. In the figure, the solid
green line represents observed LED saturation in Massachusetts from 2009 through 2018, and
the solid blue line represents observed LED saturation in the New York comparison area over the
same period. The dotted lines represent forecasted saturation.
Figure 4 LED adoption curves
Based on these two adoption curves, if Massachusetts continues to support LEDs between
2018 and 2020, we expect that the existing gap in LED saturation between Massachusetts and New
York will continue to widen – reaching a peak difference of 19 percentage points in 2020. In
addition, while the gap between the two curves begins to diminish in 2021, a substantial gap
(>10%) remains until after 2023. This is important because, during this period, electric customers
in Massachusetts will continue to benefit from increased saturation of LEDs and lower energy
costs.
 Market momentum leaves little doubt that both areas will reach high levels of LED
saturation. However, our adoption models suggest that Massachusetts will reach 80% saturation
in 2023, eighteen months earlier than New York. The big-ticket question is whether residential
lighting programs still have a role in energy-efficient portfolios, knowing that the lighting market
will transform at some point regardless of intervention. Massachusetts’ continued residential
lighting program has accelerated the pace of LED adoption and this method of estimation shows
that those efforts will bear fruit at least through 2021, and possibly through 2023. However, the
adoption curves estimate that the gap between program and counterfactual will begin to diminish
starting in 2022, and will be reduced to just 5% by 2025.

Other Factors Impacting Residential Lighting
Impact of CFLs

 Note that the adoption curve focuses exclusively on LEDs. As shown in Figure 1 above,
CFLs currently occupy about one-quarter of sockets in Massachusetts. However, CFL saturation
peaked in 2014 and has been steadily declining ever since. In addition, recent studies of sales
data show that CFLs accounted for less than 10% of all lamp purchases in 2017. Given the rapid
exit of CFLs from the market, and an assumed expected life of approximately seven years, we
anticipate that the majority of CFLs will burn out by 2020 or 2021 (NMR 2018a). In addition, we
expect that the swapping of CFLs for LEDs will hasten the decline of CFL saturation, given
long-standing dissatisfaction with certain CFL characteristics, including flickering, mercury,
warm-up time, and light quality (Barclay et al. 2016).

Impact of Federal Standards

 The residential lighting market has been and will continue to be impacted by not just
voluntary energy-efficiency incentive programs, but also by changes in federal regulations. The
Energy Independence and Security Act (EISA) of 20074 has had, and will continue to have, a
profound impact on the residential lighting market. While EISA encompassed a wide variety of
energy-related standards, for the purposes of this paper, we concentrate on the General Service
Lighting (GSL) standards.
 EISA laid out initial standards to be implemented between 2012 and 2014 (Phase I) and a
schedule of events that would lead to increased standards in 2020 (Phase II) and 2025 (Phase
III). The act envisioned the Department of Energy (DOE) issuing rulemakings that would take
effect in 2020 and 2025. However, it also included a provision (backstop) that would go into
effect in those years should the DOE fail to complete a rulemaking in accordance with the act or

4
 https://www.gpo.gov/fdsys/pkg/PLAW-110publ140/html/PLAW-110publ140.htm
if the final DOE rulemaking did not produce savings greater than or equal to the savings of the
backstop provision.
 Phase I of EISA went into effect in a staged process from 2012 through 2014. Phase I
increased the efficacy requirements of the most common GSLs by about 28-30%. The standards
essentially required that all GSLs provide the same efficacy as common halogen lamps. Despite
the standards taking effect up to five years ago, there is evidence of a long sell-through period –
lamps covered by 2012 standards were still being purchased by consumers in 2017. The impact
of Phase I of EISA is incorporated in observed saturation.
 On January 19, 2017, the DOE issued two rulemakings5,6 related to Phase II of EISA and
indicated that the rules would go into effect as scheduled in January of 2020. The rules
specifically cited an efficacy standard of 45 lumens per Watt (equivalent to the backstop
provision).7 In addition, the rules redefined GSL to include seven previously exempt categories
of lamps and expanded the covered lumen range. Since Phase II of EISA has yet to go into
effect, the saturation based adoption curves presented in this paper do not incorporate any
influence it may have on the market. When Phase II goes into effect, it will lead to increases in
LED saturation in both areas and will likely reduce the gap between Massachusetts and the New
York comparison area at an earlier date. However, there is much uncertainty about the
implementation of Phase II of EISA.

Enforcement

 In the January 2017 rules, the DOE explicitly stated that they may not enforce the
standards for all lamp types beginning in 2020. Instead, they may delay enforcement based on an
ongoing dialog with lighting industry stakeholders – delaying enforcement for lamp categories
without suitable LEDs (NMR 2018b).

Sell Through Period

 While the final rules say that manufacture and sale of lamps are covered, the DOE further
clarified in a footnote that the DOE would likely allow manufacturers to sell through non-
compliant lamps manufactured before the backstop goes into effect (NMR 2018b).

NEMA Settlement

 In March of 2017, the National Electrical Manufacturers Association (NEMA) filed a
petition to review the DOE rulemakings. On July 7, 2017, the DOE and NEMA reached a
settlement; NEMA agreed to withdraw its petition and the DOE agreed to complete the GSL
rulemaking and other associated regulatory activities. This settlement agreement essentially re-
opened the rulemakings and may delay enforcement by two or more years. While we have been

5
 https://www.gpo.gov/fdsys/pkg/FR-2017-01-19/pdf/2016-32012.pdf
6
 https://www.gpo.gov/fdsys/pkg/FR-2017-01-19/pdf/2016-32013.pdf
7
 Importantly, EISA directed the DOE to undertake a standards rulemaking for GSLs, to be completed by January 1,
2017. According to EISA, if the rulemaking was not complete or if the rulemaking did not produce savings greater
than or equal to the savings from a minimum efficacy standard of 45 lumens per watt, a statutory provision
(backstop) would take effect.
unable to obtain a copy of any settlement agreement, our understanding is that the DOE agreed
to do the following:
 1. Issue a Notice of Data Availability (NODA), requesting market data for GSL
 incandescent lamps and other incandescent lamps. This NODA was issued in August of
 2017.
 2. Based on a review of data provided through the NODA, issue final rules for vibration and
 rough service lamps re: the backstop. These rules were initially estimated to be delivered
 by September of 2017, but have not yet been issued.
 3. Issue a Supplemental Notice of Proposed Rulemaking (SNOPR) for GSL lamps. This
 would be expected to include standards for GSL LEDs. This SNOPR was initially
 estimated to be issued in the first quarter of 2018, but has yet not been issued.

Next Steps
 While an entire industry awaits the outcome of this process, the DOE remains silent on
the proceedings. No one knows what the outcome of the DOE’s review will be, but it stands to
reason that one of three scenarios are likely (for brevity, we have greatly simplified the
scenarios).
 • Backstop goes into effect January 1, 2020
 Scenario One: The January • Nearly all lamp categories are covered (15 exemptions for
 2017 rulemakings stand as minor categories continue)
 written. • Sunset years for all covered lamps: 2022 or 2023
 • Backstop goes into effect January 1, 2020
 Scenario Two: The • Original exemptions (aside from vibration and rough service)
 definition of GSL is amended are restored
 from the January 2017 • A-lamps between 29 W and 100 W (equivalent) are covered
 rulemakings and most of the • Sunset years for covered lamps: 2022 or 2023
 exemptions are restored. • Sunset years for non-covered lamps: 2025 or 2026

 • Backstop goes into effect January 1, 2021 or January 1, 2022
 Scenario Three: The
 • Exemptions are modified as in Scenario One or Scenario
 backstop is pushed back by
 one or two years (2021 or Two
 • Sunset years for covered lamps: 2023 or 2024
 2022).
 • Sunset years for non-covered lamps: 2026 or 2027
 Based on interviews with a variety of stakeholders, including manufacturers, retailers,
and advocacy groups, the authors believe that Scenario Two is the most likely, though we
believe all possible outcomes result in opportunities for continued program savings through at
least 2020.

Assessing the Benefit of Future Program Effects
 Based on the adoption curve forecasts, we conclude that the cumulative program effects
are essentially placing Massachusetts about one to two years ahead of New York in terms of
LED adoption. If our forecasts are correct, the question becomes whether continued program
intervention is worthwhile, or whether the Program Administrators should exit the market and
allow naturally occurring market adoption (evidence of which has been observed in the New
York comparison area) to take over. To answer this question, we examined the projected savings
that ratepayers in Massachusetts would be expected to accrue due to continued program
intervention. Figure 5 provides an overview of LED saturation by year in Massachusetts and the
counterfactual area, the difference in saturation, and the monetary savings from energy reduction
alone at the household level and statewide.8
 As the figure shows, between 2019 and 2021, as the gap between Massachusetts and the
counterfactual grows, ratepayers in Massachusetts are projected to save $200 million or more
each year.9 For context, in 2016, the Program Administrators spent $42 million on the
Residential Lighting Initiative. While EISA Phase II may truncate savings opportunities
beginning in 2021 or 2022, there are substantial opportunities to generate savings for ratepayers
in the near-term. Looking at the cumulative savings between 2013 and 2030, we would expect
ratepayers to save upwards of 1.5 billion dollars – with two-thirds of those savings coming from
annual savings between 2013 and 2021.

 Annual Monetary Savings
 Counter-
 Year MA Diff. Based on Energy Reduction
 factual
 Household Statewide
 2013 2% 1% 1% $4 $12 M
 2014 3% 1% 2% $8 $24 M
 2015 6% 3% 3% $13 $35 M
 2016 12% 7% 5% $21 $59 M
 Program History

 2017 18% 10% 8% $34 $94 M
 2018 27% 14% 13% $55 $153 M
 2019 39% 22% 17% $72 $200 M
 Near-

 2020 51% 33% 18% $76 $212 M
 term

 2021 63% 45% 18% $76 $212 M
 2022 72% 57% 15% $64 $177 M
 2023 79% 68% 11% $47 $130 M
 2024 83% 76% 7% $30 $82 M
 EISA Phase II Impacts

 2025 86% 81% 5% $21 $59 M
 2026 88% 85% 3% $13 $35 M
 2027 89% 87% 2% $8 $24 M
 2028 89% 88% 1% $4 $12 M
 2029 90% 89% 1% $4 $12 M
 2030 90% 89% 1% $4 $12 M
 Cumulative First-Year Savings $556 $1543 M
 Figure 5 First year savings over time

8
 Not accounting for non-energy impacts (NEIs), including operation and maintenance savings from not having to
replace shorter-life incandescent and halogen lamps – valued at upwards of $3 per bulb over the life of an LED.
9
 Savings were calculated by multiplying the difference in saturation by the average number of sockets per home in
Massachusetts (58), the average assumed cost of electricity (16.5 cents per kWh), the average all bulb hours-of-use
at the household level (2.7), and an average delta watt of 45. To extrapolate to statewide savings, we multiplied by
the number of occupied households in Massachusetts (2,776,061) based on the Census.
Conclusions
 Evidence to date and forecasts of future adoption clearly show that residential lighting
programs are making a difference, increasing adoption of LEDs, and moving the market forward
at a faster pace. In fact, the saturation gap between Massachusetts and the New York comparison
area has widened in each of the last three years – indicating that LED sales growth in
Massachusetts has yet to level off. If Massachusetts continues to support LEDs, we expect that
the existing gap in LED saturation between Massachusetts and New York will continue to widen,
reaching a peak difference of 18 percentage points in 2020.
 Still, naturally occurring market adoption and federal standards (EISA) are likely to
diminish the effectiveness of traditional upstream programs in the long term. Based on the
market adoption curves presented in this paper, the authors conclude that the effects the
Massachusetts upstream program are likely to continue to accelerate the pace of LED adoption
through 2021. Beginning in 2022, we expect program effects to begin to diminish. This timing
also aligns with the expected impact of the Phase II of EISA. This may mean that 2022 or 2023
is the answer to the question posed by this paper: “When is the end for residential lighting
programs?”
 However, in the near term, this paper provides strong evidence that program
administrators should consider continued support for LEDs as the savings opportunities are
enormous. Capitalizing on available residential lighting opportunities has already resulted in
millions of dollars in savings for ratepayers, and continued support will result in millions more.
While the data from this paper is specific to Massachusetts, the authors believe other program
administrators can leverage this research to help make informed decisions about the future of
their own programs.

Key Findings
 • As the gap between Massachusetts and the counterfactual grows, ratepayers in
 Massachusetts are projected to save $200 million or more annually. For context, in 2016,
 the Program Administrators spent $42 million on the Residential Lighting initiative.
 • In Massachusetts, LED saturation has increased nine-fold since 2014; in 2018, more than
 one in four sockets (27%) were filled with an LED.
 • While the New York comparison area has also experienced growth in LED saturation, in
 the absence of program support, the pace of LED adoption has been slower than that
 observed in Massachusetts.
 • Massachusetts households had significantly higher saturation of ENERGY STAR®
 LEDs compared to New York households (17% vs. 5%), representing nearly the entire
 difference in LED saturation between the two areas (27% and 14%, respectively).
 • Based on the program and non-program adoption curves, if Massachusetts continues to
 support LEDs between 2018 and 2020, we expect that the existing gap in LED saturation
 between Massachusetts and New York will continue to widen, reaching a peak difference
 of 18 percentage points in 2020. In addition, while the gap between the two curves begins
 to diminish in 2021, a substantial gap (>10%) remains until after 2023.
 • Market momentum leaves little doubt that both areas will reach high levels of LED
 saturation. However, our adoption models suggest that Massachusetts will reach 80%
 saturation in 2023, eighteen months earlier than New York.
• While EISA Phase II is expected to have a large impact on the lighting market, we
 anticipate a sell-through period, and it is not clear if the DOE will immediately enforce
 the standards.
 o While EISA Phase II may truncate savings opportunities beginning in 2021 or
 2022, there are substantial opportunities to generate savings for ratepayers in the
 near term. Looking at the cumulative savings between 2013 and 2030, we would
 expect ratepayers to save upwards of 1.5 billion dollars – with two-thirds of those
 savings coming from annual savings between 2013 and 2021.

References
Barclay, D., S. Walker, K. von Trapp, L. Wilson-Wright, and M. Nelson. 2015. We Know What
 You Did Last Summer: Revelations of a Lighting Panel Study. Long Beach, CA: International
 Energy Program Evaluation Conference. http://www.iepec.org/wp-
 content/uploads/2015/papers/174.pdf

Barclay, D., M. Nelson, K. von Trapp, S. Walker, L. Wilson-Wright, and L. Hoefgen. 2016.
 Back to the Future: Why Lighting Programs May Have Never Been More Important.
 Asilomar, CA: American Council for an Energy-Efficient Economy Summer Study.
 http://aceee.org/files/proceedings/2016/data/papers/2_686.pdf

Buskirk, Robert V. 2012. An Adoption Curve Fitting Method for Estimating Market Efficiency
 Improvement and Acceleration.
 https://www.researchgate.net/profile/Robert_Van_Buskirk/publication/271859920_An_Adop
 tion_Curve_Fitting_Method_for_Estimating_Market_Efficiency_Improvement_and_Acceler
 ation/links/54d5b9960cf25013d02bae3f.pdf?inViewer=true&disableCoverPage=true&origin
 =publication_detail

NMR. 2018a. RLPNC 17-12: Lighting Decision Making. Prepared for Massachusetts Program
 Administrators.

——— . 2018b. RLPNC 17-9: 2017-18 Lighting Market Assessment. Prepared for Massachusetts
 Program Administrators.

———, Cadmus, Tetra Tech, Navigant. 2015. Lighting Market Assessment and Saturation
 Stagnation Overall Report. Prepared for Massachusetts Program Administrators. http://ma-
 eeac.org/wordpress/wp-content/uploads/Lighting-Market-Assessment-and-Saturation-
 Stagnation-Overall-Report.pdf

von Trapp, K., D. Barclay, S. Walker, M. Meek, and L. Wilson-Wright. 2017. It’s Déjà Vu All
 Over Again: More Revelations from a Lighting Panel Study. Baltimore, MD: International
 Energy Program Evaluation Conference.
You can also read