3i Group Private Equity Capital Markets Seminar - 18 September 2019
←
→
Page content transcription
If your browser does not render page correctly, please read the page content below
3i Group Private Equity
Capital Markets Seminar
18 September 2019

Today’s seminar

                                            2018                                              2018
 Private label and contract manufacturing          Global travel and loyalty company that connects
 producer of personal care products                leading brands, travel suppliers and end
                                                   consumers
 Residual cost: £135m                              Residual cost: £129m
 Valuation: £147m                                  Valuation: £155m

                                            2017
 Value-for-money optical retailer
 Residual cost: £250m
 Valuation: £306m (at 30 June 2019)

As at March 2019, except where indicated                                                             2
Today’s presenters

Pieter de Jong                                             Andrew Olinick
Co-Head, Private Equity                                    Partner, Managing Director
                                                           North America
Joined 3i in 2004 and has been Managing Director of 3i     Joined 3i in 2007 and is Co-Head of 3i’s North America Private
Benelux since 2011, and Co-Head of Private Equity and a    Equity team and the Global Head of Business & Technology
member of the Executive Committee since 2019. He is        Services. He is based in New York.
based in Amsterdam.

Boris Kawohl
Partner, Global head of Consumer
Joined 3i in 2005. He is the Global Head of Consumer and
is based in Amsterdam.
                                                                                                                            3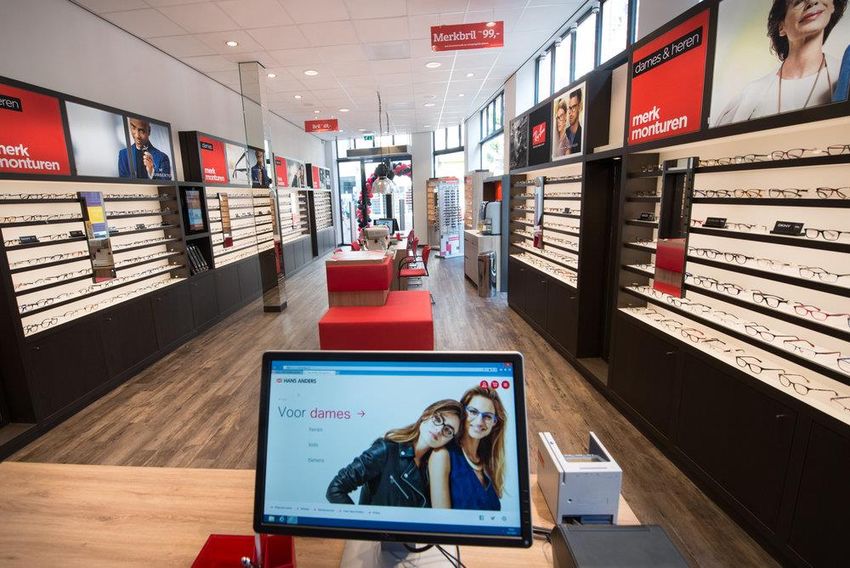
Royal Sanders
Pieter de Jong
Co-head, Private Equity

3i in the Benelux

• Amsterdam office since 1998

• Invested €1.9bn of equity in 20 deals in the Benelux

• 11 investment professionals

            Current portfolio                        Previous investments

                                                                            5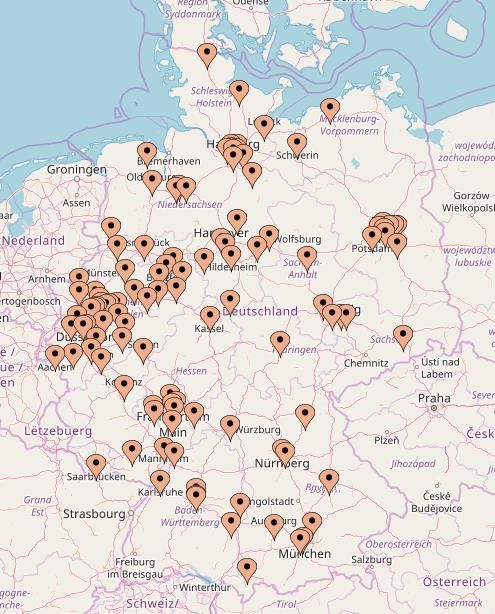
Royal Sanders
Leading European producer of personal care products

Company overview                          Deal metrics

    • Private label and contract
      manufacturing                          • Revenues of c€225m
    • Production facilities in the
      Netherlands, UK and Belgium            • £135m 3i investment
      producing c370m+ units and c3,500
      SKUs each year                         • Announced February 2018
    • Best-in-class operator
    • Industry-leading margin profile

                                                                         6
Why we like “value” as an investment theme

Why we like value                       Investment track record

   • Attractive offering to consumers

   • Polarisation

   • Increased price transparency

   • Travels well internationally

   • Clear differentiation

   • Defensive in economic downturn

                                                                  7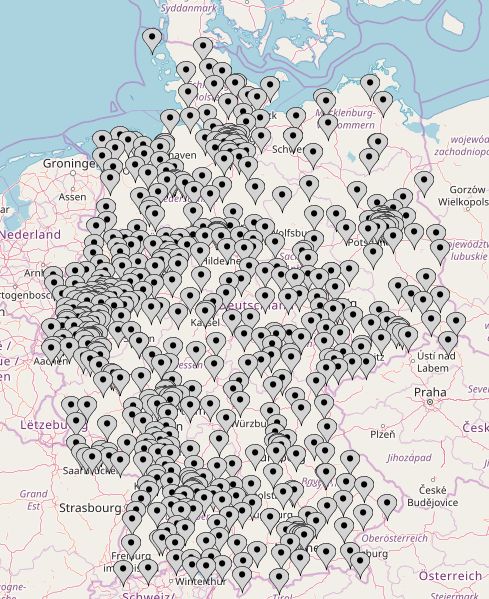
Why we like private label personal care

Why we like private label           Attractive private label category for
personal care                       retailers to differentiate
   • Value theme                            Typical personal care category

   • Resilient end-market                               €3.40 /
                                        Premium
                                                        100ml
   • Low private label
     penetration
                                                                        Delta:
                                                        €0.65 /
   • Long-term relationships with       Mid-range
                                                        100ml           €3.30 / 34x
     winning retailers and brands

   • Fragmented competitive
     landscape                                          €0.10 /
                                        Budget
                                                        100ml

                                                                                      8
Our private label track record
Refresco: created winning global platform through M&A in low-growth industry

 Refresco development

         2010                        2011                     2012                           2013                       2015                            2017
                                                      Review product portfolio
                                                      and closing of 3 plants
                                                      two add-ons

   3i investment $136m                                                                                                                            Acquisition of Cott’s
                                                             Operational               Merger with Gerber           IPO on Euronext
  financing package put          $746m Bond Issue                                                                                                  bottling activities
                                                            improvement                      Emig                     Amsterdam
          in place                                                                                                                                       ($1.2bn)

 Revenue (€bn)

                                                                                                                                                                 3.7

                                                                                                                                      IPO

                                                                                                                                                       2.3
                                                                                                                         2.0      2.0       2.1

                                                                                                1.5         1.5   1.6
                                                                                       1.2
                                                                     1.0         1.1

                                              0.6   0.6     0.7
                           0.5        0.5
            0.3      0.3
   0.1

    ’0      ’1        ’2    ’3        ’4       ’5   ’6       ’7       ’8         ’9    ’10      ’11         ’12   ’13    ’14      ’15       ’16        ’17       ’18
                                                                                                                                                                          9
 Note: highlighted bars show impact of acquisitions one year after announcement
Origination
Acceleration in a competitive auction process

                                                                  Key success factors
 2011: Spotted     Sept-Dec 2017:
   company         Met management       15 Jan 2018:               ✓ Links with 3i
 through quick      numerous times      Process start                portfolio generated
                                                                     significant
     scan          ahead of process
                                                                     credibility towards
                                                                     management and
                                                                     ability to diligence
 2011-2015             2017                 2018                     the business
                                                                   ✓ Strong support
                                                                     from experts in 3i’s
                                                                     Business Leaders
       2015: Initial            Jan 2018:
                                                    8 Feb 2018:      Network
       management             Accelerated due
                                                      Signing      ✓ Buying decision
         meeting                 diligence
                                                                     made ahead of the
                                                                     process

                                                                                            10
What attracted us to Royal Sanders
Best-in-class • Strong cost-focused culture delivers industry-leading margins
operator • Consistent growth track record, significantly outgrowing the market
Winning with the • Longstanding partnerships with winning customers for >5-10 years
winners • Mutual dependence with customer base
Platform for
• Highly attractive platform in the European market at the early stages
European of consolidation
consolidation
Defensive end • Non-cyclical and defensive industry growing in line with GDP
markets with • Focused on growing customer segments (value-for-money drugstores,
limited cyclicality discount retailers, niche brands)
Attractive • Strong and profitable historical growth track record
financial profile • High cash conversion and ROCE
11High degree of customer retention and loyalty
Longstanding partnerships with winning customers
Development of sales to a typical key Selection of key customers
customer
Note: March year-end
12Platform for European consolidation
Overview of European personal care PL / CM players Tier-1 M&A targets
Identified
in 2017
Currently
under
review
Top-5 player
in fragmented
European market
(end of 2017) Acquired Liquids personal
to date care division
Successful track record from Royal Sanders UK turnaround
✓ Acquired plant in FY12
✓ c10% sales CAGR since investment
✓ EBITDA margin improved from loss making to mid teens
Note: March year-end
13McBride personal care sites
Highly complementary geographic footprint, customers and product portfolio
Bradford, UK (c€30m sales) Ieper, Belgium (c€25m sales)
Product categories Product categories
Mouthwash Hand wash
Bath & shower Bath & shower
Shampoo/conditioner Shampoo/conditioner
Other Hair care
Selected customers Selected customers
14Acquisition of McBride personal care sites
Significant value creation potential
Investment thesis
• Highly complementary geographic footprint, customers and
Create leading European platform product portfolio
• Doubling the number of sites from 2 to 4
• Clear plan to transform loss-making sites into a profitable
Realise operational improvement business
• Purchase price attractive compared with sales level and
Buy well asset value
15Royal Sanders ready to drive further consolidation
Preston, UK Vlijmen, NL
Bradford, UK Ieper, BE
Key market presence Core markets of Key regions for M&A
at entry acquired plants
Netherlands, UK, Germany, CEE UK, France, Belgium UK, France, Germany, CEE
16ICE Andrew Olinick Partner, Managing Director, North America Global Head of Business & Technology Services
3i in North America

• 12 Private Equity investment professionals in the New York office

• Focus on Business & Technology Services, Healthcare and Industrials

                                                    Five add-on acquisitions
  Three platforms in the last two years
                                                      in the last two years

         Previous investments

                                                          Metrigraphics

                                                                               18
ICE is a market leader in closed-user group travel-based loyalty and membership programs • Founded in 1997 by technologists (and travel enthusiasts), John and Marcia Rowley, with no external capital • No readily available solution to exchange vacation ownership vacations for cruise. They built a solution • Cruise lines wanted an opaque channel to fill their ships early with great consumers. All major cruise lines signed on as suppliers • Expanded into setting up turnkey loyalty solutions for large membership organisations, focusing first on vacation ownership • Set up closed-user groups, where consumers can purchase travel at below market rates behind a log-in and using ‘points’ on the ICE platform • Business model has now grown into other industries, expanded internationally and added new products • Acquired by 3i in June 2018 in a primary buyout. The two founders re-invested alongside 3i • Acquired SOR Technology in February 2019, a highly complementary platform focused on hotel and digital subscriptions 19
Compelling proposition
ICE operates closed-user groups that allow consumers to purchase travel at
below publicly available market rates while protecting travel supplier pricing

              Example of how ICE saves
                                                                     Example ICE closed-user group
                 consumer money
For an example $2,000 product
                                                                      Suppliers

   Best available               • Publicly available market
    market rate      2,000        rates as baseline to         • Provide preferred-rate
                                  demonstrate value              inventory to receive consumers
                                                                 via ICE closed-user group
                                • Value back to consumers
   ICE savings to
     consumer           400       through the use of self-
                                  funded rewards points
                                                                   Brand Partner

                                • Consumers pay cash for
       ICE gross
        revenue
                    1,600         remaining cost after
                                  discount                       Branded as USAA
                                                                      Travel

                                • ICE receives an attractive
  ICE payment to                  preferred rate from
     supplier
                     1,330
                                  suppliers without any                                                Consumers
                                  volume commitments or
                                  inventory risk               • Improve consumer
                                • ICE retains a percentage       satisfaction;                    • Members of Brand
 ICE net revenue    270                                          receive profit share
                                  of sale                                                           Partner have access
                                                                                                    to lower cost travel,
                                                                                                    within a closed-user
                                                                                                    group
                                                                                                                            20
ICE was an ideal 3i deal, acquired in a
favourable process that leveraged our strengths
• Tracked the business since 2014, when introduced to us through BLN
• Met with management pre-process and front-loaded diligence
Process
• Won a tie due to fit with management team, ability to move quickly and
differentiated capabilities and thesis
• 3i seen as Tier 1 travel investor through Audley, Scandlines and recent
targets over the last 2-3 years
Sector knowledge
• Business model experience (e.g. network service models) through review of
BTS targets with network models over the last few years
• Worked exclusively with BLN contact who led Business Development at
ICE’s largest cruise competitor and previously worked at one of their largest
BLN customers. BLN contact joined the board
• Key BTS Advisor, Marty Cole, (Ex-Chief Executive for Accenture
Technology), joined as Chairman and advised during the deal
• Global footprint
Differentiation in • Experience with buy-and-build
the mid-market • Clear vision on how best to help the two founders
• Focus on investments in sales & consumer marketing
21ICE has several favourable and differentiated
business model attributes
• Strong, direct supplier relationships that provide ICE with unique preferred-rate
inventory. ICE has proved to cruise lines that they provide customers that spend more
onboard and have a higher lifetime value; to resorts that their customers buy more vacation
ownerships; solve supply challenges in other markets (e.g. hotel)
• Embedded brand partner relationships where ICE provides exclusive, turnkey travel
fulfillment and loyalty programmes
• Compelling end consumer value proposition where ICE can provide lower rates than
anywhere else in the market. ICE’s B2B model provides low acquisition costs with savings
passed on to consumers. ICE does not need to attract consumer leads ➔ they are
provided from the Brand Partner
• Strong technology platform that seamlessly sources and aggregates inventory from a
broad range of suppliers with clear indication to consumers on the greatest value products
and highest margins to ICE
• Skilled sales & fulfillment organisation with 2,000+ contact center employees skilled in
high-end cruise, pre-booked travel, and other large ticket products, with coverage across
the globe
22ICE has consistently grown at a 10+% EBITDA CAGR
ICE EBITDA ($m) - Sustained, long-term growth
60
~$50m
45
30
15
0
2015 2016 2017 2018
Note: ICE shown pro forma for SOR transaction
23Our investment thesis
Focused on driving increased consumer engagement, expanding
into new markets and increasing digital
Win new brand partners, expand
Market growth in cruise 6+% p.a.
outside of vacation ownership
Digital marketing to drive Shift more transactions
increased consumer engagement online and mobile
Transition to more Invest in a best-in-class
re-occurring revenue tech platform
24We are engaging on an ambitious value creation plan with
significant investment in our first 15 months of ownership
• Completed a strategy project with OC&C to set the long-term strategy with
Set the long-term a series of initiatives to accelerate growth and increase value
strategy and vision
• Added Marty Cole, former Chief Executive of Accenture Technology, and
Established a Jorge Boone, former SVP of Partner Bands at World Travel Holdings
strong board to the board
• Hired a new CFO, first-ever Chief Marketing Officer, first-ever
Upgraded senior
Chief-Human Resources Officer and VP of Finance
leadership team
• Acquired SOR Technology, a ~$10m EBITDA competitor in the closed-user
Acquired SOR group space focused on low-cost, recurring revenue, hotel-focused travel
Technology programmes. Acquisition is highly strategic and commercially synergistic
Partnered with • Partnership with an outsourced travel-focused software development firm
travel-technology to accelerate IT development at a lower cost
firm
Won several new • Won new programmes with AeroMexico, Bluegreen Resorts, and Xcaret
among several others
customers
25Introduction to SOR Technology – acquired in February 2019
Revenue ($m)
30
~$30m
• Founded by two entrepreneurs in 2007
• Software company specialising in private label
OTA-like travel clubs
20
• 95+% of transactions booked online
• Attractive financial metrics:
‒ historic revenue and EBITDA growth
of 30+% p.a. 10
‒ 2018A: ~$30m of sales with
+100% FCF conversion
• Deal closed in February 2019 0
2016 2017 2018
Highly complementary with ICE
• Builds expertise in hotel
• Increases re-occurring revenue through light-weight subscription
• Provides solution for SMBs / mid-market
• Advances digital marketing capabilities
ICE / SOR currently focused on quick-win synergies
26Foundation is set for future value creation by executing
against our plan
Ambitious digital
Growth of hotel platform – ICE & SOR Synergies –
marketing programme
a new focus for ICE hotel, cruise, etc.
under new CMO
Continued offshoring and
Launching of new
‘digitisation’ to drive Select B2C & M&A
brand partners
margin improvement
Best-in-class technology platform – currently re-architecting new platform
for use across all ICE & SOR programmes
Positive underlying market drivers in cruise and travel
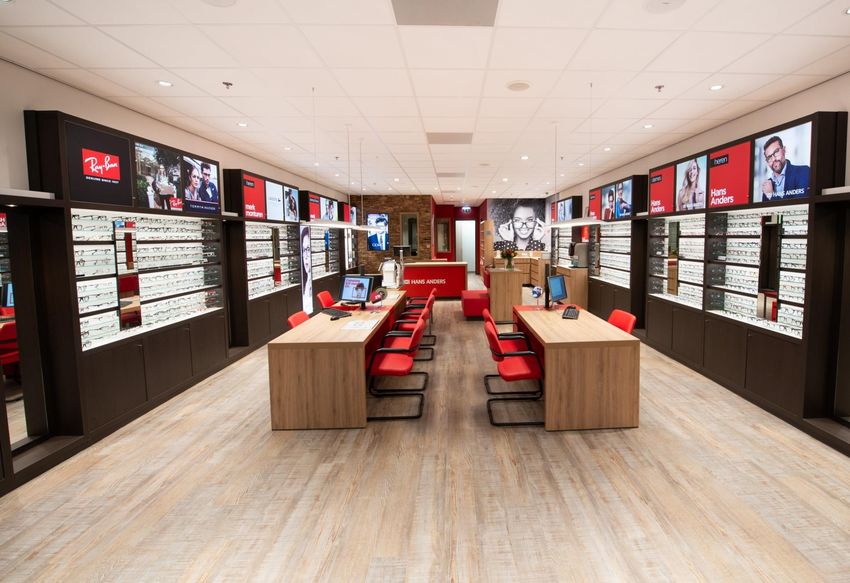
27Hans Anders Boris Kawohl Partner, Global Head of Consumer
A value-for-money optical retailer since 1982

              Then                              Now

                                                      29
Consistent growth track record
Net sales (PF eyes + more acquisition), €m • Leading value-for-money retailer of optical
and hearing aids products
~300 • Founded in Rotterdam, the Netherlands,
in 1982 and headquartered in Gorinchem
CAGR: +10%
• Focused exclusively on the growing value-
for-money segment
• Consistent track record of organic sales
growth
• Complemented with strategic M&A
• One of the largest optical retailers in
Europe with >600 stores in total, and
2013 2014 2015 2016 2017 2018 2019E
strong positions across its five markets
eyes + more
Hans Anders (incl. Direkt Optik Sweden)
30European footprint with three complementary value-for-money
formats across five countries
x # of stores
Hans Anders
44 • Founded in 1982
• 393 stores in the Netherlands and Belgium
• Leading value-for-money operator in Benelux market with
#1/#2 positions
eyes + more
• Acquired in 2018
293 • 194 stores in Germany, the Netherlands, Belgium and Austria
141
• Fastest growing chain and key value-for-money challenger
in Germany
145
8
Direkt Optik
• Acquired under previous owners in 2013
• 44 stores in Sweden
• Differentiated 3=1 offering
31Great customer value at substantially lower prices
than competitors
Attractive store environment
Best
prices
Great
service
Quality
&
expertise
323i acquired Hans Anders in a process that played
to our strengths
• Value-for-money retail core 3i focus area
Value-for-money
• Successful investment in Óticas Carol
retail business
• Strong BLN contributions
• Tracked asset through two previous ownership cycles
Local angle
• 3i Paris closely involved given French shareholder
• 3i developed differentiated view in struggling M&A process
Process dynamics
• Created privileged position for 3i
• 3i right partner to re-start international expansion
Fit with 3i strategy
• Omni-channel key element of investment thesis
33Clear value creation opportunities
• Structural growth from aging population
Attractive market • Spectacles increasingly seen as fashion item
• Value-for-money is winning
• Comprehensive operational excellence agenda
Operational
• Focus on store operations (in-store execution, staff planning), assortment
improvements and procurement
Store rollout and • Accelerated roll-out of Hans Anders format in Belgium and eyes + more
network format in Germany with attractive store payback periods
optimisation • Selected store consolidation and rent reductions
Omni-channel • Substantial investment in omni-channel organisation and systems
development • Initiatives include digital marketing, CRM, online appointments, webshop
• eyes + more presents highly strategic and value-creating acquisition
Selective M&A
• Synergies from commercial initiatives and procurement
Creation of a winning European platform
34Hans Anders operates in a highly attractive segment
of the retail market
1 Sizeable market with structural volume growth drivers
2 Highly profitable segment with room for value-for-money differentiation
3 Fragmented market that is shifting towards retail chains
4 Online pure-play formats show limited traction
5 Resilient performance through the cycle
35Hans Anders operates in a sizeable,
1
structurally growing market
Western European optical retail market, €bn
GE FR IT UK SP NL AT BE
CAGR: +2%
24.2 24.6
23.4 23.8
22.5 23.0 1.0 1.0
21.7 22.2 1.0 1.0 1.1 1.1
20.7 21.2 1.0 1.0 1.0 1.1 1.5
0.9 1.0 1.0 1.0 1.5 1.5
0.9 1.0 1.0 1.4 1.4 1.8
1.0 1.4 1.4 1.8
1.0 1.3 1.0 1.4 1.9 1.9 1.8
1.3 1.9 1.9 2.4 2.4
2.0 2.0 2.4 2.4
2.0 2.4 2.4
2.3 2.3 3.1
2.3 2.3 3.1 3.1
3.0 3.0
2.9 3.0
2.8 2.9
2.8
6.4 6.6 6.7
5.9 6.1 6.3
5.4 5.6 5.8
5.1
5.8 6.0 6.2 6.4 6.6 6.8 7.1
5.3 5.4 5.6
2012A 2013A 2014A 2015A 2016A 2017A 2018F 2019F 2020F 2021F
Source: Spectaris; Euromonitor; Statista; EY-Parthenon analysis
361
Structural drivers underpin continued volume growth
in the market
• Shorter replacement cycles
Spectacles
• More frames per customer
increasingly
seen as a • Customer journey moves towards
fashion item omni-channel
% of people who use visual aids in NL by age Population structure, EU-28, % of population by age
2009 2018
94% 98% 99% 100%
35.9% 33.5%
62% 27.9% 26.4%
Growth of 42% 45% 18.9% 20.4% 17.2% 19.8%
population 27% 34%
12%
above 50
75+
4-12
12-16
16-20
20-30
30-40
40-50
50-55
55-65
years old 55-75 0-24 years 25-49 years 50-64 years 65+
• Myopia becomes increasingly • 50+ is the fastest growing age segment
prevalent as people age (key driver
of demand for multi-focal spectacles)
Source: Eurostat; CBS
37Eyewear players are highly profitable across
2
the value chain
Adjusted EBITDA margin per latest FY reporting, % of net sales
Optical retailers Manufacturers
31%
30%
23% Ø 25%
21% 20%
Ø 17% 16% 16%
11%
GrandVision Fielmann National J!NS Hoya Essilor- Carl Zeiss The Cooper
Vision Luxottica Meditec Companies
Sizeable profit pools create room for value-for-money differentiation
Source: S&P Capital IQ
38Optical retail is still highly fragmented,
3
with a structural shift towards chains
EXAMPLE GERMANY
Total optical retail points of sale in Germany 2012-2017, # stores
CAGR: -0.5%
Key drivers
12,030 12,000 11,953 11,910 11,826 11,739
10,013 9,947 9,862 9,726 9,593 ✓ Economies of scale
-1.2% (marketing, procurement)
9,448
✓ Trend towards omni-
channel customer journey
✓ Spectacles increasingly
2,053 2,091 2,184 2,233 2,291 +2.6% seen as fashion items
2,017
2012A 2013A 2014A 2015A 2016A 2017A
Independent opticians and small chains
Large and midsize chains
Source: ZVA
39Online penetration is still relatively limited
4
in the eyewear market
EXAMPLE GERMANY
Eyewear market by channel, Germany, €m ✓ Online penetration of
prescription glasses
Offline Online sales still relatively
low
CAGR: 3.1%
6,159 ✓ No reliable online
5,831 5,954 eye tests currently
5,626
5,438
5,295 available
✓ Customers prefer
in-store consultation
+2.7% and fitting
5,707 5,896
5,416 5,606
5,165 5,273 ✓ Especially relevant
for higher-margin
multifocal glasses
✓ However, online is an
130 165 210 225 247 263 +15.1% important customer
(2%) (3%) (4%) (4%) (4%) (4%)
acquisition channel
2012A 2013A 2014A 2015A 2016A 2017F
Source: ZVA
40Product complexity and need for consultation make pure
4
play online a difficult proposition, especially for multifocal
EXAMPLE GERMANY
German eyewear market by channel and product category in 2016, % of total sales
€5,707m €247m 100 100 100
0% 100%
Contact lenses 7% 1%
Merchandise 10% Online 4%
Frames 20% 57%
Single lenses 18%
100%
99%
Offline
18% 96%
Multifocal lenses 44%
14%
10%
2%
Offline Online Eyewear Spectacle Multifocal
market optics lenses
Source: ZVA, EY-Parthenon analysis
414
Online-first formats realise that an online-only presence
does not fit the customer journey in eyewear
Online-first players have tried to disrupt optical retail with pure play ecommerce strategies,
but increasingly recognise that the eye test and fitting components of the customer journey
are difficult to disrupt
425
Highly resilient market, with a profile closer
to healthcare than retail
Y-o-y growth of German optical market vs. GDP, healthcare spending
and general clothing & footwear
Source: Euromonitor; Deutscher Sparkassen- und Giroverband; EY-Parthenon analysis
43Hans Anders acquired eyes + more in December 2018
New rollout
Strong platform in Cost and
Attractive store
value-for-money Germany, revenue
economics
proposition Europe’s largest synergies
market
Highly compelling strategic rationale
44eyes + more
Fashionable offering with a differentiated pricing model, based on uniform,
low and all-inclusive prices
eyes + more differentiates through simplicity and transparency
One price for all frames and lenses All regular additional options included in the price
Multifocal Single-vision Typical
Sunglasses Product features
glasses glasses optician
Frame ✓ ✓
Lenses ✓ ✓
Hard coating ✓ ✓
Anti-reflective coating ✓
UV protection ✓
Clean coat ✓
Lotus effect ✓eyes + more is outgrowing other mid sized optical chains
in Germany
# of stores per optical retailer in Germany
145
140
135
130
125
120
119
115
110 107
105
100
99
95
90
85
84
80
79
75
70
65
60
2014 2015 2016 2017 2018
Source: ZVA
46Substantial white space to roll out the concept with
attractive store economics
Store count of e + m vs. Apollo and Fielmann (as of September 2019)
Store count: 141 Store count: c850 x >6 Store count: c600 X >4
In a total market of c12,000 stores in Germany
Sources: Fielmann website, Apollo website, Statistisches Bundesamt, 3i analysis; maps are indicative
47You can also read