Investor Presentation - September 15, 2020 - Franchise Group, Inc.
←
→
Page content transcription
If your browser does not render page correctly, please read the page content below
Investor Presentation
    September 15, 2020

     Franchise Group Proprietary Information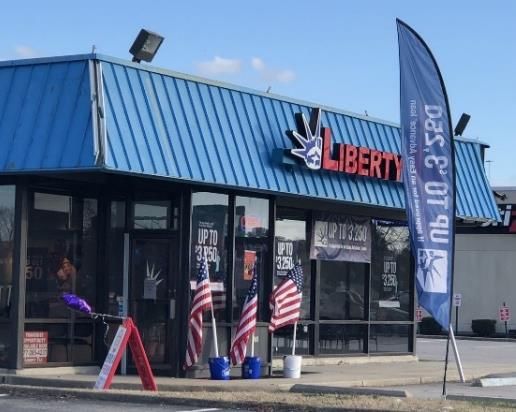
Forward-Looking Statements
 This presentation contains forward-looking statements within the meaning of the securities laws (including the Private Securities
 Litigation Reform Act of 1995). Forward-looking statements can be identified by the fact that they do not relate strictly to historical or
 current facts. They may include words or variations of words such as “expects,” “anticipates,” “intends,” “plans,” “believes,”
 “seeks,” “estimates,” “projects,” “forecasts,” “targets,” “would,” “will,” “view,” “opportunity,” “potential,” “should,” “could,” or
 “may” or other similar words or expressions that convey projected future events or outcomes. Forward-looking statements provide
 the Company’s or its management’s current expectations, predictions, opinions or judgments of future conditions, events or
 results. All statements that address operating performance, events or developments that the Company expects or anticipates will
 occur in the future are forward-looking statements. They may include estimates or projections of revenues, income, earnings per
 share, capital expenditures, dividends, liquidity, capital structure, synergies, EBITDA or other financial items, descriptions of the
 Company’s or management’s plans or objectives for future operations, products or services, or descriptions of assumptions
 underlying any of the above. Such forward-looking statements are based on various assumptions as of the time they are made, and
 are inherently subject to known and unknown risks, uncertainties and other factors that may cause actual results, performance or
 achievements to be materially different from any future results, performance or achievements expressed or implied by such forward-
 looking statements. All forward-looking statements speak only as of the date they are made and although the Company believes that
 its beliefs, assumptions and expectations with respect to forward-looking statements are based upon reasonable assumptions within
 the bounds of its existing knowledge of its business and operations, there can be no assurance or guarantee that actual results,
 performance or achievements of the Company will not differ materially from any projected future results, performance or achievements
 expressed or implied by such forward-looking statements. Actual future results, performance or achievements may differ materially
 from historical results or those anticipated depending on a variety of factors (including, but not limited to a variety of economic,
 competitive and regulatory factors), many of which are beyond the control of the Company and its management team. Furthermore,
 the Company disclaims any obligation to publicly update, clarify or revise any forward-looking statement to reflect changes in
 underlying assumptions, factors, or expectations, new information, data or methods, future events or otherwise, except as required by
 law. We refer you to the “Risk Factors” and “Management’s Discussion and Analysis of Financial Condition and Results of
 Operations” sections of the Company’s Transition Report on Form 10-K/T for the transition period ended December 28, 2019, and
 comparable sections of the Company’s Quarterly Reports on Form 10-Q and other filings, as well as additional factors that have been
 or may be described from time to time in other filings with the Securities and Exchange Commission (the “SEC”) and are available on
 the SEC’s website at www.sec.gov. You should understand that it is not possible to predict or identify all such factors and,
 consequently, you should not consider any such list to be a complete set of all potential risks or uncertainties. All of the forward-
 looking statements made in this document are expressly qualified by the cautionary statements contained or referred to herein. The
 actual results or developments anticipated may not be realized or, even if substantially realized, they may not have the expected
 consequences to or effects on the Company or its business or operations. You are cautioned not to rely on the forward-looking
 statements contained in this presentation.

Franchise Group Proprietary Information                                                                                                       2
Non-GAAP Financial Measures and Key Metrics
     and Additional Information
 Non-GAAP Financial Measures and Key Metrics

 This presentation includes Proforma Adjusted EBITDA and non-GAAP earnings per share. Proforma Adjusted EBITDA represents net
 income before interest, income taxes, depreciation and amortization adjusted for certain non-core or non-operational items related to
 restructuring and related charges, early extinguishment of debt costs, litigation settlement costs, transaction-related costs, and fair
 value acquisition accounting adjustments related to inventory. Proforma Adjusted EBITDA is a financial measure not prepared in
 accordance with generally accepted accounting principles (“GAAP”). Management believes that Proforma Adjusted EBITDA is useful
 to investors as a supplemental measure in evaluating the aggregate performance of our operating businesses and in comparing our
 results from period to period because they exclude items that management does not believe are reflective of the Company’s core or
 ongoing operating results. Proforma Adjusted EBITDA is the measure that is used by the Company’s management to evaluate
 performance and make resource allocation decisions each period. Proforma Adjusted EBITDA is also the primary operating metric
 used in the determination of executive management's compensation. In addition, a measure similar to Proforma Adjusted EBITDA is
 used in the Company’s credit facilities. Proforma Adjusted EBITDA should not be considered in isolation or as a substitute for net
 income or other income statement information prepared in accordance with GAAP and our presentation of Proforma Adjusted EBITDA
 may not be comparable to similarly titled measures used by other companies.

Franchise Group Proprietary Information                                                                                                    3
Investment Highlights
                                               Leading platform of franchised or franchisable concepts

                 Value-enhancing capital allocation strategy focused on attractive and growing dividend for shareholders

                                          Resilient throughout an economic cycle and COVID-19 pandemic

                   Disciplined, value-based acquisition strategy targeting asset-light businesses with superior cash flow

                          Synergistic platform drives significant revenue and cost synergies across portfolio concepts

                      Refranchising strategy creates significant cash inflows to de-lever and acquire additional brands

                                          Experienced management team with strong shareholder alignment

Franchise Group Proprietary Information                                                                                     4
Management Team with Strong Shareholder Alignment

                Management team owns >30% of outstanding pro forma FRG stock and is highly aligned with public shareholders

                            ▪    President, Chief Executive Officer and Director of FRG
                            ▪    Founded and serves as investment manager of Vintage Capital Management
      Brian Kahn                –         Value-oriented, operations-focused, private and public equity investor specializing in the consumer, aerospace and
         CEO                              defense, and manufacturing sectors
                            ▪    Extensive experience as an executive, director, franchisor or franchisee, and/or equity investor in franchised and franchisable
                                 businesses, including Buddy’s, Flexi Compras, Good-to-Go Wheels and Tires, Rent-a-Center, Aaron’s, Papa Murphy’s, Zoe’s
                                 Kitchen, Vitamin Shoppe, Liberty Tax, Rentway, and Red Robin

                            ▪    Executive Vice President of FRG
  Andrew Laurence
                            ▪    Partner of Vintage Capital since January 2010, responsible for transaction sourcing, due diligence and execution
       EVP
                            ▪    Previous experience as an officer and director of public companies, including API Technologies and IEC Electronics

                            ▪    Executive Vice President and Chief Administrative Officer of FRG
  Andrew Kaminsky
    EVP & CAO               ▪    Previously held executive and operating positions with Viavi Solutions Inc., Cobham plc and Aeroflex Holding Corp.
                            ▪    15+ years in investment banking, including as a Managing Director at Oppenheimer & Co. Inc. and CIBC

                            ▪    Chief Financial Officer of FRG
      Eric Seeton           ▪    Previously served as the SVP and CFO of API Technologies Corporation
          CFO               ▪    Held senior finance roles with multiple public and private companies
                            ▪    Certified Public Accountant

    Todd Evans
                            ▪    Chief Franchising Officer of FRG
  Chief Franchising
       Officer              ▪    Previously led Franchising at UBREAKIFIX/Asurion, Rent A Tire and Aaron’s, Inc.

Franchise Group Proprietary Information                                                                                                                        5
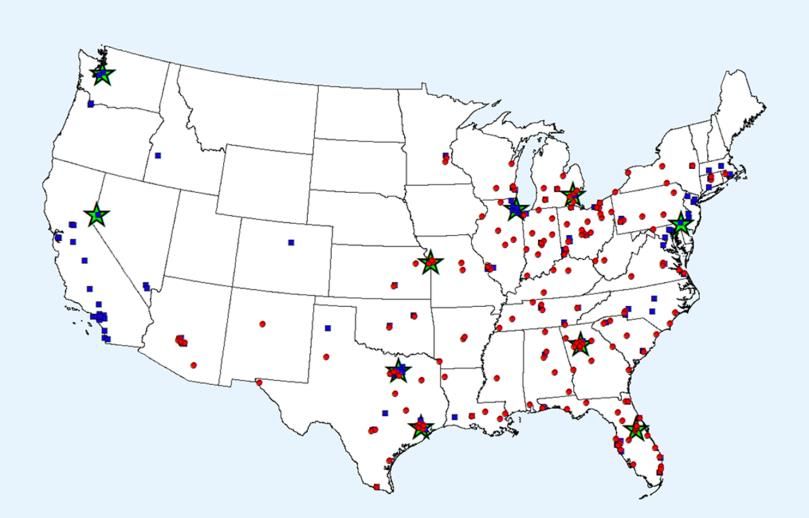
Franchise Group’s Brands
Created through the combination of American Freight and Sears Outlet
Offers deep value brand-name furniture, mattresses, and appliances at discounted prices
with flexible payment options
Buys direct from manufacturers and sells in warehouse-style stores
300+ stores in over 30 states with over 4 million satisfied customers
Leading assisted tax return preparer in the U.S. and Canada
More than 2,500 U.S. offices and 1 million annual U.S. returns
Primarily franchised business model
Specialty retailer which franchises and operates rent-to-own stores
Focus on durable goods, such as electronics, residential furniture, appliances and
household accessories
290 locations, of which approximately 70% are franchises
Omni-channel specialty retailer and wellness lifestyle company
Offers a comprehensive assortment of nutritional solutions, including vitamins, minerals,
specialty supplements, herbs, sports nutrition, homeopathic remedies, green living products,
and natural beauty aids
735 Company-operated retail stores in the U.S. under The Vitamin Shoppe and Super
Supplements banners, as well as its online store
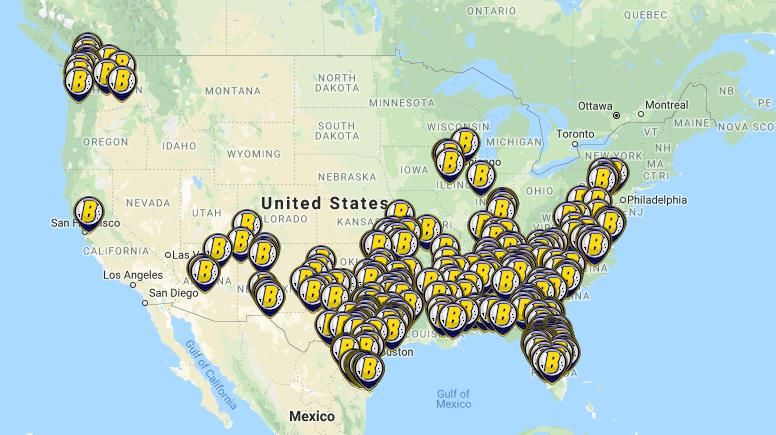
Franchise Group Proprietary Information 6American Freight – Brand Overview
Company Overview LTM Revenue Mix by Merchandise Category
▪ Following the combination of legacy American Freight and Mattresses Other
Sears Outlet, the business is a category-defining retailer of 11% 10%
value furniture and appliances with more than 300 locations
across 30+ states
– Combined business generates approximately $900 million
in revenue
– Combined Store Base covers 128 of 210 designated
market areas in the U.S. Appliances
Furniture 37%
42%
▪ Legacy American Freight stores are no-frills warehouses with
efficient merchandising to provide best-in-category value for
customers while reducing operating costs
▪ American Freight Outlet (formerly Sears Outlet) provides value
to manufacturers by offering a dependable channel for American Freight Locations
liquidation of their returned, reconditioned or scratched/dented
products
▪ Combined business operates through a simplified supply chain
that leverages domestic manufacturers and distributors
▪ Expected to continue to gain market share within the large and
growing value furniture segment as other players of scale move
towards premiumization
▪ American Freight founded in 1994 and combined headquarters
in Delaware, Ohio
Franchise Group Proprietary Information 7Buddy’s Home Furnishings – Brand Overview
Company Overview 2019 Revenue Mix by Merchandise Category
▪ Buddy’s is the 3rd largest operator of rent-to-own Smartphones, Other, 3%
(“RTO”) stores in North America, with 290 stores 5%
– Approximately 70% are franchises Computer, 8%
– Goal to become 90% franchised over time
Furniture, 42%
– Located in 21 U.S. states and territories Appliances
15%
▪ Sources products from large, well-known brands, such
as Ashley Furniture, Sealy, LG, GE, Samsung,
Whirlpool, Dell, and HP
▪ Highest percentage of franchised stores in the RTO Consumer
Electronics,
industry, providing a potential path to growth without 26%
significant capital deployment
Locations
– Buddy’s refranchising strategy provides a
“playbook” for other FRG business lines
▪ Corporate segment consists of approximately 90
Company-operated stores
– Company-operated stores serve as a proving
ground for operational initiatives
▪ Founded in 1961 and headquartered in Orlando, Florida
Franchise Group Proprietary Information 8Liberty Tax – Brand Overview
Company Overview 2019 Revenue Mix by Stream
▪ Liberty Tax is the 3rd largest institutional tax-preparation Tax Preparation Other Revenue
Fees 2%
service provider in North America, more than 2,500 U.S.
12%
offices
Interest Income
– ~94% franchised units 6%
▪ Provides federal and state income tax preparation services Franchise Fees
and Royalties
and do-it-yourself tax preparation software 52%
Financial
▪ Primarily serves the underbanked population, with ~80% of Products / E-file
Fees
its customer base earningThe Vitamin Shoppe – Brand Overview
Company Overview 2019 Revenue Mix by Channel
▪ Vitamin Shoppe is a ~$1 billion revenue national specialty health Direct To
supplement retailer with 735 locations Consumer
Sales
▪ Operates as an omni-channel specialty retailer of nutritional 11%
products in the US and internationally
▪ Approximately 14,000 SKUs from approximately 700 brands,
including The Vitamin Shoppe®, BodyTech®, True Athlete®,
Mytrition®, plnt®, ProBioCare® and Next Step® brands
▪ Ongoing shift toward private brands is expected to drive margin
expansion
– Launching private label CBD product in second half of 2020
– Private brands are exclusive to Vitamin Shoppe and drive
Store Sales
customer retention 89%
▪ E-commerce sites complement in-store experience by extending
product offerings with approximately 7,200 additional SKUs Locations
– Enables access to customers outside Vitamin Shoppe’s retail
markets and those who prefer to shop online
– Direct-to-consumer sales have grown from approximately
11% of all sales in 2019 to over 20% YTD 2020
demonstrating very strong growth in the channel
▪ Existing stores are currently Company-operated, representing a
significant potential refranchising opportunity
▪ Expected significant overhead savings opportunity from
streamlining organization and leveraging FRG shared services
▪ Founded in 1977 and headquartered in Secaucus, New Jersey
Franchise Group Proprietary Information 10Disciplined, Value-Based Acquisition Strategy
▪ Acquisition strategy targets franchised or franchisable businesses that are highly cash flow
generative and support attractive and growing dividends to shareholders
– Willing to repair and build challenged businesses
– Prepared to supplement or replace management
– Focus on low capital expenditure businesses
▪ Acquired businesses must have strong box-economics and fit into one of three categories:
– Multi-unit franchise businesses that can be scaled
– Multi-unit businesses that are predominantly corporate-owned but can be franchised
– Multi-unit businesses that can be restructured to maximize value before achieving an exit
▪ Established corporate platform enables FRG to deploy capital to acquire assets that may have
few natural buyers but become more valuable as part of FRG
– Bring more structured financial discipline
– Shared services
– Purchasing efficiencies
– Implementing best practices
Franchise Group Proprietary Information 11Strategic Brand Transformation
▪ April 2020 combination of two leading companies that
are complementary in products sold, customer base, Customer Demographics
logistics and operations to create a national 300+ store
AF Outlet
chain
– Many cost efficiencies already achieved Avg. Age 50 51
– Continued opportunity to accelerate growth Female 55% 56%
– Management team fully integrated Avg. Household Income $56K $70K
Home Owners 76% 96%
– Rebranding is complete
College Degree or Higher 35% 34%
– Extremely attractive franchising economics
High School Diploma 45% 52%
▪ Both operate multi-unit consumer businesses
– Warehouse style stores
Products Average Store Size
– Ancillary revenue (including protection plans)
AF Outlet AF Outlet
– In-home, same day delivery
– Flexible purchasing options Appliances 0% 84% Sq. Ft. 28K 35K
Furniture 76% 4%
Mattresses 24% 5%
Franchise Group Proprietary Information 12Significant American Freight Synergies
▪ At the time of the American Freight acquisition, FRG management developed a plan to
achieve approximately $42 million in annual synergies
▪ Based on performance to date, FRG now believes that there are incremental synergy
opportunities that will exceed its original plan
▪ Implementation has been accelerated, in part due to COVID-19
▪ Synergies identified across multiple functions, including:
– Merchandising
– Marketing
– Finance and operations
▪ Senior leadership assembled a single-focused American Freight management team
combing the talent from both legacy companies
▪ Additionally, FRG has leveraged its platform to drive incremental cost savings and
implement best practices
▪ Cross branding opportunity with Liberty Tax
▪ 20 Liberty kiosks are expected to open in American Freight stores for the next tax
season
Franchise Group Proprietary Information 13Strong Financial Performance
▪ Resilient model performing ahead of expectations for 2020 despite the impact of COVID-19
▪ Outperformed expectations in both the first and second quarter of 2020
▪ Raised financial guidance after each quarter
▪ Strong Non-GAAP EPS growth despite $0.30 of dilution from June common stock offering
Fiscal Year 2020
$ in MM Except per Preliminary Further Revised
Revised Guidance(2)
Share Data Guidance(1) Guidance(3)
High end of previous
Revenue $2,100 - $2,150 N/A
range
High end of previous
PF Adj. EBITDA $230 - $240 $255+
range
Non-GAAP EPS $2.35 - $2.55 $2.60+ $2.70+
Note: See slides 20 and 21 for a reconciliation of Proforma Adjusted EBITDA to GAAP
(1) Reflects March 11, 2020 FRG management guidance
(2) Reflects June 18, 2020 FRG management guidance
(3) Reflects August 5, 2020 FRG management guidance
Franchise Group Proprietary Information 14Income Statement Highlights
($ in MM)
Three Months Ended Six Months Ended
June 27, 2020 June 27, 2020
Revenue $ 512.6 $ 1,105.2
COGS 283.8 578.3
SG&A 217.3 469.5
Operating Income 11.6 57.4
Other (0.0) (4.1)
Interest Expense (31.6) (57.4)
Income Tax Expense (Benefit) 1.9 (44.0)
Net Income (Loss) $ (21.9) $ 40.0
Net Income (Loss) Attributable to Franchise Group, Inc. $ (21.7) $ 37.9
Proforma Adjusted EBITDA $ 62.7 $ 174.9
Note: See slides 20 and 21 for a reconciliation of Proforma Adjusted EBITDA to GAAP
Franchise Group Proprietary Information 15Capitalization Table
($ in MM)
December 28, Proforma
March 28, 2020 June 27, 2020
2019 June 27, 2020(2)
Cash $39.6 $147.0 $105.5 $197.0
Debt 463.6 811.5 740.6 693.0
Net Debt 424.0 664.4 635.2 496.0
Preferred Stock - - - -
Common Stock(1) 440.4 303.9 806.1 1,045.6
Enterprise Value $864.4 $968.4 $1,441.3 $1,541.6
(1) Reflects market capitalization on balance sheet date except Proforma which is at September 10, 2020
(2) Proforma takes into account the current cash balance at September 11, 2020 plus $24 million of cash for pending tax refunds
Franchise Group Proprietary Information 16Appendix
FRG History
           5.00mm                                                                                                                                                        $30
                                                                                                                      8

           4.50mm

           4.00mm                                                                                                                                                        $25

           3.50mm

                                                                                                                                                                                Price per Share
           3.00mm                                                                                                               10                                       $20
(Shares)
Volume

                                                                                                                  7       9
           2.50mm                                                                             3       5      6

                            1                                                           2
           2.00mm                                                                                                                                                        $15

           1.50mm

           1.00mm                                                                                                                                                        $10
                                                                                                  4
           0.50mm

           0.00mm                                                                                                                                                    $5
                June-18                                        March-19                                          December-19                                 September-20

                                    Franchise Group, Inc. (NasdaqGM:FRG) Volume                   Franchise Group, Inc. (NasdaqGM:FRG) Stock Price

   1)  August 1, 2018: Vintage Capital / Brian Kahn announces approximately 2.3MM share position in Liberty Tax
   2)  July 10, 2019: Liberty Tax merges with Buddy’s Home Furnishings in an all equity transaction at an implied enterprise value of approximately $122MM and announces new
       franchising business model
   3) August 8, 2019: Liberty Tax announces agreement to acquire The Vitamin Shoppe in an all cash transaction for approximately $208MM
   4) August 27, 2019: Liberty Tax announces agreement to acquire Outlet business from Sears Hometown and Outlet Stores, Inc. in an all cash transaction for approximately $133MM
   5) September 9, 2019: Liberty Tax changes its name to Franchise Group, Inc.
   6) October 23, 2019: Franchise Group closes acquisition of Sears Outlet
   7) November 12, 2019: Franchise Group announces relisting on Nasdaq and completes a cash self-tender offer for approximately $47.6MM and announces $0.25/share dividend
   8) December 16, 2019: Franchise Group closes acquisition of The Vitamin Shoppe
   9) December 30, 2019: Franchise Group announces a definitive agreement to acquire American Freight in an all cash transaction for approximately $450MM
   10) February 14, 2020: Franchise Group closes acquisition of American Freight and announces completion of new $675MM credit facility

     Franchise Group Proprietary Information                                                                                                                                   18
Proforma Adjusted EBITDA Reconciliation(1)
($ in 000s)
Three Months Ended Six Months Ended
June 27, 2020 June 27, 2020
Net Income $ (21,673) $ 37,866
Add Back
Interest expense 31,626 57,378
Income tax benefit 1,882 (43,987)
Depreciation, amortization, and impairment charges 17,865 33,792
Total Adjustments 51,373 47,183
EBITDA 29,700 85,049
Adjustments to EBITDA
Executive severance and related costs 663 5,319
Stock based compensation 1,854 4,339
Shareholder litigation costs 156 286
Corporate compliance costs 4 104
Prepayment penalty on early debt repayment - 4,048
Accrued judgments and settlements 117 (1,169)
Store closures 257 516
Rebranding costs 1,964 3,222
Acquisition costs 8,004 17,100
Inventory fair value step up amortization 7,403 28,193
Total Adjustments to EBITDA 20,422 61,958
Adjusted EBITDA $ 50,122 $ 147,007
Proforma Adjustments 12,601 27,910
Proforma Adjusted EBITDA $ 62,723 $ 174,917
(1) The Company does not provide quantitative reconciliation of forward-looking, non-GAAP financial measures such as forecasted 2020 Proforma Adjusted EBITDA or non-GAAP EPS
to the most directly comparable GAAP financial measure because it is difficult to reliably predict or estimate the relevant components without unreasonable effort due to future
uncertainties that may potentially have significant impact on such calculations, and providing them may imply a degree of precision that would be confusing or potentially misleading.
Proforma adjustments represent realized and unrealized synergies consistent with the Company’s credit agreement. Estimates exclude potential refranchising activities.
Franchise Group Proprietary Information 19Proforma Adjusted EBITDA Reconciliation(1)
For the Three Months Ended June 27, 2020
American Vitamin
Buddy's Liberty Freight Shoppe Corporate Total
(In Thousands)
Net Income $ 1,522 $ (7,322) $ (6,747) $ (3,961) $ (5,165) $ (21,673)
Add back:
Interest Expense 3,816 3,749 20,715 3,347 - 31,626
Income Tax benefit - 389 (1,545) - 3,037 1,882
Depreciation, Amortization & Impairment 1,514 2,379 1,553 12,419 - 17,865
Total Adjustments 5,329 6,517 20,723 15,766 3,037 51,373
EBITDA 6,852 (805) 13,976 11,805 (2,128) $ 29,700
Adjustments to EBITDA:
Executive Severance and Related - - 573 90 - 663
Stock-Based Compensation 70 148 - - 1,636 1,854
Shareholder Litigation - - - - 156 156
Corporate Compliance - 4 - - - 4
Prepayment Penalty on Early Debt Extinguishment - - - - - -
Accrued Judgments & Settlements - 115 2 - - 117
Store Closures 62 - - 195 - 257
Acquisition Costs 54 - 9,158 605 153 9,969
Inventory Fair Value Step-up Amortization - - 5,932 1,470 - 7,403
Total Adjustments to EBITDA 185 267 15,665 2,360 1,945 20,422
Adjusted EBITDA 7,037 (538) 29,641 14,165 (183) 50,122
Proforma Adjustments - - 10,743 2,127 (269) 12,601
Proforma Adjusted EBITDA $ 7,037 $ (538) $ 40,384 $ 16,292 $ (452) $ 62,723
(1) The Company does not provide quantitative reconciliation of forward-looking, non-GAAP financial measures such as forecasted 2020 Proforma Adjusted EBITDA or non-GAAP EPS
to the most directly comparable GAAP financial measure because it is difficult to reliably predict or estimate the relevant components without unreasonable effort due to future
uncertainties that may potentially have significant impact on such calculations, and providing them may imply a degree of precision that would be confusing or potentially misleading.
Proforma adjustments represent realized and unrealized synergies consistent with the Company’s credit agreement. Estimates exclude potential refranchising activities.
Franchise Group Proprietary Information 20You can also read