INVESTOR PRESENTATION - MAY 2021 - AWS
←
→
Page content transcription
If your browser does not render page correctly, please read the page content below

INVESTOR PRESENTATION
                 MAY 2021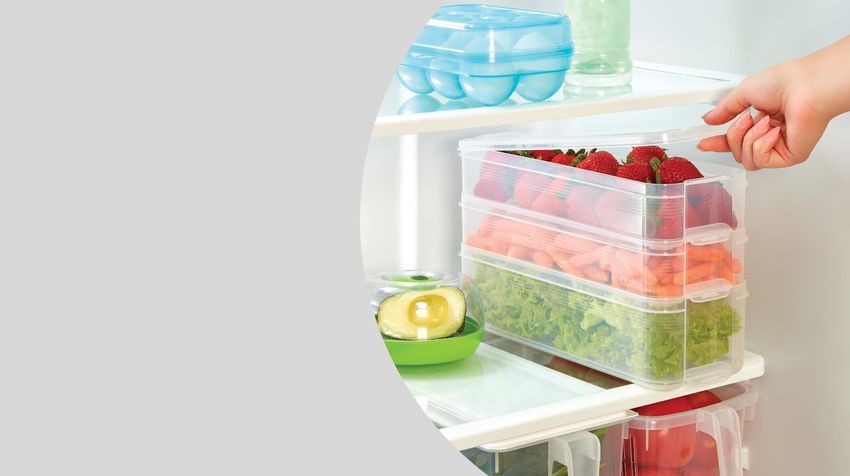
The information presented here may include statements regarding future
events and / or projected financial results. The results obtained may differ from
those projected in this presentation because they are subject to risks and
uncertainty that may change based on various factors that are not under the
control of the Company.
1

Revolutionizing

How Consumers Shop

For Household Products

2
                                            Betterware At A Glance

  Key Facts (as of 04/30/2021)
  Stock Price                                                             $47.22 USD
  Market Capitalization                                                   $1,728M USD
  FY2021 Guidance
  Net Revenue                                       $10,100M - $11,100M      39%-53% increase over 2020
  EBITDA                                            $3,000M - $3,300M        39%-53% increase over 2020
  EBITDA Margin                                           29.7%               10bps decrease over 2020
  CAPEX                                                   $460M

Notes: i ) Financial information in Mexican Pesos                                             Source: Management
Outstanding Track Record of Consistent Growth                 3

                                     Unique Business Model Supported by Three Strategic Pillars:
                                     Product Innovation, Technology and Business Intelligence

                                     Powerful Distribution Model
                                      ●   Two-Tier Independent Distributors and Associates
                                      ●   Compelling Primary or Secondary Income Opportunity

     Key Investment                   ●   Convenient Work from Home
                                      ●   Technology Based Ordering and Delivering
     Highlights
                                     Critical Mass with Significant White Space potential
                                      ●   66.4K Distributors and 1.25M Associates

                                      ●   20% Household Penetration in Mexico

                                      ●   20% Share of Wallet

                                     Asset light Business with High Free Cash Conversion
For more information, please go to
our Investor Relations website,      Talented Management Team
ri.betterware.com.mx
Outstanding Track Record of                                                                        4

                          Consistent Growth
Historic growth as of 2020
       Net Revenue                   MXN
                                    Millions
                                                      EBITDA                  MXN
                                                                             Millions
                                                                                          Associates and          Thousands

                                                                                           Distributors
                                                                                               CAGR   24%
       CAGR   23%                                     CAGR   27%
                                                                                                        CAGR   63%
          CAGR       57%                                     CAGR   64%
                                                                                                                 1,290
                           $7,260                                     $2,164

              $762                                      $179                                      113
$136                                           $22                                       20

2001          2015         2020                2001     2015          2020              2001     2015           2020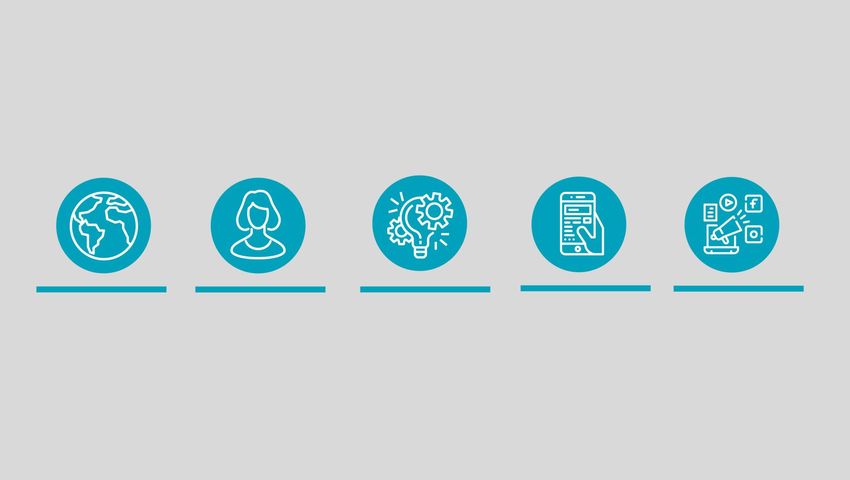
5
2020 Growth Explained By Acceleration of Long-Term
Trends
Long-Term trends, which are Betterware´s key strengths, accelerated in 2020:
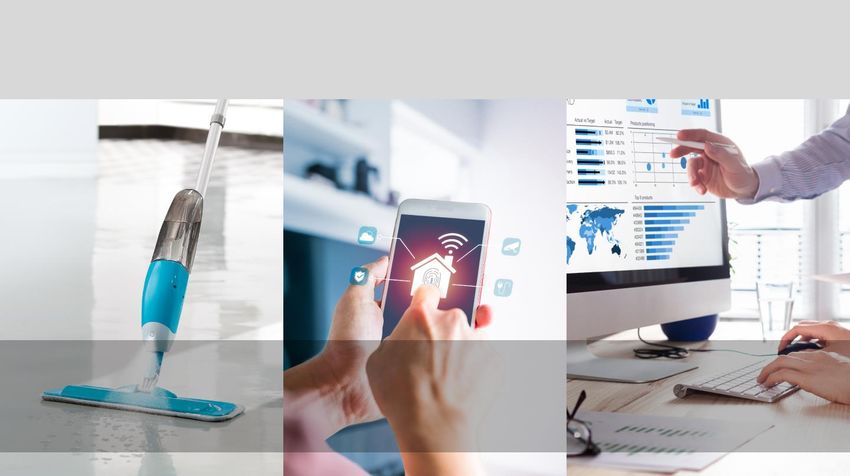
Cleaning and Home Technology
Gig Economy Big Data
Organization Solutions
Basing business decisions
Today, people are Adoption to technology will in data is more relevant
Consumer´s awareness on
looking for additional increase faster than than before. Our business
cleaning and home
income sources. expected before Covid, and model provides us with
organization will continue to
Betterware offers the Betterware is ready to take data from millions of
increase. Betterware is
unique and attractive advantage of these trends transactions that our
strategically positioned to
opportunity that current with its technologic Business Intelligence unit
offer these solutions
generations need developments translates into assertive
business decisions
Unique Business Model Supported by       6

         Three Strategic Pillars:

  Product                      Business
Innovation    Technology     Intelligence
7
 Product Innovation

   Anthropological                                                   Strategic
                                    Quick polls                                                     Pipeline
       Studies                                                       Roadmap

 Ongoing research studies       Constant feedback from our    Innovation plan updated on        Proprietary tecnology
and interviews made by our      associates and distributors   a yearly basis and monitored   platform that enables control
     anthropologists to         network through our Mobile     with every new catalogue         and agility through the
   understand our target                   App                                               product development process
consumer's lifestyle needs in
        their homes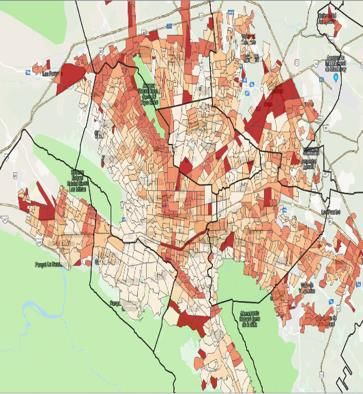
8
Product Innovation
                                                        +300 New Products
                                                             per Year
In-House Design:
Proprietary designs developed by in-house
department together with our manufacturers in Asia
and Mexico.

Betterware Design Partners:
Community of freelance designers that increase our
innovation capabilities.

Betterware Design Lab:
Co-design partnership with more than 12 of the top
universities in Mexico and more than 1,500 industrial
design students yearly.
Product Innovation 9
1Q21 Net Company Sales by Category
Kitchen Home Commuting
34% 19% 6%
Laundry & Cleaning Bathroom Bedroom
9% 14% 18%
Source: Management10
Technology
Providing a better experience for our Distributors, Associates and Customers
Mobile App New B2C digital platform
For Distributors and Associates ● New customers buy online, distributors and
● Everything on the go associates deliver products to their homes
● +1M Downloads ● Distributors and associates share contact info
● Early digitalization: key to growth during and personal buying preferences, increasing
the pandemic our ability to proactively service their needs
● Allows Cash on Delivery Payments11
Technology
Expanding and Stregthening Digitalization of our Business
Artificial Product Home
Mobile App 3.0 Intelligence Innovation 2.0 Technology Order Tracking
Upgrading our digital Expanding our AI Upgrading product Providing an efficient way Enable our
platform, focusing on capabilities by innovation management to enter new markets and distributors to track
simplicity and usability launching a technology to accelerate customer segments their orders in real-
sophisticated Chat- the decision making adding technology based time
Bot process home solutionsBusiness Intelligence 12
Best-in-class Technological Tools
Clear Strategy Product Intelligence Tight Monitoring
Well-mapped distribution Extensive product analysis to Proprietary live performance
network location and track performance and tracking platform
penetration by socio- instant market reactions
economic region • Weekly performance
• Strategy to create highly- monitoring against sales
• Locate areas within the competitive and innovative objectives
business model scope products • Detailed information of each
• Identify nearby distributors • Provide distribution network distributor number of orders,
• Contact distributor to trigger with top-quality products to average ticket, type of items,
the recruitment of associates attract new customers among others
or cover the identified zone • Big data analysis of client • Adjusting objectives based
behavior on live performance
Source: ManagementBusiness Intelligence 13
1 1
Dots represent a
Target areas by socio distributor. Color scales
economic segments indicate current week ’s
performance vs target
sales
2 2
Color scales represent Separated areas to assign
the segments’ responsibilities to
acquisition power Company’s development
managers
Source: Management14
Powerful Distribution Network Model
Overview Two-Tier Distribution Network
66.4k Distributors Rewards for Distributors
▪ 82% of Distributors place orders every week
▪ Average weekly order ticket of ~US$425 (MXN$8.5K) • 10-16% discount on its
Associates’ sales
▪ High tenure 1 Distributor places • 20-40% of Betterware
orders to Betterware Points earned by its
Associates
1.25m Associates
Distributor
▪ Place orders to their assigned distributor and are either
final consumers or the selling point with other clients
Distributor sells to a pool of Associates
▪ Do not receive commissions and are not paid for recruiting 2
Recruited (20 on average)
Rewards for Associates
• 24% discount on product
Source: Management, as of March 31st, 2021 purchases
Note: Associates need to recruit 3 individuals and Associates Referred
purchase a minimum of US$125 in order to upgrade • 1 Betterware Point for
to Distributor level every MXN$1 of purchase
3 Associates purchase and sell productsCritical Mass with Significant White 15
Space Potential
Business is highly Strong distributor and Innovation supports Increased technology New marketing to
consistent and easily associate growth in continued expansion in support including web drive increased
replicated in new 2020 – paves the way existing and new platform upgrade and awareness
markets for continued double categories digital app to increased
digit sales gains sales
Source: Management16 Growth Opportunities
Demonstrated Performance in                                                                                                                       17

  New Markets
                                                          Growth Roadmap

Well-mapped execution                   Deployment of                   Detailed geographic        Guatemala profitable     Possible New Markets:
plan focused on new and              distributors to cover                  mapping helps           in less than a year,     Colombia and Peru
    underpenetrated                 new zones and spark               distributors to grow their       proving that
     neighborhoods                  associate recruitment              productivity and avoid         Betterware can
                                                                            cannibalization        successfully replicate
                                                                                                      business model

(1) Coverage areas are considered where at least one transaction is
done during the year                                                                                                                Source: Management
18
Growth Opportunities
Organic Inorganic
Room to grow: Geographic Expansion:
● Low household penetration (20%). • Identify the right partners to replicate our business
● Low Share of Wallet (20%). model:
• Colombia and Peru
(2/3 of Mexican market size)
Market M&A:
potencial ● GuruComm
● Replicate our business model to accelerate growth in
other Direct-to-Consumer companies
● Expand our category offering within the household
through acquisitions
As of December 31, 2020.New E-Commerce Platform 19
Closer Connection to Consumers
▪On December 8th, 2020, Betterware launched its B2C web app
platform nationwide
▪E-commerce platform is an additional selling channel and
important tool which will:
✓ Attract new customers and enter untapped market segments
✓ Increase Big Data analytics and client behavior understanding
✓ Selling process automatization and efficiency in operations
▪ The Distribution Network will receive the same compensation for
the sales through the app as sales done through direct-selling
catalogues
▪ Payment flexibility by credit card or cash to DistributorNew E-Commerce Platform 20
How it Works
1 Customer makes
purchase order
2 App locates
3 Betterware delivers 4 Customer receives
the products to the products from
through the app or closest Distributor Distributor
Distributor
website
Distributor
Distributor Customer
Distributors and Associates are also able to share a Personal Link with their customers, so their purchases
are automatically assigned to the distributor or associate, who gets the benefits of that sale.Betterware Connect 21
▪ On March 22, Betterware acquired 60% of GuruComm with an
Enterprise Value od $75M Pesos (approximately $3.5M USD).
GuruComm will operate within Betterware, as Betterware Connect.
▪ The acquisition will not be material for Fiscal Year 2021 results, but
Betterware expects it to be material in the next three to four years.
▪ Betterware Connect intends to launch technology-based solutions
through three different product segments:
1) MVNO including mobile voice and data, personal hotspot and wireless
broadband offerings.
2) Smart Home including a range of Smart Home and Smart Device
solutions.
3) Home Software-based solutions for a variety of household needs and
tasks.
▪ Betterware Connect adds compelling technology-based home
solutions to Betterware portfolio.New Category: 22
Home Renovation
▪ The 2 catalogues launched during 1Q21
included 31 products of the Home
Renovation Category.
▪ Betterware expects this category to
represent approximately 7-8% of Net
Sales of each catalogue.Asset light Business with High Free Cash 23
Flow Conversion +300 New Products
Adjusted Levered Free Cash Flow per Year
Capital Expenditures as % of Net Revenues
(Ps. Millions) $700 8.5% 9.0%
1400
8.0%
$600
1200
5.9% 4.3% 7.0%
65% $500
64% 6.0%
1000
59%
54% 54% $400
800
47% 1,140 1,140 5.0%
2,050 $300 618 4.0%
600
2.4% 2.3% 460 3.0%
400
1,266 408 $200 408
0.9% 2.0%
457 $100 183 1.0%
200
228 273
135 25 34 21
0
$- 0.0%
2016 2017 2018 2019 2020 2021E 2016 2017 2018 2019 2020 2021E
The New Campus and extraordinary technology investments are
Source: Management
expected to represent approximately 81% of Total CAPEX for 2021 (E),
1. Adj. Levered FCF as % of EBITDA down from 92% in 2020 and 88% in 2019.
Notes: i) Financial information prepared in accordance with IFRSNew Corporate Headquarter Campus Allows for Increased Efficiencies 24
Optimized process
Manufacturing Warehousing Distribution
▪ Betterware has a warehouse facility
▪ Betterware ships to distributors once a
where it receives all products imported
▪Betterware’s products are designed and week through third-party companies
from China (that arrive at the Manzanillo
branded by the Company but with whom the Company maintains
port)
manufactured by third party factories strong working relationships
certified under Betterware’s quality ▪ The products are then shipped to the ▪ The distributor personally delivers orders
standards. Company’s distribution center in to each of its associates, whom in turn
Guadalajara deliver to final customers, eliminating last
▪Approximately 90% of its products are ▪ In the distribution center, the Company’s mile costs for the Company
manufactured in China and 10% assembly line sets up packages to be ▪ The distribution center also stores and
domestically sent to distributors by region on a weekly ships reward products to the distribution
basis network
▪Our office in Ningbo (China) handles ▪ Key metrics
▪ Key Metrics
factory certification, product quality
▪ 98.8% service level ▪ 98% on-time delivery
assurance and product innovation
▪ 80-day service level inventory ▪ 24-48hrs. delivery time
▪ 2% excess inventory ▪ Long-haul distribution costs
▪ 0.3% defective claims account for ̴4% of net sales
The Company quickly adapted to accelerated growth in 2020, reaching optimal service levels by
Q3 2020 Source: Management25
Talented Management Team
LUIS CAMPOS ANDRES CAMPOS DIANA JONES MAURICIO ÁLVAREZ LUIS LOZADA
EXECUTIVE CHAIRMAN CHIEF EXECUTIVE OFFICER (CEO) CHIEF FINANCIAL OFFICER (CFO) CHIEF INFORMATION OFFICER CHIEF STRATEGY OFFICER (CSO)
(CIO)
Mr. Campos has been in the direct- Mr. Campos has been CEO of Diana Karina Jones Villalpando has Luis Lozada joined Betterware in
to-consumer sales business for Betterware de Mexico since 2018. served as Betterware CFO since Mauricio Alvarez Morphy joined the January 2021, as Chief Strategy
almost 29 years. He has been Prior to becoming CEO, within the 2020. Mrs. Jones previously company as CIO in August 2020 Officer. Prior to Betterware, Mr.
Chairman of Betterware de Mexico Company, Mr. Campos served as performed as Betterware's responsible for information Lozada was an Associate Partner
since he bought the Company in Commercial Director (2014 – 2018) technology spanning applications,
Director of Comptroller (2018-2019) with Bain & Company, where he
2001. Prior to Betterware, Mr.
and Strategy and New Businesses data, cybersecurity and
Campos served as Chairman of and Director of Finance Planning infrastructure, all a vital part of nearly
worked for almost fifteen years
Tupperware Americas (1994 – 1999), Director (2012 – 2014). Prior to (2019-2020). Prior joining the (2006 – 2020) advising senior
every aspect of our customer and
Chairman of Sara Lee — House of Betterware, Mr. Campos worked in Company, she worked as Director service experience. Mauricio joined executives of multi national
Fuller Mexico (1991 – 1993), and the Corporate Banking area of of External Audit in KPMG Betterware from multinational companies on a variety of
Chairman of Hasbro Mexico (1984 – Grupo Financiero Banamex (2005 Cardenas Dosal, S.C., (2003-2018), management topics. Mr. Lozada’s
customer experience company
1990). Mr. Campos is an active – 2010) and in KPMG as an Auditor including a term at New York City Atento where he was Chief area of expertise resides on
member of the advisory board of
(2004 – 2005). Mr. Campos holds a from 2008 to 2010. Mrs. Jones Information Officer for the US, business strategy and
Grupo Financiero Banamex and he
was an active member of the Direct bachelor’s degree in Business holds a degree in Public Mexico and Central America. performance improvement, with
Selling Association, the Latin Administration from Monterrey Accounting and Finance from the Previous to Atento, Mauricio co- retail and consumer-goods
America Regional Managers’ Club, Institute of Technology and Monterrey Institute of Technology founded Flip Technologies, a SaaS companies. Mr. Lozada holds a
the Conference Board and the Higher Education (Instituto and Higher Education (ITESM), as provider for non profit organizations bachelors degree in Chemical
Communications Council. Tecnologico y de Estudios well as an MBA with specialty in and held various IT & Innovation Engineering from Monterrey
Additionally, he has performed as leadership roles of increasing
Superiores de Monterrey – Finance from Tecmilenio Institute of Technology and Higher
board member of the Economic responsibility at The Coca-Cola
Development Commission of Mid “ITESM”) and an MBA from Cornell University. She is also a Certified Education (Instituto Tecnologico y
Company globally. Mauricio holds a
Florida, Casa Alianza-Covenant University. Public Accountant on behalf of de Estudios Superiores de
bachelor’s degree in Computer
House, the Metro Orlando the Mexican Institute of Public Monterrey – “ITESM”) and an MBA
Systems from the Universidad
International Affairs Commission, Accountants. from Cornell University.
Iberoamericana in Mexico City.
SunTrust Bank and Casa de Mexico
de la Florida Central, Inc.Outstanding Track Record of Consistent Growth 26
Unique Business Model Supported by Three Strategic Pillars:
Product Innovation, Technology and Business Intelligence
Powerful Distribution Model
● Two-Tier Independent Distributors and Associates
● Compelling Primary or Secondary Income Opportunity
Key Investment ● Convenient Work from Home
● Technology Based Ordering and Delivering
Highlights
Critical Mass with Significant White Space potential
● 66.4K Distributors and 1.25M Associates
● 20% Household Penetration in Mexico
● 20% Share of Wallet
Asset light Business with High Free Cash Conversion
For more information, please go to
our Investor Relations website, Talented Management Team
ri.betterware.com.mx27 Financial Overview
Strong Growth Continues in Q1 2021                                                                     28

                                                  First Quarter Fiscal Year 2021 Financial Results

                    Q1 2021 vs. Prior-Year Quarter ($ in Pesos)

                             Q1 2021 Net Revenue                       $2,901.7 million       205% increase over Q1 2020
                                                                   $923.1 million or up 679
                                 Q1 2021 EBITDA                    basis points to 31.8% of   287% increase over Q1 2020
                                                                          Revenue

                                    Q1 2021 EPS                            $17.45             273% increase over Q1 2020

                              Q1 2021 Distributors                     66.4 thousand          158% increase over Q1 2020
                               Q1 2021 Associates                        1.25 million         161% increase over Q1 2020

Source: Management
Notes: i) Financial information prepared in accordance with IFRS
Historical Financial Overview 29
Distributors and Associates Net Company Sales
(In ‘000s) (Ps. Millions)
1,290 +46% vs 2020
1,316
1,231
504
1,250
438
10,600
343
478
7,260
213 2,902
417
162 325
201 3,085
152 2,317
1,063 1,450 953
12 18 21 60 66
10 26
2016 2017 2018 2019 2020 1Q20 1Q21 2016 2017 2018 2019 2020 2021E
1Q20 1Q21
Net Company Sales 2021 calculated with the mid-point of the Guidance
Source: Management
1. Net Company Sales: Revenue after VAT, returns and discounts to Distributors and Associates
Notes: i) Financial information prepared in accordance with IFRSHistorical Financial Overview 30
Gross Margin and EBITDA Margin2 EBITDA Evolution
(Ps. Millions) +46% vs 2020
3,150
59.8% 61.5%
58.6% 58.5% 2,164
54.7% 923
1,140
851
408
29.8% 29.7% 578
27.6%
23.6% 24.5% 24.9%
355 238
251
2016 2017 2018 2019 2020 2021E
2016 2017 2018 2019 2020 2021E 1Q20 1Q21
2021E EBITDA and EBITDA Margin calculated with the mid-point of the Guidance
Source: Management
1. Net Company Sales: Revenue after VAT, returns and discounts to Distributors and Associates
2. Over Net Company Sales
Notes: i) Financial information prepared in accordance with IFRS31
Commercially Aggressive, but
Financially Conservative
Stable Gross Margin Prudent Leverage Ratio
▪ Historically, the Company has been able to maintain a ▪ The Company has maintained a prudent and improving
stable gross margin despite external shocks, such a Leverage Ratio (Net Debt to EBITDA Ratio)
depreciation of the Mexican Peso.
100% 3.0x 2.7x
$22
80% 2.5x
$20
60% 2.0x 1.0x
$18
1.5x
40% $16
0.8x
1.0x 0.5x
20% $14
0.5x
0% $12 -
(0.0x)
2013 2014 2015 2016 2017 2018 2019 2020
(0.5x)
Gross Margin (Left) MXN/USD (Right)
2016 2017 2018 2019 2020
▪ Most of our costs are denominated in US Dollars, and we ▪ Strong Balance Sheet for possible Inorganic growth
mitigate our currency risk hedging our expected costs through M&A and additional investments.
from 6 to 12 months in advance using Derivatives.Historical Financial Overview (Cont’d) 32
Strong Balance Sheet and Cash Generation
▪ Capex requirements are low, estimated CAPEX of Ps. $460M for 2021.
1,140
▪ Minimal working capital needs with suppliers fully financing the inventory and
receivables cycle.
408
▪ Betterware has a solid balance sheet with a healthy net leverage ratio (Net
Debt / EBITDA) of 0.01x, as of March 2021.
Source: Management
Notes: i) Financial information prepared in accordance with IFRSHistorical Financial Overview (Cont’d) 33
Dividends to Shareholders Working Capital1 & Cash Conversion
+69% vs 2020
(Ps. Millions) (Ps. Millions) Days of Cash Conversion Cycle
36
69 0
12 -13
-8 -20
-24 -30
1 -8
7
4.6% -4.3% -3.9% -2.1% -6.9% -6.0%
1,400 -1000.0%
-3000.0%
$48.4
-5000.0%
830 -$62.0 -$61.7
-7000.0%
-$91.3 -$504 -$670.0 -9000.0%
-11000.0%
343
51 235 -13000.0%
-15000.0%
2016 2017 2018 2019 2020 2021E 2016 2017 2018 2019 2020 2021E
Net Company Sales 2021 calculated with the mid-point of the Guidance
Source: Management
1. Working Capital as % of Net Revenue
Notes: i) Financial information prepared in accordance with IFRS34
SPAC Total Return for Completed Business Combination in Q1 2020
Total return calculated from closing of SPAC merger through
April 30, 2021
Of the 65 SPACS that
500% 455%
completed business
combinations in 2020, trading
400% on US exchanges, BWMX was
the highest performing SPAC
300% with a 455% Total Return
200%
100% 76%
24% 21% 20% 14% 7%
0% BWMX Betterrware de México
VVNT Vivint Smart Home,Inc.
-20%
-100% -43% VRT Vertlv HoldIngs Co.
GDYN Grid Dynamics Holdings
-92% IGIC International General Insurance HoldIngs
ALTG Alta Equipment Group, Inc.
-200% PAE PAE Inconrporated
BWMX VRT ALTG VVNT GDYN ATCX IGIC PAE GSMG METX ATCX Atlas Technical Consultants, Inc.
GSMG Glory Star New Media Group HoldIngs Ltd.
03/12/20 02/07/20 02/14/20 01/17/20 03/05/20 02/14/20 03/17/20 02/10/20 02/15/20 03/30/20 METX Meten EdtechX Education Group LTd
Source: Bloomberg35 Thank you for your attention! Our commitment is to keep you informed. INVESTOR RELATIONS ir@better.com.mx +52 (33) 3836-0500 https://ri.betterware.com.mx/
You can also read