Q3FY21 Results Presentation - DLF Limited - Cyber Park Gurgaon
←
→
Page content transcription
If your browser does not render page correctly, please read the page content below
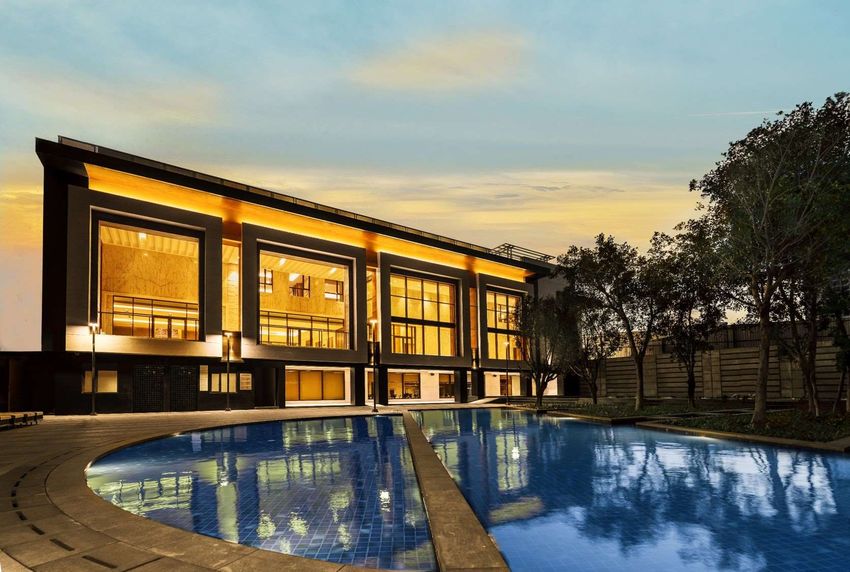
Cyber Park
Gurgaon

             DLF Limited
             Q3FY21
             Results Presentation
                                    1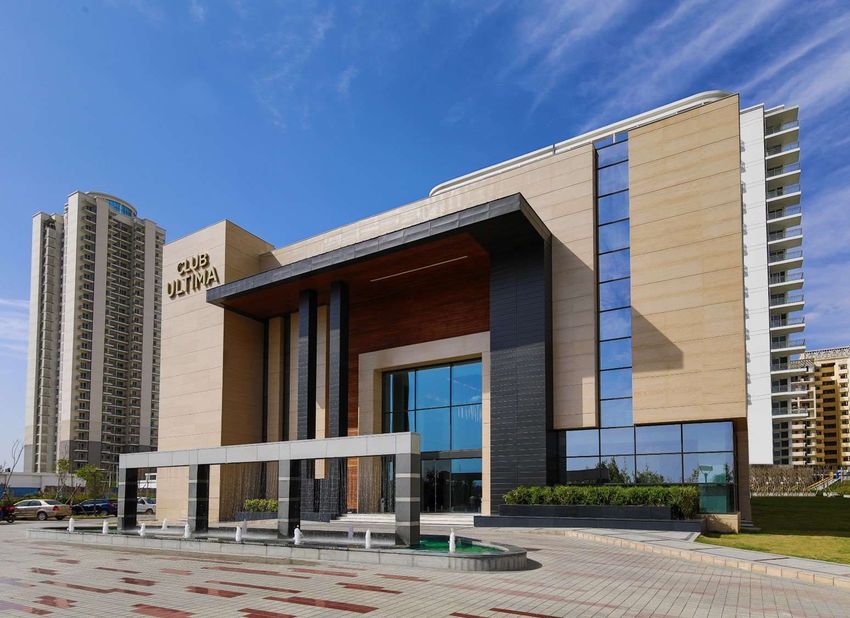
01   Overview

              DLF Limited:
AGENDA   02
              Business Update

              DCCDL:
         03   Business Update

                                2
OVERVIEW : DLF Group

                          Residential                Offices               Retail             Other Business
Business                Apartments/Plotted/            Cyber City/Cyber                       Service & Facility
                                                         Parks/IT SEZ                      Management/Hospitality
                        Townships/Low-rise

                         75                         150+                   330 msf+                100 msf+
Track           Years of experience in            Real estate
                                                                          Area developed       Deliveries since IPO
record         real estate development        projects developed

                      215 msf+                  ~35 msf                   ~39 msf              ~INR 60 bn
                    Developmental         Operational Rental       New Products Pipeline
 Scale                                                                                      Completed Inventory
                       potential              portfolio              (Devco & Rentco)
                   (Devco & Rentco)

                      Strong brand            Focused on Safety,          Strong Leadership
                                                                                               Strong Promoter
Organization                                   Sustainability &           with experienced
                                                 Governance                                      commitment
                                                                               teams

                                                                                                                      3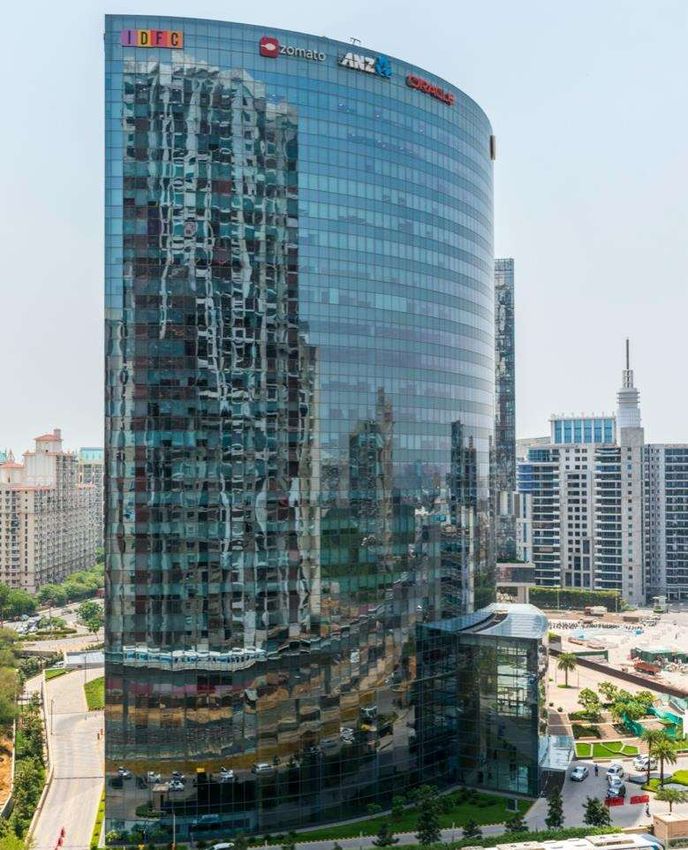
ESG Update

                            ❖ DLF Limited recognized as an index component of Dow Jones Sustainability
                              Index (2020) in the Emerging markets category.
                            ❖ Demonstrates DLF’s focus on Environmental, Social and Governance initiatives.

                                                                                       Leadership position
                          100th   Percentile                                           DLF is the only real
93rd Percentile                                         18th out of 250
                          Environment reporting;                                       estate company from
Overall score in                                        DLF ranks 18th amongst
                          Social reporting; and                                        India, to be included in
Environment, Social and                                 250 companies globally
                          Social Integration &                                         this index. Joins the
Governance parameters                                   for its ESG practices
                          regeneration                                                 ranks of just 11
                                                                                       companies from India.

                                       Overall score achieved by               DCCDL Score for Development
                                  72                                      82   (Overall   Score    for    Standing
                                       DLF
                                                                               Investments being 74)– Debut
                                                                               year of participation for DCCDL

                                         ▪ Score of 100 across a) Policies, b) Risk Management,
                                                        c) Data Monitoring & review
                                                                                                                     4
Key Recognitions
              ❑ World’s first organization to achieve “WELL Health & Safety Rating”, by IWBI at Group
                level.
              ❑ Across Offices, retail & residential complexes, DLF has the largest number of
                properties across the world to achieve this certification.
              ❑ The certification demonstrates focused approach on operational policies,
                maintenance protocol, stakeholder education & engagement to address a post Covid-
                19 environment & broader health & safety issues.

              ❑ ~31 msf of portfolio is US Green Building Council LEED Platinum certified - a
                testament to our focus on sustainability
              ❑ LEED(Leadership in Energy & Environmental Design) is the most widely used green
                building rating system in the world.

              ❑ 16 Sword of Honour awards from British Safety Council; first & only organization
                globally to win this number of awards in a single year
              ❑ Our Offices & Malls have been accredited with BSC’s Covid-19 Assurance; recognition
                of our efforts in taking stringent risk control measures against the spread of Covid-19
                infection
              ❑ Upgrading air-filtration technology to state of art air filtration MERV 14 Technology

                                                                                                          5
Club Ultima, New Gurgaon
                             DLF Limited
                           Business Update

                                             6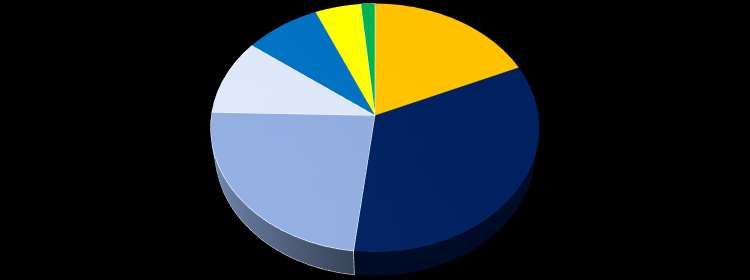
Outlook

             ❑ The economy is exhibiting signs of recovery; Consumer sentiments showing consistent
               improvement over the past few months
             ❑ Consolidation & increase in market share for large & credible developers being witnessed
  Industry   ❑ Initiatives by the Government & Central bank helping speedy revival:
                 ✓ Keeping interest rate low; Maintaining sufficient liquidity in the economy
                 ✓ Real estate sector specific measures such as stamp duty cut, levies cut and
                    development supporting policies

             ❑ Pick up in residential demand; inquiries exhibiting an uptrend; strong sales momentum
             ❑ Affordability, quality supply & improved consumer sentiments leading strong demand
                recovery
 Company     ❑ Collections in Office business continue to be resilient. Leasing activity is expected to
                increase with rise in site visits post a successful vaccination drive.
             ❑ Retail segment pacing towards normalcy with increasing footfalls and better spend per
                footfall
                                                                                                          7
Strategy
Remain committed and confident in delivering our business goals

Development Business:        Rental Business:            Liquidity:                            Land Bank:
❑ Scaling up launches of     ❑ Continued focus on                                              ❑ Core land bank to be
                                                         ❑ Strong Liquidity position:
  New Products                  growth through better                                            developed for sustainable
                                                            Maintaining sufficient liquidity
❑ Revamping                     yields and new product                                           growth
                                                            in both development and
  Premium/Mid-income         ❑ Timely delivery of on-                                          ❑ Balance land to be
                                                            rental business.
  housing                       going projects.                                                  monetized through scaling
                                                         ❑ Focused Approach: Leaner,
❑ Continued focus on                                                                             up launches/divestments
                                                            agile & a far more efficient
  monetization of finished                                  organization. Tight control on
  inventory                                                 cash flows

  GOALS : | Steady Free Cash Flow Generation | Increasing ROE | Sustainable and low risk growth |
                                                                                                                             8
Development Potential
 Strategically located land bank at low carrying cost; will enable steady & sustainable growth
                                                    Location                                                        Development Potential1 (in msf)
Gurgaon                                                                                                                          104
                                                                                               DLF 5/DLF City                                         24
                                                                                                  New Gurgaon                                         81
Delhi Metropolitan Region                                                                                                         13
Chennai                                                                                                                           12
Hyderabad                                                                                                                         3
Chandigarh Tri-City Region                                                                                                        16
Kolkata                                                                                                                           2
Maharashtra (Mumbai/Pune/Nagpur)                                                                                                  16
Bhuvaneshwar                                                                                                                      6
GandhiNagar                                                                                                                       2
Other Cities                                                                                                                      11
TOTAL                                                                                                                            187
Identified Pipeline of New Product Launches                                                                                       35
Balance potential                                                                                                                152

                         ~ 20% Land Bank monetization through scaling up launches over the medium term
Note: 1The potential is based on best estimates as per the current zoning regulations; excludes TOD/TDR potential                                      9
Development Update
New Products; key tenets to the next growth cycle
❑ Scaling Up:
    ✓ ~ 35 msf of New Products planned in medium term
    ✓ Established locations with infrastructure in place
❑ Diversified Offerings:
    ✓ Products across multiple categories catering different target segments;
        ❖ Low-rise developments including independent floors & commercial
        ❖ Plotted developments
        ❖ High rise developments
    ✓ Better value proposition by offering quality products at attractive pricing
❑ Faster Execution
    ✓ Significant volumes of Low-rise/plotted developments enabling faster execution
    ✓ Shorter Cash Conversion Cycle
❑ Cash Flow Generation
    ✓ Self-sustained financing as a result of well-structured payment plans
    ✓ Significant Free Cash flow generation

                                                                                       10
Development Update
Identified Pipeline of New Products – Launch Calendar of 35 msf
Area in msf
~ Project
Sales Potential
Project Size H2 FY21 H1 FY22 H2 FY 22 FY22-23 FY23-24 Beyond FY24
( ~ in Rs crore)
(~ in msf)
DLF - GIC
12,000 -
Residential JV, 8 - - 2.03 - - 6.0
15,000
Central Delhi
DLF – Hines/ADIA
Offices JV, 3+ 6,000 – 7,000 - - - - - 3.0
Gurgaon
Value Homes,
10 5,000 - 1.70 - 4.00 4.30 -
Gurgaon/Tricity
Commercial,
DLF 5/ New 2 2,000 0.30 0.70 0.15 0.85 - -
Gurgaon/Delhi
NOIDA IT Park 3.5 2,000 – 2,500 - - - 0.30 - 3.2
Premium / Luxury
8.5 9,000 3.00 0.70 - 0.80 4.00 -
Housing
36,000 –
TOTAL 35 msf 3.30 3.10 2.18 5.95 8.30 12.20
40,000 crore
11Identified Pipeline of New Products
Diversified Offerings across geographies & segments
2%
Geographical Diversity
( % of Total Area) 8% 5% 18%
DLF 5 /DLF City
10%
New Gurgaon
Delhi
NOIDA
Chennai
Goa
Chandigarh Tri-city
Segment Diversity 24% Product Diversity
34%
(% of Total Area) (% of Total Area)
8%
24%
48%
Commercial High Rise
Value Homes Low Rise
Premium/Luxury
38%
Plotted
29%
55%
12Highlights – Q3FY21
Pick up in New Sales continues
Net Sales Possession Operating
Booking Letters Issued Cashflow
Positive Operating
Rs 1,022 crore 462 units Cashflow :
Rs 115 crore
Pipeline Launch
Net Debt
New Products New Products
Independent Floors
35 msf Rs 5,100 crore
launched
13Sales Booking : Q3FY21
Significant growth in New Sales - Rs 1,022 crore
Y-o-Y comparison Q-o-Q comparison
₹ 1,022 cr
₹ 1,022 cr
20%
40% ₹ 853 cr
₹ 731 cr
Q3FY20 Q3FY21 Q2FY21 Q3FY21
DLF 5 & DLF City, Gurgaon: National Devco:
❖ New Sales of Rs 750 crore. ❖ New Sales of Rs 267 crore
❖ Sold 11 units of Camellias ❖ Encouraging response for DLF Samavana in
❖ Launched Independent Floors/Plots in DLF City Kasauli.
14Sales Booking : Q3FY21
New Sales booking of ~ Rs 350 crore from Independent Floors
Concept image; Not an actual image
Independent Floors
Product Details: Product Attributes:
✓ New Sales: ~ Rs 350 crore ✓ Established location -DLF City
✓ Total launch (Q3) 0.31 msf ✓ Supporting infrastructure already
✓ Area sold (Q3): 0.31 msf in place
✓ Avg. ticket size : Rs 3.6 – 4.5 cr ✓ Phased Launches
Product cycle: Payment Plans:
✓ Low-rise development
✓ Stilt + 4 structure ✓ Attractive payment plans
✓ Project cycle: 18- 24 months ✓ Self-sustained financing
15Q3FY21 Results
Strong Financial Performance during the Quarter
❑ Revenue stood at Rs 1,668 crore, reflecting a Y-o-Y growth of 9%
❑ EBITDA at Rs 624 crore, reflecting a Y-o-Y growth of 49%. EBITDA margins improved to 37% due to product mix (LY-27%)
❑ PBT at Rs 387 crore, reflecting a Y-o-Y growth of 182%.
❑ Net Profit at Rs 452 crore, reflecting a Y-o-Y increase of 9%.
❑ Positive operational cashflow of Rs 115 crore
Revenue (in Rs crore) EBITDA (in Rs crore) PAT (in Rs crore)
₹ 1,668 cr ₹ 624 cr
49% ₹ 452 cr
₹ 1,533 cr 9% ₹ 413 cr 9%
₹ 419 cr
Q3FY20 Q3FY21 Q3FY20 Q3FY21 Q3FY20 Q3FY21
16Consolidated Profit & Loss Q3 FY21
Revenue growth of 9% Y-o-Y, Net Profit up by 7% Y-o-Y
% Change % Change % Change
Particular Q3 FY21 Q2 FY21 Q3FY21 - Vs Q3 FY20 Q3FY21 - Vs 9M FY21 9M FY20 9MFY21 - Vs
Q2FY21 Q3FY20 9MFY20
I II III=(I-II) IV
Income
a) Revenue from operations 1,543 1,610 (4%) 1,342 15% 3,701 4,388 (16%)
b) Other income 125 113 11% 191 (34%) 337 626 (46%)
Total Income 1,668 1,723 (3%) 1,533 9% 4,038 5,014 (19%)
Expenses
a) Cost of Sales 731 883 (17%) 768 (5%) 1,979 2,422 (18%)
b) Overheads 111 127 (12%) 175 (36%) 335 610 (45%)
c) Other expenses 202 136 47% 171 17% 423 538 (21%)
Total Operating Expenses 1,044 1,147 (9%) 1,114 (6%) 2,738 3,570 (23%)
EBIDTA 624 576 8% 419 49% 1,301 1,444 (10%)
EBIDTA% 37 33 12% 27 37% 32 29 12%
d) Finance costs 198 226 (12%) 238 (16%) 662 1,192 (44%)
e) Depreciation 39 40 (2%) 45 (12%) 121 140 (14%)
PBT before exceptional items 387 310 25% 137 182% 518 112 362%
Exceptional items (net) 0 (96) - 231 - -96 671 -
PBT after Exceptional Items 387 214 81% 368 5% 421 783 (46%)
Tax(deferred) 104 100 4% 141 (26%) 203 225 (10%)
PAT 283 114 148% 227 25% 219 558 (61%)
Profit from Cyber/other JVs/Other
169 121 39% 186 (10%) 397 713 (44%)
Comprehensive Income
PAT after JV Profits 452 236 92% 413 9% 616 1,271 (52%)
17Finance cost
95 bps reduction achieved YTD December in line with guidance
~ 95 bps
9.8% 9.7%
9.1%
8.9%
Q4FY20 Q1FY21 Q2FY21 Q3FY21
❑ Targeting further reduction of 30-40 bps
❑ Recent funding cost 8-8.25%
❑ Annualized savings of ~ Rs 75 - 80 crore
18Cash Overheads
Reduction on track inline with guidance
Targeted reduction ~ 30- 35%
Initiatives
₹ 619 cr
₹ 328 cr
❑ Zero based budgeting exercise done for the first time
❑ Significant cut in discretionary spends; ~ 50% achieved
❑ Tight control on cash flows
❑ Transforming the Organization:
9MFY20 9MFY21 ✓ Lean and right size
✓ New Leadership with diversified backgrounds &
₹ 775 cr
subject expertise
₹ 475 cr ✓ Enhancing capabilities across functions
✓ Improving Systems & processes leading to increased
efficiency
FY20 FY21 E 19Residual EBITDA as on 31.12.2020
EBIDTA to be recognized from sales EBIDTA to be recognized from Inventory
Project
done till 31st Dec-20 as on 31st Dec-20
Camellias 2,715 2,755
DLF 5 180 20
New Gurgaon 285 70
National Devco 560 640
New Products (launched during Q3) 185 -
TOTAL 3,925 3,485
Total EBITDA to be recognized in next few years Rs 7,410 crore
20Completed Inventory
Q3FY21 Till 31st Dec-20 Receivables/Completed Inventory
Sales Sales Sales Sales Revenue Balance Value
Total Area Area
Project Booking Booking Booking Booking recognized till Receivable (in Rs
(msf) (in msf)
(in msf) (in Rs crore) (in msf) ( in Rs crore) date (in Rs crore) crore)
Camellias 3.6 0.1 283 2.2 5,840 1,678 742 1 4,120
DLF 5 - 0.0 23 - 4,043 3,840 107 0 33
New Gurgaon 18.1 0.0 6 21 9,879 8,526 798 0 138
National Devco 37.9 0.8 267 33.4 15,912 14,058 864 5 1,744
TOTAL 59.6 0.9 579 56.6 35,674 28,102 2,510 6 6,035
21Consolidated Cash Flow – Q3FY21
Particulars Q3FY21 Q2FY21
Inflow
•Collection from Sales 645 541
•Rental Inflow (DLF Limited) 48 40
Sub-Total Inflow 693 581
Outflow
•Construction (Net) 232 207
▪ Q-o-Q improvement in collections
•Government / Land Charges 31 16
•Overheads 93 125 ▪ Higher spend on Government
•Marketing / Brokerage 20 39
Sub-Total Outflow 376 387 charges to bring New Products to
Operating Cash Flow before interest & tax 317 194
•Finance Cost (net) 128 138 the market
•Tax (net) 8 -7
▪ Overheads under tight control
Operating Cash Flow after interest & tax 181 63
•Capex outflow / others 65 36
•Tax outflow-Interim Dividend 0 17
Net surplus/ (shortfall) 115 10Consolidated Balance Sheet
As on December 31, 2020 As on March 31, 2020
Particulars
( Unaudited) ( Audited)
ASSETS
Non-current assets
Property, plant and equipment 944 1,177
Right-of-use assets 304 319
Capital work-in-progress 88 89
Investment property 2,571 2,595
Goodwill 944 944
Other intangible assets 147 151
Investments in joint ventures and associates 18,393 18,023
Financial assets
Investments 164 110
Loans 372 667
Other financial assets 225 330
Deferred tax assets (net) 1,362 1,339
Non-current tax assets (net) 1,278 1,357
Other non-current assets 1,381 1,335
Total non-current assets 28,173 28,437
Current assets
Inventories 21,477 22,486
Financial assets
Investments 673 433
Trade receivables 585 720
Cash and cash equivalents 676 1,615
Other bank balances 280 805
Loans 1,138 864
Other financial assets 959 980
Other current assets 597 726
Total current assets 26,386 28,630
Assets classified as held for sale 417 163
Total assets 54,975 57,230
23Consolidated Balance Sheet
As on December 31, 2020 As on March 31, 2020
Particulars
( Unaudited) ( Audited)
EQUITY AND LIABILITIES
Equity
Equity share capital 495 495
Warrant - -
Other equity 34,368 33,952
Equity attributable to owners of Holding Company 34,863 34,447
Non-controlling interests 20 18
Total equity 34,883 34,465
Non-current liabilities
Financial liabilities
Borrowings 3,189 3,890
Trade payables
(a) total outstanding dues of micro enterprises and small enterprises - -
(b) total outstanding dues of creditors other than micro enterprises and small enterprises 795 794
Other non-current financial liabilities 595 631
Long term provisions 51 60
Deferred tax liabilities (net) 1,758 1,586
Other non-current liabilities 68 69
6,455 7,030
Current liabilities
Financial liabilities
Borrowings 2,315 2,439
Trade payables
(a) total outstanding dues of micro enterprises and small enterprises 28 29
(b) total outstanding dues of creditors other than micro enterprises and small enterprises 1,375 1,027
Other current financial liabilities 1,740 2,183
Other current liabilities 7,998 9,936
Provisions 88 87
Total liabilities 13,545 15,701
Liabilities directly associated with assets classified as held for sale 93 34
Total Equity and Liabilities 54,975 57,230 24Debt Update – Q3FY21
Net Bank Debt Sources
NCD,
Particulars Q3FY21 Q2FY21 ₹ 1,000 cr
ECB,
₹ 404 cr
Gross opening debt (Net of IndAS adj.) 6,714 7,496
Banks,
₹ 3,452 cr
HDFC/Others
, ₹ 1,563 cr
Less : Debt repaid during quarter (294) (1,152)
Repayment Schedule
< 1 Yr, ₹ 1,270
Add : New Borrowing during Qtr. 0 370
> 3 Yr, ₹
Less : Cash in Hand* (1,320) (1,499) 3,136 cr
Net Debt Position 5,100 5,215
< 3 Yr < 1 Yr,
₹ 2,013 cr
~ 54% funding from Banks; ~ 50% of scheduled repayment is greater than 3 years 25Debt Management
Committed to bring down debt in medium term
Particulars Amount (in Rs crore)
Net Debt as on 31.12.2020 (5,100)
Receivables (including New Products) 2,835
Construction Payables (including New Products) (1,100)
Other Recoveries/Refunds 750
Residual Net Debt (2,615)
Completed Inventory 6,035
❑ Completed Inventory & Project receivables sufficient to discharge all current liabilities
❑ New Products to generate healthy cash flows; Surplus Cash generation in the medium
term after meeting near term construction outflows
26Rental Portfolio Snapshot (DLF Limited) – Q3FY21
Weighted Current/M
Leasable Leased Vacant
Average Rental arket WALE GAV1
Area Area Area % Leased
Building rate Rentals
Area
(in msf) (in msf) (in msf) (in Rs psf) (in Rs psf) (months) (in Rs crore)
DLF Center, Delhi 0.2 0.1 0.0 83% 367 400 65 1,044
DLF5 0.5 0.5 0.0 100% 48 122 8 817
IT Sez, Kolkata 1.0 0.9 0.1 92% 35 30 84 916
Gateway Tower,
0.1 0.1 0.0 98% 121 122 22 205
Gurugram
Sub-Total: Offices 1.8 1.7 0.1 94% 2,982
Chanakya, Delhi 0.2 0.2 0.0 94% 165 - 95 384
Capitol Point, Delhi 0.1 0.1 0.0 100% 382 - 28 328
South Square, Delhi 0.1 0.1 0.0 93% 59 65 50 86
Sub-Total: Retail 0.3 0.3 0.0 95% 799
Total: Operational
2.1 2.0 0.1 94% 3,781
Portfolio
27
GAV:As per C&W valuation Report basis data as on March 31,2020 ; Retail Weighted average rental rate is based on rental scheme offered to tenantsOne Horizon Center, DLF 5, Gurgaon
DCCDL
Business Update
28Acquisition - One Horizon Centre(OHC)
DCCDL entered into definitive agreements to increase its ownership of OHC to 100%, Marquee Tenants:
for a purchase consideration of ~ INR 780 Crore(subject to closing adjustments).
Transaction Closing expected in February 2021
❑ Gross Leasable Area: 0.8 msf; includes 65k sq. ft. of retail plaza
❑ Occupancy: ~ 95%
❑ Annualized Rental Income: ~ Rs 150 crore
❑ LEED Platinum certified building at marquee location – DLF 5
29REIT Update
❑ Favorable market indicators for REIT listing
✓ Enough liquidity in capital markets
✓ Low interest rate regime
✓ Efficient listing framework by the regulator
✓ Successful listing of 2 REITs
❑ Consultants have been appointed:
✓ Legal Advisor: Shardul Amarchand Mangaldas & Co
✓ Banker: Morgan Stanley
✓ Financial/Tax Advisor: KPMG
❑ Deliberations being done on key points:
✓ Corporate structure
✓ Capital structure
✓ Asset perimeters
❑ Completion expected in ~ 12 months
30Outlook & Key Updates
Office business steady; Retail picking up; Long term outlook remains positive
• Collections continue to be robust, c. at ~ 98% levels
• Gross leasing of 1.7 msf achieved; Vacancy contained within 10%
Offices • Our office buildings are expected to have vastly better indoor air quality as a result of an
initiative to complement and upgrade our air filtration systems; significant completion by Q1,
FY22
• A successful vaccination drive is expected to draw tenants back to offices by Q1 of 2021
• Collections for retail portfolio have been robust at 99% for Q3
• Footfall levels (Q3 exit) at ~60% vs same period last year, with sales at ~70%, buoyed by
Retail focused shopping resulting in higher spend per footfall
• Luxury segment witnessing an encouraging spend/footfall pattern, vs same period last year
• All malls operate with added protocols to ensure heightened patron safety
• We have been able to maintain our focus not only on the core commercial aspects of our
Key
business, but have also outperformed ourselves in terms of safety and sustainability
Updates
recognitions
31Portfolio Snapshot – Q3FY21
Weighted Average Current/Market
Leasable Area Leased Area Vacant Area % Leased WALE GAV1
Building Rental rate Rentals
Area
(in msf) (in msf) (in msf) (in Rs psf) (in Rs psf) (months) (in Rs crore)
Cyber City 10.2 9.2 1.0 90% 111 121 63 15,817
Cyber Sez 2.9 2.7 0.2 95% 84 102 60 4,060
Cyber Park 2.6 2.3 0.2 91% 119 125 113 4,120
Silokhera Sez 1.9 1.1 0.8 56% 68 65 69 1,803
Chennai Sez 7.0 6.8 0.2 96% 68 76 66 6,782
Hyderabad Sez 2.9 2.7 0.2 94% 53 58 58 2,244
Kolkata IT Park 1.3 1.1 0.2 87% 38 35 77 694
Chandigarh IT Park 0.6 0.5 0.1 84% 57 53 78 506
Sub-Total: Office 29.5 26.5 2.9 90% 36,026
Mall of India, NOIDA 2.0 2.0 0.0 99% 105 117 87 2,953
Emporio 0.3 0.3 0.0 90% 346 384 34 1,346
Promenade 0.5 0.5 0.0 98% 189 210 59 1,186
Cyber Hub 0.5 0.4 0.0 94% 122 136 57 912
DLF Avenue 0.5 0.4 0.1 84% 157 174 98 1,053
City Centre 0.2 0.1 0.1 73% 28 31 101 100
Sub-Total: Retail 3.9 3.7 0.2 95% 7,550
Total: Operational Portfolio 33.3 30.2 3.1 91% 43,576
Under Construction
Downtown Gurugram 1.5 0.5 1.0 31% 129 125 - -
Downtown Chennai 2.1 0.8 1.3 37% 84 84 - -
Chennai Block 12 0.3 0.2 0.1 67% 76 66 - 179
Total -Under Construction 3.9 1.5 2.5 37% 179
Grand Total 37.3 31.7 5.6
1 GAV:As per C&W valuation Report basis data as on June 30, 2020;
Total GAV of development potential of Cyber City land, Downtown-Gurgaon & Downtown, Chennai is ~ Rs 10,665 crore 32
Retail Weighted average rental rate are ~ 90% of pre Covid FY21 Budgeted rental levelResult Highlights – Q3FY21
Offices business resilient; Retail gaining momentum
Rental Revenue Operating Cashflow Net Debt
Rs 817 crore Rs 411 crore Rs 18,090 crore
Operational
Rating Gross Leasing
Portfolio
ICRA AA(-)
33.3 msf 1.7 msf
(Stable)
33Historical Performance : Office
Particulars 9MFY21 FY20 FY19 FY18
Area(msf)
- Completed 29.5 26.4 26.4 25.5
- Under
3.9 6.6 3.3 4.2
Construction
Total area 33.3 33.1 29.7 29.7
Occupancy %
- Completed 90% 95% 94% 94%
New Leases (msf) 1.2 1.5 2.1 1.5
Re Leasing (msf)* 1.1 1.3 1.9 3.1
Re Leasing MTM (%) 44% 38% 35% 18%
Note: 1. Cyber Park & Chennai- Block 11 considered as Completed in 9MFY21
*2.Re-leasing of Term Completion renewals only.
3. Includes latest pre-leasing at Downtown Chennai 34Re-leasing Potential
Cyber City, Gurugram Cyber City, Chennai
Total Annualized incremental Total Annualized incremental
revenue1 ~ INR 64 crore revenue ~ INR 40 crore
Rates in INR psf/month Rates in INR psf/month
134 85
121 128 76 80
92 90 95
56 58 60
FY 21 FY 22 FY 23 FY 21 FY 22 FY 23
Wt. Avg-Termination Lease Projected Rate-Releasing Wt. Avg-Termination Lease Projected Rate-Releasing
1Annualisedincremental revenue impact has been calculated on rent rate differential multiplied by gross leasing area coming up for renewal
Re-leasing Potential assumes reaching pre-Covid levels in next few quarters 35Mark-to-Market Potential
Cyber City, Gurugram Cyber Sez, Gurugram Cyber City, Chennai
10% 22%
12%
102
121 84 76
111 68
Weighted Avg. Rental Market Rental Weighted Avg. Rental Market Rental Weighted Avg. Rental Market Rental
Note:
Weighted Average Rentals is the weighted base rental for leased area
Market rent means weighted average rate for new leases entered till Dec ’20 36Office Portfolio - Tenant Mix
Tenant % of Revenue
Cognizant 5%
IBM 3%
KPMG 3% ▪ Well diversified & balanced portfolio
Concentrix 2% ▪ Tenants Profile: Predominantly IT/ITES
American Express 2% companies, financial/engineering
BA Continuum 2%
services, etc.
TCS 2%
▪ Lower concentration risk as Top 10
BT Global 2%
tenants contributing only 24% of Gross
EY 2%
revenues
Delloitte 1%
Total 24%
37Development Update
~ Project
Project Current Status Latest Update
Size
▪ Block 2 & 3 under
Downtown, ▪ Phase-I (~1.5 msf) under
11 msf construction
Gurugram development
▪ Pre-leasing: ~0.5 msf
Downtown, ▪ Phase I (~ 2 msf) under
6.8 msf ▪ Pre-leasing: 0.77 msf
Chennai development
Block-12,
Cyber City, 0.3 msf ▪ Construction underway ▪ Pre-leasing 0.2 msf
Chennai
~ 4 msf under construction
TOTAL 18.1 msf
currently
38Q3FY21Results
Strong Financial performance in the Quarters
❑ Revenue at Rs 1,122 crore, remained flat as compared to last year.
✓ Offices rental growth of 19% Y-o-Y driven by Cyber Park, Chennai Block 11 and renewals/escalations
✓ Retail revenues improving month-on-month, Y-o-Y drop of 38% due to pandemic in current fiscal
✓ Services & Other Operating Income down by 24% due to lower CAM costs.
❑ EBITDA at Rs 894 crore; 7% growth Y-o-Y
❑ PAT at Rs 249 crore, as compared to Rs 278 crore in Q3FY20; primarily due to unamortized cost written off-Rs
50 crore, increase in Tax expense due to expiry of 80IA tax benefits & tax provision reversal in Q3FY20.
❑ Operating Cashflow of Rs 411 crore generated during the quarter
Revenue (in Rs crore) EBITDA (in Rs crore) PAT (in Rs crore)
₹ 1,131 cr 1% ₹ 1,122 cr 7% ₹ 894 cr ₹ 278 cr
₹ 836 cr 10% ₹ 249 cr
Q3FY20 Q3FY21 Q3FY20 Q3FY21 Q3FY20 Q3FY21 39DCCDL Consolidated Financial Summary - Q3FY21
% change % change
Particulars Q3FY21 Q2FY21 Q3FY20
Q-o-Q Y-o-Y
Rental Income 817 718 14% 759 8%
Office 722 667 8% 604 19%
Retail 95 51 87% 155 (38%)
Service & Other Operating Income 242 252 (4%) 319 (24%)
Other Income 63 70 (10%) 53 20%
Total Revenue 1,122 1,040 8% 1,131 (1%)
Operating Expenses 228 237 (4%) 294 (22%)
EBITDA 894 803 11% 836 7%
Finance cost1 463 462 0% 426 9%
Depreciation 139 136 2% 130 7%
PBT 292 205 43% 280 4%
Tax2 50 41 22% 9 -
Share of profit/loss in JV 6 6 - 6 -
Other Comprehensive Income -1 0 - - -
Total Comprehensive Income 249 171 46% 278 (10%)
1Unamortised finance cost written off on account of replacement of existing loans with new loans at lower interest rates. Q3FY21 –Rs 50 crore, Q2FY21 – Rs 27 crore
2DCCDL(Standalone) 80IA tax benefits expired from March 31,2020 & tax provision reversal in Q3FY20. Overall Tax Rate-17.5%(LY 9.6%-Annualized) 40DCCDL Consolidated Cash Flow Abstract
Particulars Q3FY21 Q2FY21 Q1FY21
Operating Cash flow before Interest & tax 848 707 646
Interest Expense (435) (407) (401)
Interest Income 47 58 18
Tax (net)* (49) (24) (65)
Operating Cash flow after Interest & tax 411 334 198
Capex (267) (221) (81)
Net Surplus/Deficit 144 113 117
Note: * includes income tax refund received in Q3FY21 & Q2FY21 41DCCDL Consolidated Balance Sheet Abstract
Particulars As on 31.12.2020 As on 31.03.2020
Non-Current Assets 27,412 27,042
Current Assets 2,083 1,783
Total Assets 29,495 28,825
Equity 5,597 5,311
Non-current Liabilities 18,573 20,478
Current Liabilities 5,325 3,036
Total Liabilities 29,495 28,825
42DCCDL Consolidated - Debt Update
Sources
Particulars Q3FY21 Q2FY21
Banks, HDFC/Others,
Gross opening debt (Net of IndAS adj.) 19,488 19,361 ₹ 12,054 cr ₹ 6,934 cr
Less : Debt repaid during quarter (2,153) (172) NCD, ₹ 746 cr
Repayment Schedule
Add : New Borrowing during Qtr. 2,400 300
< 1 Yr, ₹
882 cr
Less : Cash in Hand* (1,645) (1,222) > 3 Yr, ₹
16,482 cr < 3 Yr < 1 Yr, ₹
2,371 cr
Net Debt Position 18,090 18,266
~ 60% funding from Banks; ~ 84% of scheduled repayment is greater than 3 years 43DCCDL Consolidated – Interest rates
YTD Reduction of 115 bps inline with guidance
~ 115 bps
8.90%
8.64% 8.46%
7.75%
Q4FY20 Q1FY21 Q2FY21 Q3FY21
▪ Targeting to achieve 7.5% (exit FY21). Annualized savings of ~ Rs 270 - 280 crore
▪ Latest funding happening at 7% - 7.30%
▪ Debt levels to hold in the short term; expected significant reduction post REIT listing
44Disclaimer
This presentation contains certain forward-looking statement concerning DLF’s future business prospects
and business profitability, which are subject to a number of risks and uncertainties & the actual results could
materially differ from those in such forward-looking statements. The risks and uncertainties relating to such
statements include, but are not limited to, earnings fluctuations, our ability to manage growth, competition,
economic growth in India, ability to attract & retain highly skilled professionals, time & cost overruns on
contracts, government policies and actions related to investments, regulation & policies etc., interest & other
fiscal policies generally prevailing in the economy. The Company does not undertake to make any
announcements in case any of these forward-looking statements become incorrect in future or update any
forward-looking statements made from time to time on behalf of the Company.
Area represented in msf within the presentation above should be read with a conversion factor of ~ 1 msf =
92,903 sq. meters.
45Club Ultima, New Gurgaon
THANK YOU
46You can also read