CAPITALAND CHINA TRUST - UOB Kay Hian S-REITs Virtual Corporate Day 2021 11 August 2021
←
→
Page content transcription
If your browser does not render page correctly, please read the page content below
CAPITALAND CHINA TRUST
UOB Kay Hian S-REITs Virtual Corporate Day 2021
11 August 2021              31 July 2019
Disclaimer
This presentation may contain forward-looking statements. Actual future performance, outcomes and results may differ materially from those
expressed in forward-looking statements as a result of a number of risks, uncertainties and assumptions. Representative examples of these factors
include (without limitation) general industry and economic conditions, interest rate trends, cost of capital and capital av ailability, av ailability of real
estate properties, competition from other developments or companies, shifts in customer demands, shifts in expected lev els of occupancy rate,
property rental income, charge out collections, changes in operating expenses (including employee w ages, benefits and training, property
operating expenses), governmental and public policy changes and the continued av ailability of financing in the amounts and the terms necessary
to support future business.

You are cautioned not to place undue reliance on these forw ard-looking statements, w hich are based on the current v iew of management
regarding future ev ents. No representation or w arranty express or implied is made as to, and no reliance should be placed on, the fairness,
accuracy, completeness or correctness of the information or opinions contained in this presentation. Neither CapitaLand China Trust Management
Limited (“Manager”) nor any of its affiliates, adv isers or representativ es shall hav e any liability whatsoever (in negligence or otherwise) for any loss
howsoever arising, w hether directly or indirectly, from any use of, reliance on or distribution of this presentation or its contents or otherwise arising in
connection with this presentation.

The past performance of CapitaLand China Trust (“CLCT”) is not indicativ e of future performance. The listing of the units in the CLCT (“Units”) on the
Singapore Exchange Securities Trading Limited (SGX-ST) does not guarantee a liquid market for the Units. The v alue of the Units and the income
derived from them may fall as well as rise. Units are not obligations of, deposits in, or guaranteed by, the Manager or any of its affiliates. An
inv estment in the Units is subject to inv estment risks, including the possible loss of the principal amount inv ested. I nvestors have no right to request
that the Manager redeem or purchase their Units w hile the Units are listed on the SGX-ST. I t is intended that holders of Units may only deal in their
Units through trading on the SGX-ST.

This presentation is for information only and does not constitute an inv itation or offer to acquire, purchase or subscribe for the Units.

                                                                                                                                                           1
                                                       UOB Kay Hian S-REITs Virtual Corporate Day 2021 * 11 August 2021*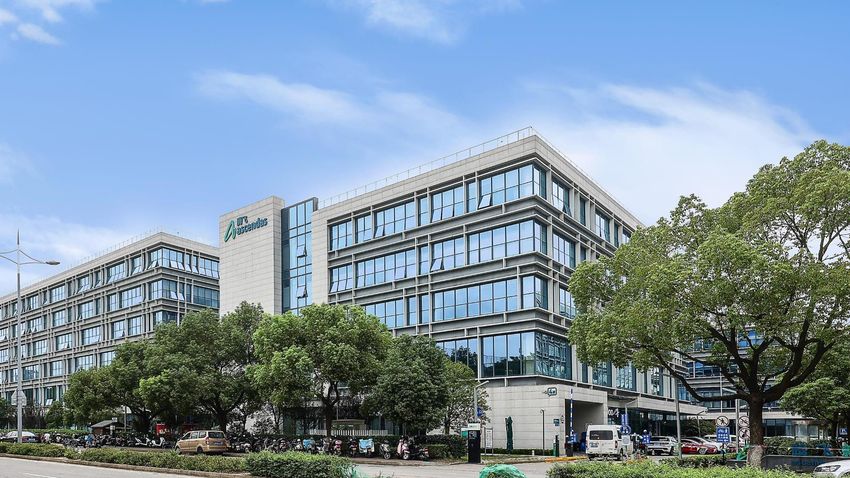
Contents
 1   Overview of CLCT

 2   1H 2021 Key Highlights

 3   Capital Management

 4   Looking Ahead

                                                                                              2
                          UOB Kay Hian S-REITs Virtual Corporate Day 2021 * 11 August 2021*
Largest Multi-Asset China Focused S-REIT
Diversified Portfolio with 11 Well-Located Malls and 5 Business Parks Across Prominent Growth Cities
Listed ➢ AUM of S$0.8 billion ➢ 7 retail assets
A. Beijing
in 2006 ➢ GFA of 453,506 sq m ➢ Across 5 cities
CapitaMall Xizhimen CapitaMall Wangjing CapitaMall Grand Canyon CapitaMall Shuangjing
C. Guangzhou
B. Shanghai
D. Harbin
D
G
A
CapitaMall Qibao Rock Square CapitaMall Xuefu CapitaMall Aidemengdun
I
H
E. Changsha
F. Chengdu
G. Hohhot
F
Today J
B
E
✓ AUM of S$4.4 billion1 C
CapitaMall Yuhuating CapitaMall Xinnan CapitaMall Nuohemule
✓ GFA of 1.7 mil sq m
J. Hangzhou
✓ 11 retail assets and 5 business parks
H. Suzhou
I. Xi’an
✓ Geographically diversified across 10 cities
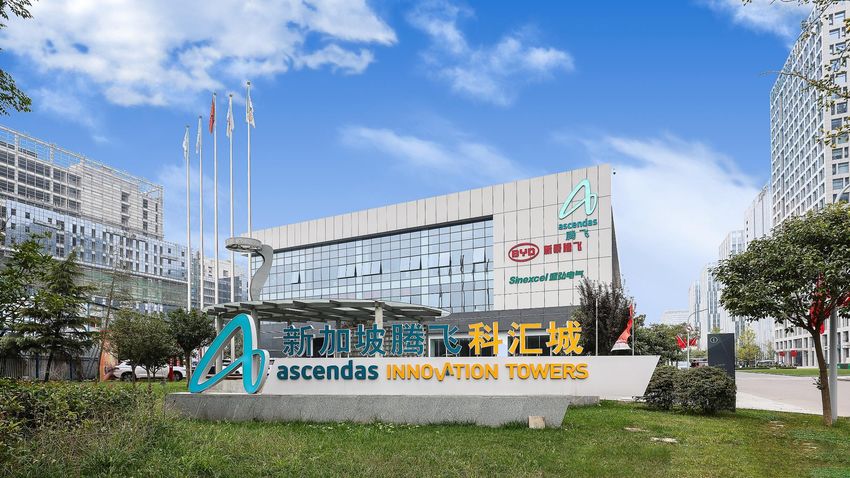
Ascendas Xinsu Portfolio Ascendas Innovation Hub Ascendas Innovation Towers SHSTP Phase I SHSTP Phase II
Notes:
1. As at 31 December 2020, assuming completion of business parks on an effective basis. Ex cludes CapitaM all M inzhongleyuan and CapitaMall Saihan as the malls have been divested in 1Q and 2Q 2021 respectively.
3
UOB Kay Hian S-REITs Virtual Corporate Day 2021 * 11 August 2021*
Most Established, Expansive and Diversified
 Platform
                                                                            CLCT – The Proxy for China Growth

   Diversified                                Established                                 Strong                                Active Acquisition                                Leverage on
Portfolio of Retail                         Presence in 10                            Management                              Growth Track Record -                            Sponsor’s expertise
and Business Park                           Prominent Top                           Team with 15Y of                          from Sponsor and 3rd                                and domain
      Assets                                   Tier Cities                            Track Record                                    Party                                    knowledge in China

    Asset under Management1                                                         Market Capitalisation2                                                                  DPU Yield2
              S$4.4 billion                                                              S$2.1 billion                                                                         6.2%

  Notes:
  1. As at 31 December 2020, assuming completion of business parks on an effective basis. Ex cludes CapitaM all M inzhongleyuan and CapitaMall Saihan as the malls have been divested in 1Q and 2Q 2021 respectively.
  2. Based on 1H 2021 Annualised DPU of 8.53 SGD cents and unit price of S$1.37 as at 1 July 2021.

                                                                                                                                                                                                                    4
                                                                           UOB Kay Hian S-REITs Virtual Corporate Day 2021 * 11 August 2021*
1H 2021 Key
Highlights

              Rock Square
Achieved Highest NPI growth since Listing
                      Gross Revenue                                                                                                                   Improvements due to:
 861.0
                                                                                       4.23
                      (RMB million)
                                                                                                                                                                           Retail
                      68.5% YoY
                                                                                                                                               •    100% ownership of Rock Square
                                     861.0                         Distribution Per Unit (S cents)                                             •    New and Higher contribution from
        511.0                                                                                                                                       CapitaMall Nuohemule
                                                                                         40.1% YoY                                             •    Improved Retail segment
                                                                                                                                                      ✓ Consecutive quarterly
        1H 2020                     1H 2021
                                                                                                                                                        improvement in occupancy
                                                                                                                 4.23                                 ✓ +40.8% and +40.7% yoy
                                                                                                                                                        improvement in sales and traffic 1
                     Net Property Income
585.7                (RMB million)
                                                                                                                                                      ✓ Lower rental relief and lease
                                                                                                                                                        restructuring relative to 1H 2020
                     78.3% YoY
                                                                             3.02                                                                                   Business Park
                                     585.7
       328.6                                                                                                                                   • Maiden contribution of Business Parks2
                                                                                                                                               • Continued strong performance of
                                                                                                                                                 Business Parks with 100% return to
       1H 2020                      1H 2021                                                                                                      office community
                                                                             1H 2020                            1H 2021
Notes:
1. Tenants’ Sales and Shopper Traffic are based on CLCT’s respective holding perio d of its multi-tenanted assets (namely CapitaMall Xizhimen, CapitaMall Wangjing, CapitaMall Grand Canyon, CapitaMall Xinnan,
    CapitaM all Qibao, CapitaMall Saihan, CapitaM all Nuohemule, Rock Square (100% basis), CapitaMall Xuefu, CapitaM all Aidemengdun and CapitaM all Yuhuating).
2. BP Portfolio includes Ascendas Xinsu Portfolio, Ascendas Innovation Towers, Ascendas Innovation Hub, and Singapore-Hangzhou Science & Technology Park Phase I and Phase II w hich CLCT completed acquisition on 4
    January 2021, 10 February 2021, 26 February 2021 and 18 June 2021 respectively.
                                                                                                                                                                                                               6
                                                                          UOB Kay Hian S-REITs Virtual Corporate Day 2021 * 11 August 2021*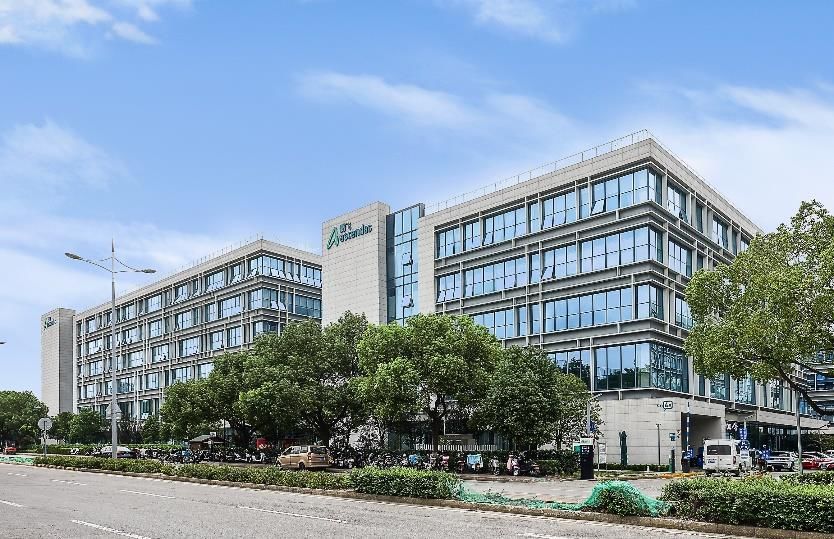
Highest NPI and DI Recorded, Up 84.4%
and 72.9% yoy
                                                                                                                1H 2021 Actual 1,2                    1H 2020 Actual                    Change (%)

Gross Revenue (S$’000)                                                                                                    176,892                            101,517                           74.2

NPI (S$’000)                                                                                                              120,342                             65,278                           84.4

Income Available for Distribution to Unitholders (S$’000)                                                                  64,071                             35,298                           81.5

Distributable amount to Unitholders (S$’000) 3                                                                             64,071                             37,048                           72.9

DPU (S cents)                                                                                                                4.23                                3.02                          40.1

Notes:
1. Ex cludes contributions from CapitaMall Saihan, CapitaM all Minzhongleyuan and CapitaMall Erqi w hich w ere divested on 7 June 2021, 10 February 2021, and 1 June 2020 respectively.
2. Includes contributions from Rock Square, Ascendas Xinsu Portfolio, Ascendas Innovation Towers and Ascendas Innovation Hub from 30 December 2020, 4 January 2021, 10 February 2021, and 26 February 2021
    respectively. While the acquisitions of the Singapore-Hangzhou Science & Technology Park Phase I and Phase II w ere completed on 18 June 2021, the risk and rew ard have been transferred from 15 February 2021.
3. For 1H 2020, CLCT released $3.5 million retained in FY 2019 from the compensation received by CapitaMall Erqi, follow ing the ex it of its anchor tenant. At the same time, $1.8 million was retained from the income
    available for distribution to Unitholders for general corporate and w orking capital purposes.

                                                                                                                                                                                                                           7
                                                                            UOB Kay Hian S-REITs Virtual Corporate Day 2021 * 11 August 2021*
Strengthening Portfolio Performance1 and
Operations
              Retail                                                                       Portfolio Updates                                                                           Business Park

                                                        1Q 2021
                                                          •     Completed the acquisitions of
                                                                 o 51% interest in Ascendas Xinsu Portfolio
                                                                 o 100% interest in Ascendas Innovation Towers
        Improved                                                 o 80% interest in Ascendas Innovation Hub                                                                                Higher
       Occupancy                                                                                                                                                                        Occupancy
                                                          •     Completed the divestment of CapitaMall Minzhongleyuan
          95.4%                                           2Q 2021                                                                                                                         94.0%
                                                          •     Completed the acquisitions of 80% stake in Singapore-
                                                                Hangzhou Science & Technology Park Phase I and II in June
                                                                2021; secured revenue contribution from 15 February 2021
                                                          •     Completed the divestment of CapitaMall Saihan
     Tenant Sales                                         •     High rental collection of ~96% for 1H 2021                                                                                 Rental
    YoY (1H 2021)                                                                                                                                                                         Reversion
                                               3Q 2021: Secured insurance claim on the closure of CapitaMall Grand
        +40.8%                            Canyon for 19 days in mid 2020; Claim amounted to ~0.6 of monthly revenue2                                                                     +6.7%
Notes:
1. Includes contributions from Rock Square, Ascendas Xinsu Portfolio, Ascendas Innovation Towers and Ascendas Innovation Hub from 30 December 2020, 4 January 2021, 10 February 2021, and 26 February 2021 respectively.
    While the acquisitions of the Singapore-Hangzhou Science & Technology Park Phase I and Phase II w ere completed on 18 June 2021, the risk and rew ard have been transferred from 15 February 2021.
2. Based on average monthly revenue in FY 2020. CapitaMall Grand Canyon w as closed from 22 June 2020 - 10 July 2020.
                                                                                                                                                                                                                   8
                                                                           UOB Kay Hian S-REITs Virtual Corporate Day 2021 * 11 August 2021*
Diversified Portfolio to Capture China’s
Economic Growth
                            Geographical Diversification                                                              Asset Class Diversification

54.8%                                             Beijing, Shanghai                               80.9%
                                                        43.9%
Tier 1 Cities                                                                                     Retail
                                     Guangzhou

42.1%                                  11.0%
                                                  By                                               19.1%
                                                                                                                                        By
Tier 2 Cities                                     NPI1                                            Business Park                         NPI1
                                      Changsha,
                                      Chengdu,
                                       Harbin
3.1%                                    23.0%       Suzhou, Hangzhou,
                                                          Xi’an
Other Provincial Cities                                   19.1%

Note:
1. For 1H 2021 by effective stake.

                                                                                                                                                    9
                                                         UOB Kay Hian S-REITs Virtual Corporate Day 2021 * 11 August 2021*
Diversified Portfolio with Expanded Tenant
Base Across Multiple Key Growth Sectors
Retail Business Park
Others High
Strong Supermarket Others
Focus on 57.5% Exposure to
38.2%
Electronics
7.2% Emerging 18.4%
Essential
High-Growth
Sectors that
Sectors From
Cater to
Reputable
Lifestyle
F&B MNCs and
Needs Retail BP
31.3% Domestic Engineering
GRI1 Companies GRI1 13.6%
42.5% 61.8% E-Commerce
Essential Serv ices High Growth 6.3%
Biomedical
Sectors 4.0% Emerging
Sciences I CT
Sectors 2 Financial
6.9% Serv ices 11.7%
Notes:
4.9%
1. As at 30 June 2021.
2. High Grow th Emerging Sectors are defined as Electronics, Engineering, E-commerce, ICT, Financial Services and Biomedical Sciences.
10
UOB Kay Hian S-REITs Virtual Corporate Day 2021 * 11 August 2021*Portfolio Lease Expiry Profile
Well-Staggered Lease Expiry Profile 1
WALE (years) Retail Business Park Portfolio
By Gross Rental Income 2.4 2.0 2.3
% of total Gross Rental Income2,3
By Net Lettable Area 4.1 2.0 2.9
17.8%
14.9%
13.3% 12.8%
10.1%
8.2%
6.5%
4.3% 4.6% 4.7%
2.0%
0.8%
2021 2022 2023 2024 2025 2025 and Beyond
Retail Business Park / Industrial
Notes:
1. Based on contractual committed leases for 30 June 2021. Ex cludes CapitaMall Saihan as the mall w as divested in June 2021.
2. Ex cludes gross turnover rent.
3. As a percentage of each respective mall’s contractual monthly gross rental income for 30 June 2021.
11
UOB Kay Hian S-REITs Virtual Corporate Day 2021 * 11 August 2021*Retail Portfolio
CapitaMall Xinnan, ChengduRetail Portfolio Overview
Harbin, Total Valuation RMB18.2 billion1
12.3%
No. of Assets 11
7 cities across
Hohhot, 5.5% Located in 5 core city clusters
Beijing,
49.9%
Chengdu, Shanghai,
8.8% 0.5%
Changsha, Guangzhou,
4.2% 18.8%
Note:
1. Based on valuation as at 31 December 2020.
13
UOB Kay Hian S-REITs Virtual Corporate Day 2021 * 11 August 2021*Higher 1H 2021 Portfolio Shopper Traffic and
Tenant Sales1,2,3
Shopper Traffic (million) Tenant Sales (RMB million)
• Beijing malls recovered in 2Q 2021 with the swift
60 +40.7% 3,000 +40.8%
containment of COVID-19 resurgence that
YoY YoY
occurred in Jan 2021
40 2,000
• Top 5 Retail trade categories4 contribute 72.6%
to retail GRI as at 30 June 2021
20 1,000 • Sales of top 5 trade categories increased 55.8%
yoy for 1H 2021 2Q
0 0 • Higher tenant sales in 1H 2021 was led by strong
1H 2020 1H 2021 1H 2020 1H 2021 improvement in trade categories such as:
% increase
Beijing Malls Non-Beijing Malls Beijing Malls Non-Beijing Malls Trade Category
1H 2021 vs 1H 2020
+39.1% YoY +41.6% YoY +56.9% YoY +33.0% YoY Food & Bev erages 75%
Fashion & Accessories
Notes: Beauty & Health
1Q 30%43%
1. Tenants’ Sales and Shopper Traffic are based on CLCT’s respective holding period of its multi-tenanted assets (namely CapitaMall Xizhimen,
CapitaM all Wangjing, CapitaMall Grand Canyon, CapitaM all Xinnan, CapitaM all Qibao, CapitaM all Saihan, CapitaM all Nuohemule, Rock Serv ices 51%
Square (100% basis), CapitaM all Xuefu, CapitaM all Aidemengdun and CapitaMall Yuhuating).
2. On same portfolio basis (ex cluding CapitaMall Saihan in 2020 and CapitaMall Nuohemule in 2021):
Jewellery / Watches 81%
a.1H 2021 Shopper Traffic recovery: +43.5%
b.1H 2021 Tenant Sales recovery: +39.5%
3. Rock Square w as closed from 29 M ay 2021 to 15 June 2021. All stores have since reopened.
4. The top five retail trade categories include Food & Beverage, Fashion & Accessories, Supermarket, Beauty & Health, and Leisur e & Entertainment
14
UOB Kay Hian S-REITs Virtual Corporate Day 2021 * 11 August 2021*Consecutive Growth in Retail Occupancy
Investment Property 30-Jun-20 30-Sep-20 31-Dec-20 31-Mar-21 30-Jun-21
CapitaMall Xizhimen 92.6% 95.2% 96.1% 97.4% 98.9%
Rock Square 93.8% 91.9% 93.1% 94.9% 96.4%
CapitaMall Wangjing 93.4% 93.3% 93.3% 93.3% 93.7%
CapitaMall Grand Canyon 90.1% 91.4% 90.4% 91.9% 93.5%
CapitaMall Xuefu 97.3% 97.4% 97.9% 98.2% 98.9%
CapitaMall Xinnan 93.1% 94.0% 94.7% 94.5% 96.7%
CapitaMall Nuohemule - - 100.0%1 100.0%1 100.0%1
CapitaMall Yuhuating 96.5% 96.7% 97.9% 97.4% 97.3%
CapitaMall Aidemengdun 90.0% 89.0% 92.2% 87.9% 92.2%
CapitaMall Qibao 82.3% 83.8% 80.6% 81.7% 82.6%
CapitaMall Shuangjing 98.5% 98.5% 98.5% 98.5% 98.5%
CapitaMall Saihan2 99.0% 99.2% - - -
93.4% 93.7% 94.1% 94.4% 95.4%
Occupancy of
Retail Portfolio3
30-Jun-20 30-Sep-20 31-Dec-20 31-Mar-21 30-Jun-21
Notes:
1. Ex clude non-retail storeroom units.
2. Divestment of CapitaMall Saihan w as completed in June 2021.
3. Based on all committed leases as of 30 June 2021. 15
UOB Kay Hian S-REITs Virtual Corporate Day 2021 * 11 August 2021*Retail Portfolio Lease Expiry Profile
Lease Expiry Profile for 20211
% of total % of total
Investment Property No. of Leases
Gross Rental Income2,3 Net Lettable Area4
CapitaMall Xizhimen 78 23.3% 13.8%
Rock Square 49 14.8% 8.7%
CapitaMall Wangjing 68 22.3% 9.4%
CapitaMall Grand Canyon 28 10.0% 5.8%
CapitaMall Xuefu 139 26.1% 18.6%
CapitaMall Xinnan 58 16.7% 10.9%
CapitaMall Nuohemule 89 16.4% 9.6%
CapitaMall Yuhuating 118 35.6% 21.3%
CapitaMall Aidemengdun 80 35.8% 28.7%
CapitaMall Qibao 26 14.6% 14.0%
Notes:
1. Based on contractual committed leases 30 June 2021.
2. Ex cludes gross turnover rent.
3. As a percentage of each respective mall’s contractual monthly gross rental income for 30 June 2021.
4. As a percentage of each respective mall’s committed net lettable area for 30 June 2021.
16
UOB Kay Hian S-REITs Virtual Corporate Day 2021 * 11 August 2021*Retail Portfolio Lease Expiry Profile
Lease Expiry Profile By Year1
No. of % of total Gross % of total
Year
Leases Rental Income2,3 Net Lettable Area4
Weighted Average Lease
2021 733 20.2% 12.3% Expiry (years)
2022 670 24.2% 14.1%
2.4
2023 329 18.1% 11.2% By Gross Rental Income 2
2024 279 17.3% 22.9%
2025 86 6.3% 7.6%
4.1
By Net Lettable Area
Beyond 2025 120 13.9% 31.9%
Notes:
1. Based on contractual committed leases for 30 June 2020.
2. Ex cludes gross turnover rent.
3. As a percentage of monthly contractual gross rental income for 30 June 2021.
4. As a percentage of monthly committed net lettable area for 30 June 2021.
17
UOB Kay Hian S-REITs Virtual Corporate Day 2021 * 11 August 2021*Retail Portfolio Leasing Updates1
Active Leasing Management
Retail Work Done as of 1H 2021 New Leases by Trade Categories Highlights
Sporting Good
New
Leases
& Apparel ✓ Opportunities to
40.5% 8.6% Beauty &
secure better
Healthcare 5.8%
reversions as
I nformation & consumer
Fashion Technology
4.8% sentiments continue
29.9%
to improve and
By NLA By NLA more mini-anchor
Others
spaces are coming
Renewal 14.1%
Leases up for renewal in 2H
Food &
59.5% Bev erage 2021
36.9% ✓ Secured positive
reversion of 1.8%
for tenant renewals
59.7% of FY 2021 expiring NLA has in 1H 2021
New tenants are mainly from F&B sectors
been completed as of 1H 2021
Note:
1. Based on contractual committed leases for 30 June 2021.
18
UOB Kay Hian S-REITs Virtual Corporate Day 2021 * 11 August 2021*Retail Rental Reversion in 1H 20211
From 1 Jan to 30 Jun 2021
No. of new Area % of Total Net Var. over last
Investment Property
leases/renewals (sq m) Lettable Area rental rate2,3
CapitaMall Xizhimen 60 6,024 11.9% (3.0)%
Rock Square 43 6,746 12.7% 16.1%
CapitaMall Wangjing 39 2,805 5.4% (9.3)%
CapitaMall Grand Canyon 22 2,200 4.9% (11.9)%
CapitaMall Xuefu 137 11,079 17.3% (2.5)%
CapitaMall Xinnan 47 3,775 10.2% (11.8)%
CapitaMall Yuhuating 33 2,152 4.4% 6.4%
CapitaMall Aidemengdun 34 2,596 9.2% (5.5)%
CapitaMall Qibao 25 1,486 2.9% (2.8)%
Total Portfolio 440 38,863 9.1% (2.1)%
Notes:
1. Ex cludes master-leased mall.
2. Ex cludes gross turnover component, newly created units leased, short term renewals (< 1 year) and units vacant for >=1 year.
3. Includes re-configured units.
19
UOB Kay Hian S-REITs Virtual Corporate Day 2021 * 11 August 2021*Attracting Shoppers with the Latest Trends
Optimising Tenant Mix to Cater to Evolving Retail Habits
Improve quality of social dining Boost offerings by Organise exciting night activities to
with enhanced variety of F&B expanding domestic brands bring in the crowd all day long
Tim Hortons, Li Ning
a popular Canadian at CapitaMall
multinational fast Xinnan
food restaurant chain
at Rock Square
Big Pizza DJI
offering a pizza At Rock
buffet at Square
CapitaMall
Grand Canyon
Collaborated with
Roast Buffet “Budweiser” to organise the
at CapitaMall Xuefu first nightlife party for youths
at CapitaMall Xuefu
20
UOB Kay Hian S-REITs Virtual Corporate Day 2021 * 11 August 2021*Marketing and Promotional Activities
Curating New Retail Experiences with Engaging Events
CapitaMall Qibao CapitaMall Nuohemule
Relived childhood memories with Partnered schools and dance
fun-filled games as part of studios to organise a freestyle
Children’s Day Celebration dance competition
Rock Square
Collaborated with Hainan Tourism
and Culture Bureau to promote
Hainan tourism industry through
cultural performances
CapitaMall Xuefu and
CapitaMall Aidemengdun
Featured exciting live
tournaments, including 2021 U.S.
Professional Wrestling China Tour
and basketball matches
21
UOB Kay Hian S-REITs Virtual Corporate Day 2021 * 11 August 2021*Business Park
Portfolio
CapitaMall Xinnan, ChengduBusiness Park Portfolio Overview
Total Valuation RMB 3.3 billion1
No. of Assets 5
Xi’an,
22.4% Located in 3 cities
Suzhou,
47.8%
Hangzhou,
29.8%
Note:
1. Based on agreed property value on effective stake basis.
23
UOB Kay Hian S-REITs Virtual Corporate Day 2021 * 11 August 2021*Further Boost in Business Park Occupancy
since Acquisition
Investment Property 30-Sep-20 31-Mar-21 30-Jun-21
Ascendas Xinsu Portfolio 90.3% 90.9% 93.3%
Ascendas Innovation Towers 91.4% 91.8% 97.4%
Ascendas Innovation Hub 93.1% 96.9% 96.2%
Singapore-Hangzhou Science Technology Park Phase I 93.0% 91.4% 90.1%
Singapore-Hangzhou Science Technology Park Phase II 93.7% 95.0% 95.6%
91.5% 92.1% 94.0%
Occupancy of Business
Park Portfolio1
30-Sep-20 31-Mar-21 30-Jun-21
Note:
1. Based on all committed leases as of 30 June 2021.
24
UOB Kay Hian S-REITs Virtual Corporate Day 2021 * 11 August 2021*Above Market Occupancies Across BP Assets
Occupancy as at 30 June 2021 (%)
97.4% Business Park properties
96.2% 95.6%
93.3% expected to maintain strong
90.1% occupancies due to:
✓ 100% return to office community
87.2%
✓ Good relationship with and
80.0% 80.0% support from local government
77.2% 77.2%
✓ Caters to high-growth and
innovation-based industries
✓ Designed to serve sophisticated
and changing tenant needs
✓ Supported by advanced
Ascendas Xinsu Ascendas Innovation Ascendas Innovation Singapore-Hangzhou Singapore-Hangzhou technology with wide ranging
Portfolio Towers Hub Science Technology Science Technology
Park Phase I Park Phase II
amenities and activities to boost
1 community spirit within the
CLCT Submarket
properties
Note:
1. Source: Colliers Research for Q2 2021. The submarket for the Ascendas Xinsu Portfolio is Suzhou Industrial Park w hile the submarket for Ascendas Innovation Towers and Ascendas Innovation Hub is Xi’an High-Tech
Industry Development Zone and the submarket for Singapore-Hangzhou Science Technology Park Phase I and II is Hangzhou Economic and Technological Development Area.
25
UOB Kay Hian S-REITs Virtual Corporate Day 2021 * 11 August 2021*Business Park Portfolio Lease Expiry Profile
Lease Expiry Profile for 20211
% of total % of total
No. of
Investment Property Gross Rental Net Lettable
Leases
Income2 Area3
Ascendas Xinsu Portfolio 67 16.0% 15.4%
Ascendas Innovation Towers 17 15.7% 14.0%
Ascendas Innovation Hub 13 32.4% 31.3%
Singapore-Hangzhou Science Technology Park Phase I 47 21.6% 21.2%
Singapore-Hangzhou Science Technology Park Phase II 11 6.3% 6.5%
Notes:
1. Based on contractual committed leases for June 2021.
2. As a percentage of each respective business park’s contractual monthly gross rental income for June 2021.
3. As a percentage of each respective business park’s committed net lettable area for June 2021.
26
UOB Kay Hian S-REITs Virtual Corporate Day 2021 * 11 August 2021*Business Park Portfolio Lease Expiry Profile
Lease Expiry Profile By Year1
No. of % of total Gross % of total
Year Weighted Average Lease
Leases Rental Income2,3 Net Lettable Area4
Expiry (years)
2021 155 16.2% 15.2%
2022 218 30.9% 31.9% 2.0
By Gross Rental Income 2
2023 190 24.6% 23.7%
2024 114 17.3% 17.1% 2.0
2025 22 3.1% 2.7% By Net Lettable Area
Beyond 2025 15 7.9% 9.4%
Notes:
1. Based on contractual committed leases for 30 June 2021.
2. Ex cludes gross turnover rent for Amenities within Business Park.
3. As a percentage of monthly contractual gross rental income for 30 June 2021.
4. As a percentage of monthly committed net lettable area for 30 June 2021.
27
UOB Kay Hian S-REITs Virtual Corporate Day 2021 * 11 August 2021*Business Park Portfolio Leasing Updates
Delivering Resilient Performance
BP Work Done in 1H 2021 New Leasing Demand by Sector in 1H 2021 Highlights
New I nformation and Renewed Top 10
Leases Communications Contributing Tenants
(I CT) Others
40.7% Ascendas Innovation Hub
23.1% 22.4% ✓ Renewed UnilC with ~4.5% rental
reversion
By NLA By NLA Secured New Domestic
Tenants from High-Growth
Sectors
Ascendas Innovation Towers
Renew al ✓ Brought in ~3,500 sq m of new high-
Leases E-commerce Electronics quality tenants in the Electronics and
59.3% 27.2% 27.3% ICT sector
Ascendas Xinsu Portfolio
✓ Attracted >2,000 sq m of renowned
56.7% of FY 2021 expiring NLA has been Majority of New Tenants are from the domestic tenants in the
emerging high-growth sectors Healthcare/Biomedical Sciences
completed in 1H 2021
sector
28
UOB Kay Hian S-REITs Virtual Corporate Day 2021 * 11 August 2021*Business Park Rental Reversion in 1H 20211
From 1 Jan to 30 Jun 2021
No. of new Area % of Total Net Var. over last
Investment Property
leases/renewals (sq m) Lettable Area rental rate2,3
Ascendas Xinsu Portfolio 84 57,342 16.4% 5.1%
Ascendas Innovation Towers 9 7,030 7.3% 17.3%
Ascendas Innovation Hub 13 7,731 21.3% 2.9%
Singapore-Hangzhou Science
41 19,807 19.5% 4.5%
Technology Park Phase I
Singapore-Hangzhou Science
11 5,971 4.7% 23.4%
Technology Park Phase II
Total Portfolio 158 97,881 13.8% 6.7%
Notes:
1. The rental reversion recognit ion of the vario us business parks project begin in the month of acquisition completion w ith the ex ception of the Singapore- Hangzhou Science & Technology Park Phase I and II. The
Singapore- Hangzhou Science & Technology Park Phase I and II projects were completed on 18 June 2021 but the rental reversion were recognized from the month of M arch 2021. The rental reversion recognition
of Ascendas Xinsu Portfolio, Ascendas innovation Towers and Ascendas Innovation Hub in the months of January 2021, February 2021 and February 2021 respectively.
2. Ex cludes gross turnover component, newly created units leased, short term renewals (< 1 year) and units vacant for >=1 year.
3. Includes re-configured units. 29
UOB Kay Hian S-REITs Virtual Corporate Day 2021 * 11 August 2021*Engaging and Nurturing our BP Community
Strengthening Relationship with Community-Building Activities
Ascendas
Innovation Tower
Organised Regular Fitness
Activities to Promote
Healthy Lifestyle
Bridge+ at Singapore Ascendas Innovation
Hangzhou Science & Hub and Ascendas
Technology Park Phase 2 Innovation Tower
Celebrated Mothers’ Day with Organised pop-up flea
interesting activities lined up markets offering a wide
including floral arrangement range of products to cater to
workshops various interest
30
UOB Kay Hian S-REITs Virtual Corporate Day 2021 * 11 August 2021*Capital
Management
31
Ascendas Innovation TowersFinancial Strength1 as at 30 June 2021
31 Mar 2021 30 Jun 2021 Offshore Loans
SGD 65% Diversified Funding
Gearing2 35.1% 35.9%
Onshore Loans Funding Sources
Sources
Average Cost RMB 19% S$1,719.9 million
2.51% 2.57%
of Debt3
Total Debt
MTN 16%
Interest
4.1x 4.4x
Coverage4
Average Term to Fixed Rate6 High Fixed Interest Rate
2.70 years 3.80 years
Maturity 78%
Interest
Rates
+/(-) S$ 0.6 million p.a.
Undistributed Floating Rate Impact on interest expense
Income Hedged 50% 55% 22% Assuming 0.1% p.a. increase/
into SGD5 (decrease) in v ariable rate
Notes:
1. All key financial indicators ex clude the effect of FRS 116 Leases, ex cept for Interest Coverage Ratio.
2. In accordance w ith the Property Funds Appendix , the aggregate leverage is calculated based on the proportionate share of total borrowings over deposited properties.
3. Ratio of the consolidated YTD 2021 interest ex pense reflected over weighted average borrowings on balance sheet.
4. Ratio is calculated by dividing the trailing 12 months EBITDA over the trailing 12 months interest ex pense (includes finance lease interest expenses under FRS 116) in accordance w ith MAS guidelines.
5. CLCT’s hedging policy is to hedge at least 50% of undistributed income into SGD and at least 60% of total debt to fix ed inter est rates.
6. Excluding RMB denominated loans.
32
UOB Kay Hian S-REITs Virtual Corporate Day 2021 * 11 August 2021*Prudent Capital Management
Successfully Completed 2021 Refinancing and Extended Debt Maturity Profile 1
S$ million
400
350
Debt Maturity Profile
134.8 33.1 2.9
300
(30 June 2021)
250 56.3 2
150.0
200 33.1
3.9
150 300.0
130.0 250.0 220.0
100
150.0 150.0
50 9.3 50.0 46.5
0
2021 2022 2023 2024 2025 2026 2027 2028 Beyond Total
2021 2022 2023 2024 2025 2026 2027 2028 Beyond
Total Debt (S$ million) 9.3 213.1 384.8 276.3 333.1 153.9 0.0 302.9 46.5 1,719.9
% of Total Debt
0.5% 12.4% 22.4% 16.1% 19.4% 8.9% 0.0% 17.6% 2.7% 100.0%
maturing by end FY
Unsecured Offshore Loan Notes under MTN Programme Secure Onshore RMB Loan
Notes:
1. Debt headroom of ~S$0.8 billion to 45% gearing limit and ~ S$1.3 billion to 50% gearing limit.
2. New S$150m 7-Yr Bond Issue.
33
UOB Kay Hian S-REITs Virtual Corporate Day 2021 * 11 August 2021*Looking Ahead
34
Ascendas Xinsu Square R&DCLCT Key Strategies
Key Objectives
1 Disciplined Portfolio Reconstitution - Create Value
✓ Increase diversification of revenue stream
✓ Expand footprint into targeted growth cities
✓ Engage Sponsor’s pipeline and third-party vendors
2 Disciplined Portfolio Reconstitution - Unlock Value
✓ Monetise older assets and acquire newer assets with higher
growth potential
✓ Decrease exposure to lower growth and non-core malls
3 Drive Organic Growth and Innovative Value Enhancement -
Extract Value
✓ Drive operational excellence, continuous AEI and space optimisation
35
UOB Kay Hian S-REITs Virtual Corporate Day 2021 * 11 August 2021*Rejuvenating Portfolio to be Future-Ready
1 Create Value
Investible Near-Term Acquisition Target:
Asset Classes ✓ Sizeable and quality asset and portfolio
✓ In new economy asset classes
✓ Diversify key city footprint and align with China’s economic growth plans to capture
Retail Business Park consumption-driven, higher-valued, service-led economy
5-Year Acquisition Growth Roadmap
Logistics Industrial New
New Economy Assets
Economy
(Business Park) 15% Retail
Assets 30%
30%
Commercial Data Centre Focus on New Economy
2021 Assets in the near term 2026
Asset Class by Asset Class by
AUM (%) AUM (%)
Integrated Developments
CLCT is the dedicated S-
REIT for CapitaLand Retail 85%
Group’s non-lodging China Expand into Integrated Integrated
Business w ith acquisition Developments/Commercial Developments/
pipeline access to Commercial 40%
CapitaLand’s China assets. … as we continue to rejuvenate and strengthen our retail assets
36
UOB Kay Hian S-REITs Virtual Corporate Day 2021 * 11 August 2021*Optimising Portfolio to Enhance Returns
2 Unlock Value: Divestment of Non-Core Assets to Improve Quality of Portfolio
CapitaMall Saihan
• Part of the bundle deal to divest CapitaMall Saihan and acquire CapitaMall
Nuohemule
• Rejuvenated portfolio with a higher quality asset and extended land tenure
expiry by 8 years
• Completed divestment in June 2021
CapitaMall Minzhongleyuan
• Non-core asset with limited upside
• Announced divestment in January 2021
• Completed divestment in February 2021
37
UOB Kay Hian S-REITs Virtual Corporate Day 2021 * 11 August 2021*Optimising Portfolio to Enhance Returns
3 Extract Value
CapitaMall Yuhuating Rock Square
First major asset enhancement works since opening in 2005:
• Around 700 sq m of
• AEI efforts include:
additional NLA has
✓ > 10,000 sq m of area. Enhancing
been added to-date
shopping experience by improving
with another >300 sq m
circulation spaces on Level 1, 2 and 3
to be added in 2022
✓ Refreshing brands and concepts to
across B2- L2
appeal to diverse consumers
✓ Upgrading façade to increase A&P • >30 new shops spanning more than 4,000
opportunities sq m opened in 2Q 2021 with offerings
ranging from F&B, fashion to IT
• Level 1 AEI expected to complete by 3Q 2021
New Offerings
Before AEI
Fashion & Family+
After AEI
One stop mall Family Entertainment Young
mall
Community Quality of Life Lifestyle Experiential
38
UOB Kay Hian S-REITs Virtual Corporate Day 2021 * 11 August 2021*Revving Up Next Phase of Growth
Entering a New Phase: Organic + Acquisitive + Reconstitution Growth
Active Rejuvenation and AUM
Acquisition and Divestment
6,000
Disciplined Recycling 777 S$4.4 billion1
Value (RMB million)
4,000 Acquisition Value Divestment Value 107
4,945
2,000 3,768
1,500 1,130 1,704
918
-
2016 2017 2018 2019 2020 1H 2021
Total 1,500 1,130 1,704 3,875 5,722 918
(RMB million)
✓ Acquired o Divested ✓ Acquired ✓ Acquired ✓ Acquired portfolio o Divested
CapitaMall CapitaMall 51% of Rock portfolio of 3 of 5 Business Parks3 CapitaMall
Xinnan Anzhen Square retail assets and 49% of Rock Minzhongleyuan
✓ Acquired Square and CapitaMall
Yuquan Mall2 o Divested Saihan
o Divested 51% of CapitaMall Erqi
CapitaMall Wuhu
Notes:
1. As at 31 December 2020 on an effective stake basis.
2. Yuquan M all has been renamed to CapitaMall Nuohemule. CapitaMall Nuohemule was launched on 20 December 2020. 39
3. Acquired 51% interest in Ascendas Xinsu Portfolio, 100% interest in Ascendas Innovation Towers, 80% interest in Ascendas Innovation Hub, 80% interest in Singapore-Hangzhou Science & Technology Park Phase I And Phase II.
UOB Kay Hian S-REITs Virtual Corporate Day 2021 * 11 August 2021*Strategically Aligned to China’s Growth Pillars
China 14th 5-year Plan: 1 Strengthen Domestic Consumption
towards greater self-sufficiency
• Identified as the main economic pillar
• Central Government goals include1:
✓ Increasing consumption expenditure as a share of GDP
China’s “Dual Circulation” Strategy
✓ Increasing household income and upgrading of urbanisation to drive
Retail 1
CLCT Strong Building Blocks
growth of middle-income population
2 Boost Innovation
Business • Facilitate China’s move up global value chains to become a global leader
in strategic emerging industries
Park
• Central Government goals include1:
✓ Increasing Research and Development (R&D) spending by 7.0% per
Potential to enter into
2 annum between now and 2025
o More tax breaks for selected industries to offset R&D costs
New Economy ✓ Increasing adoption rate of 5G users to 56%, strengthening digital
asset classes including
Logistics, Data Centre and
economy by up to 10% of GDP by 2025
Industrial
Note:
1. Source: CBRE, China’s 14 th five-year plan, M arch 2021
40
UOB Kay Hian S-REITs Virtual Corporate Day 2021 * 11 August 2021*Business Outlook and Key Focus
Operational Outlook
Recovery of consumer demand and continued Key Focus 1. Resilient and Quality Portfolio
growth of business activities are dependent on • Retail: Focus on offering lifestyle essentials
the resurgence of COVID-19 cases and necessities to densely populated vicinity
• Business Park: Provide high standards of property
Retail and customer services
• Normalisation trend maintains its momentum with high
resumption in social activities, gatherings and F&B dine-in • CapitaStar: Harnessing CapitaStar platform to drive
omni-channel offerings and value-add services
• Operating metrics reflect improvements in consumer
sentiment
2. Experienced Ground Team
• Leasing environment remains competitive on asking rents
with strong domain knowledge to capture new
business trends
Business Park
3. Prudent Capital Management
• Stronger business confidence observed on-the-ground
• Supported by China’s macro government policies, high-tech
industries will continue to be a strong demand driver 4. Access to Pipeline of High-Quality Assets
held under CapitaLand Group and
• Favourable leasing demand is expected to continue for our
Opportunities from Third-Party Vendors
Business Parks
41
UOB Kay Hian S-REITs Virtual Corporate Day 2021 * 11 August 2021*Thank
Thank you
You
For enquiries, please contact:
For enquiries, please contact: Ms Nicole Chen, Investor Relations
Direct: (65) 6713 1648, Email:
(Ms) Nicole Chen,nicole.chen@capitaland.com
Investor Relations
CapitaLand China Trust Management Limited (https://www.clct.com.sg)
Direct: (65) 6713 1648, Email: nicole.chen@capitaland.com
168 Robinson
168 Robinson Road,
Road, #30-01
#30-01 Capital
Capital Tower,
Tower, Singapore
Singapore 068912
068912
Tel: (65)
Tel: (65) 6713
6713 2888,
2888, Fax:
Fax: (65)
(65) 6713
6713 2999
2999Appendix
CapitaMall Aidemengdun, HarbinGross Revenue (in RMB’mil)
Portfolio1
135.6 1H 2020 1H 2021 (Retail) 1H 2021 (Business Park)
140.0
1H 2021
120.0
861.0 98.5 101.8
RMB mil 100.0
85.2 82.9
80.0
68.5% YoY 57.5
60.0
43.7 39.3 36.8 36.7 34.0
1H 2020 40.0 28.8 30.7
21.1
16.5
511.0 20.0 11.4
RMB mil 0.0 0.5
0.0
Notes:
1. All malls are multi-tenanted malls ex cept for CapitaMall Shuangjing and CapitaMall Erqi w hich are M aster-leased malls.
2. Includes 100% interest contributions from Rock Square w ith effect from 30 December 2020.
3. Ex cludes CapitaM all Saihan and CapitaM all Minzhongleyuan which were divested on 7 June 2021 and 10 February 2021 respectively.
44
UOB Kay Hian S-REITs Virtual Corporate Day 2021 * 11 August 2021*Net Property Income (in RMB’mil)
Portfolio1
94.8
95.0 1H 2020 1H 2021 (Retail) 1H 2021 (Business Park)
1H 2021
74.9
585.7 75.0 69.4
RMB mil 58.9 56.0
55.0
78.3% YoY 39.5
35.0 29.3 28.5
25.2
1H 2020 21.2 22.0
17.1 16.9 17.7
328.6 15.0 6.7 8.2
RMB mil 0.0 -0.5 0.0
-5.0
Notes:
1. All malls are multi-tenanted malls ex cept for CapitaMall Shuangjing and CapitaMall Erqi w hich are M aster-leased malls.
2. Includes 100% interest contributions from Rock Square w ith effect from 30 December 2020.
3. Ex cludes contributions from CapitaMall Saihan, CapitaM all Minzhongleyuan and CapitaMall Erqi w hich w ere divested on 7 June 2021, 10 February 2021, and 1 June 2020 respectively.
45
UOB Kay Hian S-REITs Virtual Corporate Day 2021 * 11 August 2021*Strength in Portfolio Diversification and Quality
Well-Diversified Exposure with more than 20 Trade Categories Across the Portfolio
Retail Supermarket
Serv ices Business Park
3.0%
5.3%
31.3%
Food & Bev erage
23.0%
Fashion 17.0% 16.3%
Essential Sectors Emerging High-
Growth Sectors
Leisure &
Entertainment 3.0%
Other Retail and Product Trades Other Business Park Trades
Beauty &
Education 3.0% Healthcare 5.2% Professional Services 2.7%
Sporting Goods & Apparel 2.9%
By GRI1 Real Estate 2.6%
Electronics 4.8% Others 4.9%
Jewellery/Watches 2.1%
Engineering 3.6%
Home Living 1.9%
E-Commerce 1.7%
Shoes & Bags 1.4%
IT & Telecommunication 1.4% I CT 3.1%
Other Retail and
Product Trades Financial Serv ices 1.3%
Department Stores 1.1% 17.0%
Other Business Biomedical Sciences 1.8%
Others 3.2%
Park Trades
10.2%
46
UOB Kay Hian S-REITs Virtual Corporate Day 2021 * 11 August 2021*Portfolio at a Glance1
CapitaMall CapitaMall CapitaMall Grand
Rock Square
Xizhimen Wangjing Canyon
乐峰广场
凯德MALL•西直门 凯德MALL•望京 凯德MALL• 大峡谷
Location Beijing Guangzhou Beijing Beijing
GFA (sq m) 83,075 88,279 83,768 92,918
GRA (sq m) 83,075 83,591 68,010 69,967
NLA (sq m) 50,753 53,107 51,808 44,623
23 Aug 2044 15 May 2043 29 Aug 2044
Land Use Right Expiry 23 Aug 2054
17 Oct 2045
15 May 2053 29 Aug 2054
Valuation (RMB mil) 2 3,580 3,414 2,772 2,125
Committed Occupancy 98.9% 96.4% 93.7% 93.5%
Stake 100% 100% 100% 100%
Notes:
1. As at 30 June 2021.
2. Based on valuation as at 31 December 2020.
47
UOB Kay Hian S-REITs Virtual Corporate Day 2021 * 11 August 2021*Portfolio at a Glance1
CapitaMall CapitaMall
CapitaMall Xuefu CapitaMall Xinnan
Nuohemule Yuhuating
凯德广场•学府 凯德广场• 新南
凯德广场 •诺和木勒 凯德广场•雨花亭
Location Harbin Chengdu Hohhot Changsha
GFA (sq m) 123,811 91,816 100,047 75,431
GRA (sq m) 104,294 53,619 76,309 58,575
NLA (sq m) 64,112 37,027 43,940 48,420
Land Use Right Expiry 15 Dec 2045 17 Oct 2047 26 Jul 2049 03 Mar 2044
Valuation (RMB mil) 2 1,774 1,600 1,006 760
Committed Occupancy 98.9% 96.7% 100.0%3 97.3%
Stake 100% 100% 100% 100%
Notes:
1. As at 30 June 2021.
2. Based on valuation as at 31 December 2020.
3. Ex clude non-retail storeroom units.
48
UOB Kay Hian S-REITs Virtual Corporate Day 2021 * 11 August 2021*Portfolio at a Glance1
CapitaMall Aidemengdun CapitaMall Qibao CapitaMall Shuangjing
凯德广场•埃德蒙顿 凯德七宝购物广场 凯德MALL•双井
Location Harbin Shanghai Beijing
GFA (sq m) 49,040 83,986 49,463
GRA (sq m) 43,394 72,729 49,463
NLA (sq m) 28,276 50,638 51,1932
Land Use Right Expiry 7 Sep 2042 10 Mar 20433 10 Jul 2042
Valuation (RMB mil)4 469 835 610
Committed Occupancy 92.2% 82.6% 98.5%
Stake 100% 100% 100%
Notes:
1. As at 30 June 2021.
2. Included the area zoned for civil defense but is certified for commercial use.
3. CapitaM all Qibao is indirectly held by CLCT under a master lease w ith Shanghai Jin Qiu (Group) Co., Ltd, the legal ow ner of Qibao Mall. Accordingly, the land use right is ow ned by the legal owner.
4. Based on valuation as at 31 December 2020.
5. On the basis that CLCT did not renew the master lease which ex pires in January 2024. Assuming the master lease is renewed, the valuation will be RM B425.0 million.
49
UOB Kay Hian S-REITs Virtual Corporate Day 2021 * 11 August 2021*Portfolio at a Glance1
● Portfolio at a Glance
Ascendas Ascendas Ascendas
Singapore-Hangzhou
Science Technology
Singapore-Hangzhou
Science Technology
Xinsu Portfolio Innovation Towers Innovation Hub
Park Phase I Park Phase II
腾飞新苏 新加坡腾飞科汇城 腾飞创新中心
新加坡杭州科技园一期 新加坡杭州科技园二期
Location Suzhou Xi’an Xi’an Hangzhou Hangzhou
GFA (sq m) 373,334 118,495 40,547 101,811 130,261
NLA (sq m) 349,700 96,040 36,288 101,450 126,294
31 December
Land Use Right Expiry 2046 to 30 19 February 2064 23 May 2051 4 September 2056 6 July 2060
May 2057 2
Agreed Value (RMB mil) 3 2,265 759 298 641 767
Committed Occupancy 93.3% 97.4% 96.2% 90.1% 95.6%
Stake 51% 100% 80% 80% 80%
Notes:
1. As at 30 June 2021.
2. Ascendas Xinsu Portfolio consists of multiple plots of land w ith varying land use right ex piry.
3. Based on agreed property value on 100% basis.
50
UOB Kay Hian S-REITs Virtual Corporate Day 2021 * 11 August 2021*You can also read