GUIDANCE D Geolocation Data Requirements and Risk Maps - Version 1.1 - Rainforest Alliance
←
→
Page content transcription
If your browser does not render page correctly, please read the page content below
GUIDANCE D
Geolocation Data Requirements and Risk
Maps

Version 1.1

© 2021 Rainforest Alliance. All rights reserved.
Translation Disclaimer
For any question related to the precise meaning of the information contained in the
translation, please refer to the official English version for clarification. Any discrepancies or
differences in meaning due to translation are not binding and have no effect for auditing or
certification purposes.

More information?
For more information about the Rainforest Alliance, visit www.rainforest-alliance.org or
contact info@ra.org

        Document Name:                                Document Code: Version:
        Guidance D: Geolocation Data                  SA-G-SD-5-V1.1       V1.1
        Requirements and Risk Maps
        Date of first          Date of revision:      Valid From:          Expires by:
        publication:
        December 31, 2020 June 30, 2021               N/A                  Until further notice
        Developed by:                                 Approved by:
        Rainforest Alliance Department Standards Director of Standards and Assurance
        and Assurance
        Linked to:
        SA-S-SD-1-V1.1 Rainforest Alliance 2020 Sustainable Agriculture Standard, Farm
        requirements (1.2.12. 1.2.13. 1.2.14. 1.2.15. and 6.1.1. 6.1.2)
        SA-S-SD-13-V1 Annex S12: Additional Details on requirements for no-conversion
        SA-S-SD-18-V1.1 Annex S17: Collection of Geolocation Data
        Replaces:
        SA-G-SD-5-V1.1 Guidance Document D: Geolocation and Risk Maps
        Applicable to:
        Farm Certificate holders, Certification Bodies

        Country/Region:
        All
        Crop:                                         Type of Certification:
        All crops in the scope of the Rainforest      Farm Certification
        Alliance certification system; please see
        Certification Rules.

SA-G-SD-5-V1.1                                                                                      2
TABLE OF CONTENTS
List of Figures and Tables ...................................................................................................................... 3
1. Purpose ........................................................................................................................................... 4
2. Abbreviations ................................................................................................................................. 5
3. Definitions ....................................................................................................................................... 6
4. Applicability and responsibility .................................................................................................... 8
5. Rainforest Alliance Certification Platform ................................................................................... 8
5.1. Data quality validation ........................................................................................................ 8
5.2. Geodata validation ............................................................................................................. 9
5.3. Risk assessment and outputs ............................................................................................... 9
5.4. Deforestation risk map ................................................................................................... 11
5.4.1. Encroachment into Protected Areas map .............................................................. 12
5.4.2. Geodata Risk table ..................................................................................................... 13
5.4.3. Use of Risk Maps .......................................................................................................... 13
6. Geodata collection .................................................................................................................... 13
6.1. Collection Devices .............................................................................................................. 13
6.2. Collection methods ............................................................................................................ 14
6.3. Good Geodata collection practices ............................................................................... 15
LIST OF FIGURES AND TABLES
Figure 1. Graphic representation of a farm unit ............................................................................... 6
Table 1. Relevant definitions for deforestation risk .......................................................................... 11
Table 2. Classification of "Go" and "No-Go" Protected Areas ....................................................... 12
SA-G-SD-5-V1.1 31. PURPOSE Accurate geolocation data is essential to ensure compliance with the 2020 Rainforest Alliance Sustainable Agricultural Standard (referred to as “the standard” in this document). Deforestation and production in Protected Areas are important risk topics for many stakeholders in the Rainforest Alliance certification system, and appropriate assurance mechanisms are necessary to meet this need. Mapping the boundaries of farms is also the best way to obtain an accurate measurement of the farm area, which is the basis for estimating certified yield and appropriate quantities of agrochemicals. The inclusion of a more geodata-driven decision-making process requires Rainforest Alliance to provide options and guidance to collect this data. This document clarifies geolocation data requirements and provides a set of guidelines to assist Certificate Holders (CHs) in recording such information according to the Standard's requirements. It also provides guidelines for Certification Bodies (CBs) on how to verify this data during the audit process. The applications/devices mentioned in this guidance have been included because they are accessible, easy-to-use, affordable, and will enable users to gather the required data. Mapping devices or GPS handhelds have many forms and prices, depending on features and accuracy. The ones listed herein have been considered based on this as well as post- processing features. As this is only a guide, CHs are also free to choose other applications/devices available to them, as long as they can meet the data requirements of the Standard. Please note that some of the tools and IT systems used for geospatial data collection and analysis are still under development. Further guidance will be provided as soon as these are ready to be used. SA-G-SD-5-V1.1 4
2. ABBREVIATIONS
CB               Certification Body
CH               Certificate Holder
CGLC             Copernicus Global Land Cover
CRS              Coordinate Reference System
CSV              Comma-Separated Values
DMS              Decimal Minutes Seconds
GIS              Geographical Information System
GMR              Group Member Registry
GPS              Global Positioning System
GPX              GPS Exchange Format
IUCN             International Union for Conservation of Nature and Natural
                 Resources
KML              Key Markup Language
KMZ              Key Markup Zipped
PA               Protected Areas
RACP             Rainforest Alliance Certification Platform
TCL              Tree Cover Loss
WDPA             World Database of Protected Areas

SA-G-SD-5-V1.1                                                                5
3. DEFINITIONS
“Go” protected area: Protected areas where certain regulated economic and agricultural
activities area allowed under specific conditions (specified in applicable law) and in
correspondence with categories IV, V, and VI of the IUCN classification for protected areas.
“No-go” protected area: Protected areas with high conservation priority, with a strictly
protected regulation. Agricultural production is not allowed under applicable law and in
correspondence with category Ia, Ib, II, III, Not Reported, Not Applicable, Not Assigned of the
IUCN classification for protected areas.
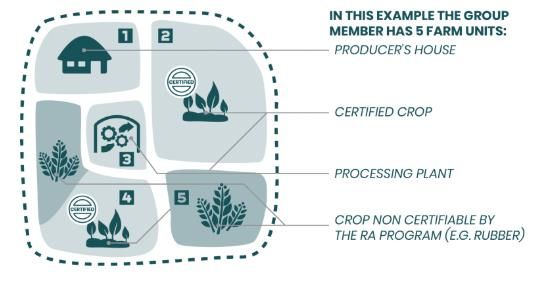
Farm unit: A piece of continuous land that is part of a farm. A farm unit can include both
agricultural and non-agricultural land with buildings, facilities, water bodies, and other
features. See figure below for the illustration of this explanation.
Figure 1. Graphic representation of a farm unit
Farm: All land and facilities used for agricultural production and processing activities under
the geographical scope of the farm applicable for Rainforest Alliance certification. A farm
may be composed of several neighboring or geographically separate farm units within one
country, provided that they are under a common management body. All farms and farm
units falling within this geographical scope must comply with the 2020 Rainforest Alliance
Sustainable Agriculture Standard, even when a different crop from the certified one is also
cultivated (e.g. farm/farm unit with a plantation of rice belonging to a producer who is part
of a certified group for coffee that falls within the same geographical scope). A farm may be
composed of several neighboring or geographically separate units of land within one
country if they are under a common management body.
Geolocation data: Data that identifies the geographic location of farms and boundaries of
farms, farm units, and other facilities of the Rainforest Alliance certificate holders.
Geolocation data is represented by coordinates generally collected through Geopositioning
Systems (GPS) mapping using either individual location points (including envelopes) or
polygons which define the full boundaries of the relevant area.
Location point: A pair of latitude/longitude coordinates collected through Geographic Information
Systems (GIS) Data. The location point is a single data point. It can be used to represent the location of
a farm/farm unit when no polygon information is available. Location points should be taken at the
center of the farm unit. If a farm consists of multiple farm units, the location point should be taken at the
center of the largest farm unit.
Forest: Land spanning more than 0.5 hectares with trees higher than 5 meters and a canopy
cover of more than 10%, or trees able to reach these thresholds in situ. It does not include
land that is predominantly under agricultural or other land use.
SA-G-SD-5-V1.1 6Polygon (geographic polygons): A geographic boundary that encloses an area representing a farm/farm unit. Such polygons can be mapped and coded with essential data about the farm (referred to as attributes), such as farm ID, farm area (hectares), production area, crop, owner, certification status. Protected areas: An area of land declared or designated by relevant authorities as protected because of its recognized natural, ecological and/or cultural values to achieve the long-term conservation of nature with associated ecosystem assets and cultural values. Examples include national parks, wildlife refuges, biological or forestry reserves, private reserves, and areas within UNESCO Biosphere reserves or World Heritage Sites. Production might be allowed in a protected under applicable law, which can constitute a certain zoning in a management plan (multi-use zones), a certain category of protected areas (IUCN categories V, VI), or permits (for example, admitted farms). Risk maps: Maps showing the risk indication levels of countries, CHs and/or farm/farm units for key topics part of the certification program (e.g. deforestation and encroachment in protected areas, child labor and forced labor). These are made by combining external data sources with location data. Way point(s): Intermediate point(s) on a route. It refers to coordinate(s) which specify one’s position on the globe. SA-G-SD-5-V1.1 7
4. APPLICABILITY AND RESPONSIBILITY
Certificate Holders:
CHs are required to provide geolocation data to the Rainforest Alliance Certification
Platform (RACP) as described in Annex S17. Collecting Geolocation Data and in compliance
with the Standard requirements and Certification and Auditing Rules.

CHs are also required to use the risk maps as indicated in the Certification and Auditing Rules
AR5 and AR6 and Chapter 5.3 of this document.

CHs need to collect accurate information. Internal inspectors must review and verify
geolocation data, which will also be checked during the external audit process.

Certification Bodies:
CBs are required to review and verify geolocation data provided by the CH during the audit
process.

CBs are also required to use the risk maps as indicated in the Certification and Auditing Rules
AR5 and AR6 and Chapter 5.3 of this document.

   5. RAINFOREST ALLIANCE CERTIFICATION PLATFORM
The Rainforest Alliance Certification platform (RACP) requires CHs to upload the Group
Member Registry (Annex S13) and other documents as required by the Certification Program.
The RACP will conduct two validation checks on the data uploaded through the GMR to
ensure data quality. If there are no errors in the GMR, the data will be approved. If errors are
found, CHs will be required to correct these before approval. Once the data is approved,
the platform will conduct the geodata risk assessment and share the results of this with the
CH as well as the CB, who will be conducting the audit.

           5.1.        DATA QUALITY VALIDATION
Before creating the risk maps, the RACP will validate the data provided by the user. The first
validation will include the validation of the geodata provided in the GMR. This data must be
correct before the second (geodata) validation can be conducted. Therefore, the following
checks are conducted, and this is the minimum quality required before the second
validation can proceed:
    i.  Coordinates with non-numerical values:
        a) It cannot include the units, north, south, east, west
        b) Decimal numbers must be separated from integer numbers
        c) Example of a correct coordinate: “4.1230 or “-3.1230”.
   ii.  Location points with sufficient decimal places:
        a) A minimal requirement is 4 decimals, except if the last digit is 0.
        b) Example of a correct location point: “4.12301” or “-3.12301”
  iii.  The geometry of the provided polygons is correct
 iv.    No repetition of coordinates
  v.    No location points/polygons that land outside of the extent of the geographical area
        of possible certified crop, e.g. those that show in the ocean or a different country.
 vi.    No location points that show at the same location (i.e. all points must have a unique
        location).
 vii.   Farm polygons have been reviewed to ensure no overlap and that the area size
        reflects the reported farm area.

SA-G-SD-5-V1.1                                                                                     8
Two common mistakes to avoid:
• Misplaced signs
• Switched/transposed latitude/longitude values. This can be avoided by directly
transferring (electronically via USB) the latitude/longitude values from the Global
Positioning System (GPS) to the computer and inserted digitally into the GMR.
5.2. GEODATA VALIDATION
The Geospatial Platform works with algorithms and several sets of rules that analyze the
quality of the geodata. This platform determines whether there are issues that must be
corrected by the CH and/or further analyzed during the audit. This analysis will be provided
to both the CHs and CBs
The geodata validation consists of the following three checks:
1. Country check: validates whether or not the point provided is in the correct country
2. Waterbody check: validates whether or not the point provided is located on an
actual landmass or in a waterbody
3. Overlap check: validates whether or not the geodata (point/polygon) provided
overlaps with others provided within the same CH.
Over time, the system will be able to perform an additional check which is an overlap of
geodata (point/polygon) between certified CHs.
CHs are responsible for correcting the errors identified by the RACP validations. The CH will
not be able to continue with the certification process until all errors are corrected. Not all
issues will be able to be identified by the RACP and will thus require CB verification during the
audit process. This is further explained in AR 5 of the Certification and Auditing rules.
5.3. RISK ASSESSMENT AND OUTPUTS
The outcome of the geodata quality validation and the risk assessment will be shared with
the CHs in the RACP. This data should be shared by the CH with their CB after the contract is
signed.
The Risk assessment will provide the following outputs for each individual CH:
I. Deforestation risk map
II. Encroachment into a Protected Areas risk map
III. Geodata risk table
These outputs will give an overview of possible non-compliance with Standard requirements
6.1.1 and 6.1.2 and must be corrected by the CHs and verified by the CBs during the audit
process. In addition, the geodata risk table provides information on the farm unit and the
levels of risk for both deforestation and encroachment into Protected Areas. These risk maps
are further explained below.
The user will see the color-coded indication of risk level for each farm unit in the certification
scope for which geolocation data was provided. The legend included in the maps will
explain the meaning of the 3 risk levels used:
- High (red)
- Medium (orange)
- Low (green)
SA-G-SD-5-V1.1 9In the case of deforestation, farm units indicated as high risk are those that overlap with the intersection of the “Rainforest Alliance Forest” layer or the “Copernicus Global Land Cover” layer (CGLC1) and Tree Cover Loss (TCL2). In the case of Protected Areas, farm units indicated as high risk are those that overlap with Protected Areas classified as “No-go.” Farm units indicated as a medium risk for encroachment into Protected Areas are those in overlap with Protected Areas classified as “Go". Production in these areas is allowed under certain conditions (refer to Chapter 0 for the definitions). This will be verified during the audit by the CB. When one of the risk maps indicates a high risk for deforestation or encroachment into Protected Areas, the CH and CB must take appropriate steps to address the issues. These are prescribed in Annexes AR1, AR5 and AR6 of the Certification and Auditing rules. The risk maps will be provided in a GeoPDF format. Please see Guidance: GeoPDF user guidance for more information on how to use the GeoPDF. Each time the CH updates geolocation data, they can ask Rainforest Alliance to updated their risk maps (deforestation and/or encroachment into Protected Areas). The better the geolocation data provided (e.g. polygons instead of location points), the more accurate the risk maps and, therefore, the easier it will be to implement the Certification Program requirements correctly. 1 Copernicus program – European Space Agency 2 Hansen/UMD/Google/USGS/NASA SA-G-SD-5-V1.1 10
5.4.     Deforestation risk map

The deforestation risk map is created by overlaying the geolocation data provided by the
CH with the Rainforest Alliance Forest Layer or CGLC and TCL. The overlap of these layers
with the specific location of farm units will provide an indication of deforestation that has
occurred since the cut-off date of 2014. This data will show the current deforestation risk of
each farm unit.

The Rainforest Alliance Forest Layer is used for countries identified as high risk for
deforestation. The CGLC is used for countries identified as medium or low risk for
deforestation. The TCL is used to detect the areas with forest loss inside the forest cover. The
table below shows the specifications and definitions used for these layers.

             Dataset                    Specifications                                   Definition
    Rainforest Alliance             Forest layer for              Forest: land spanning more than 0.5
    Forest Layer                    countries identified          hectares with trees higher than 5 meters
                                    as high risk for              and a canopy cover of more than 10%, or
                                    deforestation.                trees able to reach these thresholds in situ.
                                    Spatial resolution:           It does not include land that is
                                    10m.                          predominantly under agricultural or other
                                                                  land use.3

    Copernicus Forest               Forest layer for              Forest; Based on the Forest Type layer.
    Layer                           countries identified          Using at least 10% tree cover density and
                                    as medium or low              using Dominant Leaf Type (DLT) layer
                                    risk for                      together with FAO’s forest definition to
                                    deforestation.                exclude and include areas.
                                    Spatial resolution:           For more information, please check this
                                    100m.                         link.
                                    Version: 3.0

    Tree Cover Loss layer           Hansen UMD Tree               Tree cover: all vegetation greater than 5
    (TCL)                           Cover Loss                    meters in height and may take the form of
                                    Spatial resolution:           natural forests or plantations across a
                                    30m.                          range of canopy densities.
                                    Version: 2.0.7                Tree cover loss: defined as “stand
                                                                  replacement disturbance”, or the
                                                                  complete removal of tree cover canopy.

Table 1. Relevant definitions for deforestation risk

3For risky countries: If there is a national forest definition in the country with a clear minimum forest size threshold, this
definition will be used as long as the size threshold is < 0.5 ha, otherwise the forest definition described will be
implemented.

SA-G-SD-5-V1.1                                                                                                                   11
5.4.1. Encroachment into Protected Areas map
The encroachment into the Protected Area risk map is created by overlapping the proximity
of farms to either the Protected Areas information provided by the government or the World
Database on Protected Areas (WDPA). The overlap will indicate whether CHs are producing
inside Protected Areas and whether or not such production is allowed according to
applicable law.
The following table shows the categorization of Protected Areas in “go” and “no-go” areas
following the International Union for Conservation of Nature (IUCN) standards.
IUCN Category Name Rainforest Alliance
Classification
Ia Strict nature reserve No-go
Ib Wilderness area
II National Park
III Natural monument
IV Habitat/species management area Go
V Protected landscape
VI Protected area with sustainable use of
resources
Not Reported For protected areas where an IUCN category
is unknown and/or the data, the provider has
not provided any related information.
Not Applicable The IUCN Management Categories do not
apply to a specific designation type. This
currently applies to World Heritage Sites and
UNESCO MAB Reserves.
Not Applicable also applies to a site that
No-go
does not fit the standard definition of a
protected area (PA_DEF field = 0).
Not Assigned The protected area meets the standard
definition of protected areas (PAF_DEF = 1)
but the data provider has chosen not to use
the IUCN Protected Area Management
Categories.
Table 2. Classification of "Go" and "No-Go" Protected Areas
The last three categories in the table above (Not Reported, Not Applicable & Not Assigned)
will be classified as No-Go Protected Areas by the Rainforest Alliance unless data/evidence
can be provided which proves otherwise. This will be analyzed per country on a case-by-
case basis.
SA-G-SD-5-V1.1 125.4.2. Geodata Risk table
The Geodata risk table contains the results from the risk assessment and will be provided to
the CHs together with the risk maps. The tables indicate the risk level for deforestation and
encroachment into protected areas for each farm unit. In addition, this table provides the
following information:
• Percentage of overlap of the farm unit with any deforested area,
• Whether the unit is located in a 'Go or No-Go area
• The size of the farm unit
• The owner of the farm unit.
5.4.3. Use of Risk Maps
As required in Annex S17: Collecting geolocation data, CHs have to provide/update
geolocation data upon registration and ensure all data has geolocation data has been
registered before the audit takes place. This data will be used to produce the audit risk maps
for deforestation and encroachment into Protected Areas.
Based on the results of the registration risk map, the CH shall assess the indication of risk levels
of:
1) The farm units regarding conversion of natural forests and other natural ecosystems
(standard requirement 6.1.1),
2) Production and/or processing in Protected Areas and the designated buffer zones
(standard requirement 6.1.2).
Furthermore, the CH should adapt the management plan accordingly and implement the
appropriate risk mitigation measures as indicated in the Certification Rules. CHs can also
consult Guidance M: Natural ecosystems and vegetation, Section 1 for ideas on potential
actions which can be included in the management plan. Finally, the CH is responsible for
providing any requested evidence of compliance to the CB.
6. GEODATA COLLECTION
6.1. COLLECTION DEVICES
There are two ways to collect geospatial data:
• Option 1: Using mapping-handheld devices (GPS/GNSS device)
Handheld or GPS devices are specifically designed to work with coordinates, have high
precision and accuracy, and can collect coordinates stored as waypoints.
There are many different brands of mapping handhelds e.g. Garmin, Magellan, Topcon, and
Trimble. Basic models can do the job and are not expensive. These devices also come with
guidance documents on collecting and exporting the data from the device to the
computer.
Some more advanced models include aerial imagery and touch screens. The inclusion of
aerial imagery is useful for hilly and very densely forested locations.
Advantages of handheld devices: batteries last longer, antenna are stronger, more resilient
to rain, efficient and complementary software allows the conversion of the data to different
formats.
SA-G-SD-5-V1.1 13• Option 2: Using mapping applications on mobile devices (smartphones, tablets)
Smartphones and tablets can collect locations points using several apps. The precision of
these applications depends on the antenna in your mobile device, the weather, and the
time given to collect the geolocations.
A good paid example is the ESRI software (ArcGIS), but this is not accessible for all. Examples
of free tools which work on both desktop and mobile are Google my Maps and Google
Earth. More step-by-step information on how to use these applications can be found in
Guidance: Google My Maps and Guidance: Google Earth available on the website.If mobile
devices are used, make sure to take them fully charged when beginning the mapping. The
process will discharge batteries extremely fast. Therefore it is recommended to bring a fully
charged powerbank/portable charger if available.
The Farm Intelligence App, being developed by Rainforest Alliance, will be an additional tool
CHs can use for location point data collection. Most smartphones do not need an internet
connection or cellular data coverage to collect location data. CHs may also consult with
local government agencies and land registries for geolocation data.
CHs and CBs are free to use any application or devices (e.g. Garmin, drone) available, as
long the data provided to the Rainforest Alliance meets the requirements of Annex S17.
Collecting Geolocation Data
6.2. COLLECTION METHODS
The Standard requires the collection of both points and polygons. Below is further guidance
on how to collect these two different data sets.
• Collecting points
Most smartphones and tablets have a GPS receiver built-in to estimate the current location,
and many apps are available for these devices to the user with mapping. The examples of
apps mentioned below are free, easy to use and work offline. It is important to configure the
settings in the apps to report the location in decimal degrees. The location coordinates can
either be saved as “waypoints” within the app and transferred digitally to a computer or
retrieved from an app display and then transferred.
• Collecting polygons
There are several methods to create polygons, one of which is to draw them by using
reference location points that define the boundaries of the farm(s)/farm unit(s). These points
should be collected at the corners or along the edges of the farm(s)/farm unit(s). Once you
have these points, a polygon boundary can be drawn using Google My Maps, Google Earth,
Basecamp (Garmin free software), or any standard Geographical Information System (GIS),
provided the boundaries can be seen on satellite imagery. There are numerous GIS, Web-
mapping computer programs, and mobile applications that can be used to draw farm
polygons.
Another method is to track your movement and walk around the borders of the farm, but this
can be challenging when obstacles on the border are found. Instead of using the “tracking”
method, collecting reference points makes it easier to manage and edit the data later.
Google Earth or Google My Maps are programs that enable the user to import points
collected in the field and draw a polygon. Google my maps is a mobile app that cannot
collect lines and polygons but that can collect reference points in the field. Using such a tool,
the collector can record points from all the corners of the farm(s)/farm unit(s) unit by first
SA-G-SD-5-V1.1 14collecting a waypoint in one location, naming this point (e.g. “southeast corner” or “Point1”)
and then move to the next location on the farm to collect the second point. At the second
point create a new waypoint and give this point a name (e.g. “northeast corner” or
“Point2”). Ensure to collect these points along the edges of the farm. Once the reference
points of the unit are collected, a polygon can be drawn and saved as a spatial KML file.
Distinctive features such as roads, rivers, clearings, forest patches, fences, or large buildings
can provide landmarks that help identify the site and fine-tune the digitized boundaries.
Data collection tips
• When collecting geolocation data ensure that the Coordinate Reference System
(CRS) is set to “EPSG:4326 – WGS 84”. This will improve the data quality. Guidance:
Converting Geospatial files (available on the website) explains how to do so using
QGIS.
• It is important to note that the software which runs the risk analysis uses the projection
EPSG:4326. Therefore, if data is provided in a different coordinate system or
projection, the location of farms could show up incorrectly, and the CH be
automatically classified as high risk.
6.3. GOOD GEODATA COLLECTION PRACTICES
Nowadays, most of the chips found in smartphones are multi-Global Navigation Satellite
System (GNSS), meaning they use data from more than one GNSS constellation. It has been
reported that GPS-enabled smartphones are typically accurate within a 4.94m radius under
open sky conditions. However, the accuracy of your GNSS device can be impacted by
many factors, including satellite geometry, signal blockage due to buildings or trees, and
atmospheric conditions. CHs can improve the accuracy of data collection in the field in
these ways:
• Wait at least 60 seconds in 1 spot before collecting the geolocation. This is because
the GPS receiver of your device needs time to connect to the GNSS satellite
constellation and find the current location. Doing this will increase the accuracy of
the receiver.
• Collect the data when the sky is as clear as possible, as clouds disrupt the signal and
reduce the precision/accuracy.
• Collect the data in an open area if possible. Tree cover, buildings, and other (metal)
objects disrupt the signal and reduce the precision/accuracy.
• Check the accuracy of your device and verify the number of satellites connected to
your device by using an additional app.
Several apps can help you
improve/check the accuracy of your
geolocation collection by looking at
the number of satellites connected to
your mobile device. One of these
which can be downloaded on
Android is GPSTest.
4van Diggelen, Frank, Enge, Per, "The World’s first GPS MOOC and Worldwide Laboratory using Smartphones,"
Proceedings of the 28th International Technical Meeting of the Satellite Division of The Institute of Navigation (ION
GNSS+ 2015), Tampa, Florida, September 2015, pp. 361-369.
(https://www.ion.org/publications/abstract.cfm?articleID=13079)
SA-G-SD-5-V1.1 15You can also read