X-Factor HMMs for detecting falls in the absence of fall-specific training data
←
→
Page content transcription
If your browser does not render page correctly, please read the page content below
X-Factor HMMs for detecting falls in the absence of
               fall-specific training data

     Shehroz S.Khan1 , Michelle E. Karg1,2,3 , Dana Kulić1,2,3 , and Jesse Hoey1,3
                        1
                          David R. Cheriton School of Computer Science,
                    2
                        Department of Electrical and Computer Engineering,
                                University of Waterloo, Canada
                           3
                             Toronto Rehabilitation Institute, Canada
                         {s255khan,mekarg,dkulic,jhoey}@uwaterloo.ca

       Abstract. Detection of falls is very important from a health and safety perspec-
       tive. However, falls occur rarely and infrequently, which leads to either limited or
       no training data and thus can severely impair the performance of supervised activ-
       ity recognition algorithms. In this paper, we address the problem of identification
       of falls in the absence of training data for falls, but with abundant training data for
       normal activities. We propose two ‘X-Factor’ Hidden Markov Model (XHMMs)
       approaches that are like normal HMMs, but have “inflated” output covariances
       (observation models), which can be estimated using cross-validation on the set of
       ‘outliers’ in the normal data that serve as proxies for the (unseen) fall data. This
       allows the XHMMs to be learned from only normal activity data. We tested the
       proposed XHMM approaches on two real activity recognition datasets that show
       high detection rates for falls in the absence of training data.

Keywords: Fall Detection, Hidden Markov Models, X-Factor, Outlier Detection
1   Introduction
Detection of falls is important because it can have direct implications on the health
and safety of an individual. However, falls occurs rarely, infrequently and unexpectedly
w.r.t. other normal Activities of Daily Living (ADL) and this leads to either little or no
training data [9], which makes it very difficult to learn generalized fall detection clas-
sifiers due to the skewed class distributions. A typical supervised activity recognition
system may not be very useful as a fall may not have occurred earlier. An alternative
strategy is to build fall detection specific classifiers [5] that assume sufficient training
data for falls, which is hard to obtain in practice. Another challenge is the data col-
lection for falls, as it may require a person to actually undergo falling which may be
harmful, ethically questionable, and cumbersome. The research question we address in
this paper is: Can we recognise falls by observing only normal ADL with no training
data for the falls in a person independent manner? To tackle this problem, we present
two Hidden Markov model (HMM) based sequence classification approaches for de-
tecting short-term fall events. The first method models individual activities by separate
HMMs and an alternative HMM is constructed whose model parameters are averages
of normal activity models, while the averaged covariance matrix is artificially “inflated”
to model falls. In the second method, all the normal activities are grouped together and
modelled with a common HMM and an alternative HMM is constructed to model falls
with a covariance matrix “inflated” w.r.t the normal model. The inflation parameters
of the proposed approaches are estimated using a novel cross-validation approach in
which the outliers in the normal data are used as proxies for the (unseen) fall data.
In Section 2, we discuss the related research work, and the proposed HMM based
approaches for fall detection in Section 3 and 4. Experimental results are presented in
Section 5, followed by conclusions in Section 6.
2 Related Work
Several research works in fall detection are based on thresholding techniques [2], wherein
raw or transformed sensor data is compared against a single or multiple pre-defined
thresholds. A two-layer HMM approach, SensFall [13], is used to identify falls from
other normal activities. In the first layer, the HMM classifies an unknown activity as
normal vertical activity or “other”, while in second stage the “other” activity is classi-
fied as either normal horizontal activity or as a fall. Chen et al. [4] present a fall detec-
tion algorithm that uses accelerometer data from a smartphone. A HMM is employed to
filter out noisy data, One-class Support Vector Machines (OSVM) is applied to reduce
false positives, followed by a posture analysis to reduce false negatives. Honda et al. [8]
present an approach detecting nearly fall incidents of pedestrians in outdoor situations.
They use Wii and Wii motion plus sensors and collected data for both normal activi-
ties and nearly fall incidents and use a SVM classifier for their identification. Zhang
et al. [25] trained an OSVM from positive samples (falls) and outliers (non-fall ADL)
and show that falls can be detected effectively. Yu et al. [24] propose to train Fuzzy
OSVM on fall activity captured using video cameras and tuned parameters using both
fall and non-fall activities. Their method assigns fuzzy membership to different training
samples to reflect their importance during classification and is shown to perform better
than OSVM. Shi et al. [19] use standard HMMs to model several normal activities in-
cluding falls and perform classification with high accuracy from inertial sensors. Tong
et al. [22] uses the accelerometer time series from human fall sequences and a HMM is
trained on events just before the collision for early fall prediction. They also compute
two thresholds for fall prediction and detection to tune the accuracy. Thome et al. [20]
present a Hierarchical HMM (HHMM) approach for fall detection in video sequences.
The HHMM’s first layer has two states, an upright standing pose and lying. They study
the relationship between angles in the 3D world and their projection onto the image
plane and derive an error angle introduced by the image formation process for a stand-
ing posture. Based on this information, they differentiate other poses as ‘non-standing’
and thus falls can be identified from other motions.
The research works mentioned above assume that sufficient ‘fall’ data is available
for training, which is hard to obtain in practice. Learning with few ‘fall’ samples has the
disadvantage that it can underfit the results and may not produce generalized classifiers
that work across people. To overcome the need for a sufficient set of representative ’fall’
samples while learning, we propose two ‘X-Factor’ HMM based approaches that can
identify falls across different people while learning only on data from normal activities.
3 Proposed Fall Detection Approaches
3.1 Threshold Based Detection – HM M 1out and HM M 2out
The traditional way to detect unseen abnormal activities is to model each normal activity
using an HMM, compare the likelihood of a test sequence with each of the trainedmodels and if it is below a pre-defined threshold then identify it as an anomalous activity
(we call this method as HM M 1out ) [12, 21]. In respect to fall detection, this method
can be described as follows: Each normal activity i is independently modelled by an
ergodic HMM which evolves through a number of k states. The observations oj (t) in
state j are modelled by a single Gaussian distribution. Each model i is described by the
set of parameters, λi = {πi , Ai , (µij , Σij )}, where πi is the prior, Ai is the transition
matrix, and µij and Σij are the mean and covariance matrix, respectively, of a single
Gaussian distribution, N (µij , Σij ), giving the observation probability P (oj |j) for the
j th HMM state. The parameters, λi , of a given HMM are trained by the Baum-Welch
(BW) algorithm [18]. This method estimates the probability that an observed sequence
has been generated by each of the ni models of normal activities. If this probability falls
below a (pre-defined) threshold Ti for each HMM, a fall is detected (HM M 1out ).
Another common method to detect anomalous activities is to model all the normal
activities by a common HMM instead of modelling them separately. The idea is to learn
the ‘normal concept’ from the labelled data itself. The parameters of this combined
HMM are λnormal = {π, A, (µj , Σj )}. This method estimates the probability that the
observed sequence has been generated by this common model and if this probability
falls below a (pre-defined) threshold T , a fall is detected (HM M 2out ) [10].
3.2 Approach I - (XHMM1)
The ‘X-factor’ approach [17] deals with unmodelled variation from the normal events
that may not have been seen previously by inflating the system noise covariance of the
normal dynamics to determine the regions with highest likelihood which are far away
from normality based on which events can be classified as ‘not normal’. We extend this
idea by constructing an alternate HMM to model unseen fall activity, which has the
same number of states as the other ni models for normal activities (each normal activ-
ity is modelled with same number of states). The parameters of this alternate HMM is
obtained by averaging the parameters of ni HMMs and increasing the averaged covari-
ances by a factor of ξ such that each state’s covariance matrix is expanded. Thus, the
parameters of the X-Factor HMM will be λXHM M 1 = {π̄, Ā, µ̄, ξ Σ̄)}, where π̄, Ā, µ̄,
and Σ̄ are the average of the parameters πi , Ai , µi and Σi of each ni HMMs. The value
of ξ is computed using cross validation.
3.3 Approach II - (XHMM2)
Similar to XHM M 1, an alternative HMM is constructed to model the unseen ‘fall’
activities (XHM M 2) whose parameters remain the same as the HMM to model normal
activities (λnormal ) except for the inflated covariance, and is given by, λXHM M 2 =
{π, A, (µj , ξΣj )}. The parameter ξ is computed using cross validation.
4 Threshold Selection and Proxy Outliers
Our goal is to train both the XHMMs and threshold based HMMs using only “normal”
data (activity sequences that are not falls, see Figure 2). Typically, this is done by setting
a threshold on the likelihood of the data given an HMM trained on this “normal” data.
This threshold is normally chosen as the maximum of negative log-likelihood [10], and
can be interpreted as a slider between raising false alarms or risking miss alarms [21].
However, any abnormal sensor reading or mislabelling of training data can alter this
threshold and adversely effect the classification performance.
We propose to use outliers from the “normal” data to set thresholds. The idea is that,
even though the “normal” data may not contain any falls, it will contain sensor readingsthat are spurious, incorrectly labelled or significantly different. These outliers can be
used to set the thresholds that are required for fall detection, thereby serving as a proxy
for the fall data in order to learn the parameters of the (X)HMMs. To find the outliers,
we use the concept of quartiles from descriptive statistics. The quartiles of a ranked set
of data values are the three points that divide the data set into four equal groups, where
each group comprises of a quarter of the data. Given the log-likelihoods of sequences
of training data for a HMM and the lower quartile (Q1 ), the upper quartile (Q3 ) and the
inter-quartile range (IQR = Q3 − Q1 ), a point P is qualified as an outlier if
P > Q3 + w × IQR || P < Q1 − w × IQR (1)
where w represents the percentage of data points that are within the non-extreme limits.
Figure 1 (a) shows the log-likelihood log P (O|λrunning ) for 1262 equal length (1.28s)
running activity sequences. Figure 1 (b) is a box plot showing the quartiles for this
dataset, and the outliers (shown as +) for w = 1.5 (representing 99.3% coverage).
Figure 1 (c) shows the same data as in (a) but with the outliers removed.
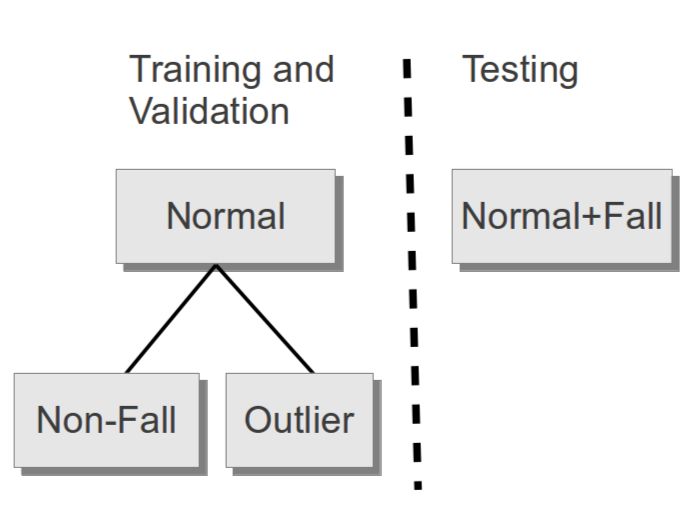
(a) (b) (c) Fig. 2: Cross Validation
Scheme
Fig. 1: Outlier removal using IQR on likelihoods
To train both the XHMMs/HMMs using only normal data, we first split the normal
data into two sets: “non-fall” data and “outlier” data (see Figure 2). We do this using
Equation 1 with a parameter w = wCV that is manually set and only used for this
initial split. We train the HMMs on the “non-fall” data and then set the thresholds (w
(which is defined as Ti for HM M 1out and T for HM M 2out ) and ξ for XHM M 1
and XHM M 2) by evaluating performance on the “outlier” data. We use a 3-fold cross
validation: the HMMs are trained on 2/3rd of the ‘non-fall’ data, and tested on 1/3rd
of the ‘non-fall’ data and on all the “outlier” data. This is repeated for different values
of w and ξ. The value of parameters that give the best averaged gmean (see Table 4)
over 3-folds are chosen as the best parameters. Then, each classifier is re-trained with
these values on ‘non-fall’ activities.
5 Experimental Analysis
5.1 Dataset
The proposed fall detection approaches are evaluated on the following two datasets:
1. German Aerospace Center (DLR) [15]: This dataset is collected using an Inertial
Measurement Unit with integrated accelerometer, gyroscope and 3D magnetometers
with sampling frequency of 100 Hz. The dataset contains samples taken from 19
people under semi-natural conditions. The sensor was placed on the belt either on the
right/left side of the body or in the right pocket in different orientations. The datasetcontains 7 activities: standing, sitting, lying, walking (up/downstairs, horizontal),
running/jogging, jumping and falling.
2. MobiFall [23]: This dataset is collected using a Samsung Galaxy S3 device equipped
with 3D accelerometer and gyroscope. The mobile device was placed in a trouser
pocket in random orientations. Mean sampling of 87Hz is reported for accelerometer
and 200Hz for the gyroscope. The dataset is collected from 11 subjects; eight normal
activities are recorded in this dataset: step-in car, step-out car, jogging, jumping,
sitting, standing, stairs (up and down joined together) and walking. Four different
types of falls are recorded – forward lying, front knees lying, sideward lying and
back sitting chair. Different types of falls are joined together for testing.
5.2 Data Pre-Processing
For the DLR dataset, accelerometer and gyroscope sensor readings are tilt compensated
with the calibration matrix provided with the dataset. For MobiFall dataset, due to the
difference in sampling rates, readings from the gyroscope were not used. Sensor noise
is removed by using a Buttersworth low-pass filter with a cutoff frequency of 20Hz.
The dataset is segmented with 50% overlapping windows, where each window size is
1.28 seconds to simulate a real-time scenario with fast response. To extract temporal
dynamics for the XHHMs and HMMs, each window is sub-divided into 16ms frames
and features are computed for each frame. Each activity in the XHHMs and HMMs is
modelled with 4 states, and 5 representative sequences per activity are manually chosen
to initialize the parameters. Initialization is done by segmenting a single sequence into 4
equal parts and computing µij and Σij for each part and further smoothing by BW with
3 iterations. The transition Matrix Ai is chosen such that transition probabilities from
one state to another are 0.025, self-transitions are set accordingly. Four signals were
extracted from the dataset (see Table 1) and 19 time and frequency-domain features are
computed from them (see Table 2). #featuresType of feature
Name of 3 Mean of anorm , ahoriz , avert
Description 3 Max of absolute values of anorm , ahoriz , avert
Signal
3 Standard Deviation of of anorm , ahoriz , avert
Norm of p anorm =
acceleration x2 + y 2 + z 2 4 IQR of anorm , ahoriz , avert , ωhoriz
Horizontal p 1 Normalized Average PSD of anorm
ahoriz = x2 + y 2 1 Spectral Entropy of anorm [6]
acceleration
Vertical 1 DC component after FFT of anorm [1]
avert = z
acceleration 1 Normalized Information Entropy of the Dis-
Horizontal q crete FFT component magnitudes of anorm [1]
Angular ωhoriz = ωx2 + ωy2 1 Energy i.e. sum of the squared discrete FFT
velocity component magnitudes of anorm [1]
1 Correlation between anorm and avert
Table 1: Different signals extracted
from sensor readings. Table 2: Number of computed features.
To estimate the performance of the proposed approaches for fall detection, we per-
form leave-one-subject-out cross validation (LOOCV) [7], where only normal activities
from (N − 1) subjects are used to train the classifiers and the N th subject’s normal
activities and fall events are used for testing. This process is repeated N times and
the average performance metric is reported. This evaluation is person independent anddemonstrates the generalization capabilities as the subject who is being tested is not
included in training the classifiers. For the DLR dataset, one person did not have falls
data and for the MobiFall dataset, two subjects only performed falls activity; hence
these subjects are removed from the analysis. The different values of w tested for
HM M 1out and HM M 2out are [1.5, 1.7239, 3, ∞] and ξ for XHM M 1, XHM M 2
are [1.5, 5, 10, 100]. The value of wCV for rejecting outliers from the normal activities
is set to 1.5. Table 3 and Table 4 shows the performance metrics used in the paper.
Predicted Labels
Normal Falls Metric Formula
True False Geometric Mean q
TP TN
Actual Normal Positive Negative (gmean) [11] (T P +F N ) ∗ (T N +F P )
Labels (TP) (FN) Fall Detection Rate TN
False True (F DR) T N +F P
Falls Positive Negative False Alarm Rate FN
(FP) (TN) (F AR) (T P +F N )
Table 3: Confusion Matrix Table 4: Performance Metric
DLR MobiFall
Method
gmean F DR F AR gmean F DR F AR
HM M 1f ull 0 0 0.0001 0 0 0
HM M 2f ull 0 0 0.0001 0 0 0.0001
HM M 1out 0.068 0.029 0.008 0.030 0.003 0.022
HM M 2out 0.831 0.859 0.175 0.793 0.755 0.159
XHM M 1 0.883 0.882 0.102 0.413 0.222 0.224
XHM M 2 0.581 0.974 0.640 0.752 0.938 0.390
Table 5: Performance of Fall Detection methods.
5.3 Results
For comparison purpose, we implemented two threshold based HMMs similar to
HM M 1out and HM M 2out with the difference that they are trained on full ‘nor-
mal’ data and the threshold is set as maximum of negative of log-likelihood. We call
them as HM M 1f ull and HM M 2f ull . Table 5 shows the performance of the XHM M
methods along with threshold based HMMs on both the datasets. When the fall data is
not present during the training phase, for the DLR dataset, XHM M 1 has the highest
gmean in comparison to other X-factor and threshold based methods. XHM M 2 has
the highest F DR but at the cost of high F AR. The reason for poor performance of
HM M 1out is that most of the falls are misclassified as jumping/running. For Mobi-
Fall dataset, HM M 2out and XHM M 2 show higher value of gmean in comparison
to other X-factor and threshold based methods, with XHM M 2 having the highest
F DR, whereas XHM M 1 and HM M 1out classify most falls as sitting and step in
car, thus their performance is greatly reduced. We also observe that HM M 1f ull and
HM M 2f ull that are trained on full ‘normal’ data performed worst and are unable to de-
tect falls due to setting of large negative of log-likelohood threshold due to the presence
of outliers in the training data for normal activities.
We also implemented two supervised versions of XHMMs (HM M 1Sup and
HM M 2Sup ): a) when only 1 fall is used (chosen randomly 10 times and average met-ric reported), and b) where all the falls data are used, during the training phase. This
experiment demonstrates a practical scenario when we have very little falls data and
compares it with an optimistic view on collection of data for falls. Table 6 shows that
the supervised versions with very small falls data did not show consistent performance
for both the datasets, however when all the falls data present is used for training, perfor-
mance is improved both in terms of higher gmean and F DR and lower F AR, except
for HM M 1sup where most of the falls are misclassified as sitting or step in/out car. Our
results show that when there is no fall data available during training time, the supervised
methods cannot be used and the performance of these methods is not consistent if very
few training data is available.
DLR MobiFall
#Falls data Method
gmean F DR F AR gmean F DR F AR
HM M 1Sup 0.247 0.172 0.013 0.173 0.067 0.003
1 HM M 2Sup 0.442 0.480 0.326 0.552 0.406 0.038
HM M 1Sup 0.660 0.525 0.022 0.249 0.066 0.005
All HM M 2Sup 0.729 0.709 0.174 0.875 0.837 0.083
Table 6: Supervised Fall Detection.
6 Conclusions
Falling is the most common cause of both fatal and nonfatal injuries among older adults
[3]. Recent advancements in ambient assistive living have led to the development of
several commercial devices (e.g. Philips Lifeline [16]), MobileHelp Fall ButtonTM [14]
etc). However, these products may fail to identify diverse types of falls, can produce
lot of false alarms and require manual intervention. The reason is that the performance
of fall detection algorithms is hampered by the lack of training data for falls because
they occur rarely and infrequently. With little or no training data for falls, supervised
classification algorithms may underperform as they may either underfit or not-model
falls correctly. In this paper, we presented two ‘X-factor’ HMM based fall detection
approaches that learn only from the normal activities captured from a body-worn sensor.
To tackle the issue of no training data for falls, we introduced a new cross-validation
method based on the IQR of log-likelihoods that rejects spurious data from normal
activities to help in optimizing the model parameters. The XHMM methods show high
detection rates for fall. We also showed that the traditional method of thresholding with
HMMs trained on full normal data to identify falls is ill-posed for this problem.
References
1. Bao, L., Intille, S.S.: Activity recognition from user-annotated acceleration data. In: Ferscha,
A., Mattern, F. (eds.) Pervasive. Lecture Notes in Computer Science, vol. 3001, pp. 1–17.
Springer (2004)
2. Bourke, A., Lyons, G.: A threshold-based fall-detection algorithm using a bi-axial gyroscope
sensor. Medical Engineering and Physics 30(1), 84 – 90 (2008)
3. CDC: Falls in nursing homes. http://www.cdc.gov/
HomeandRecreationalSafety/Falls/nursing.html (2014), accessed on
19th January 2014
4. Cheng, H., Haiyong, L., Zhao, F.: A fall detection algorithm based on pattern recognition and
human posture analysis. In: IET International Conference on Communication Technology
and Application. pp. 853–857 (2011)5. Dai, J., Bai, X., Yang, Z., Shen, Z., Xuan, D.: Perfalld: A pervasive fall detection system
using mobile phones. In: Pervasive Computing and Communications Workshops. pp. 292–
297. IEEE (2010)
6. Ermes, M., Parkka, J., Cluitmans, L.: Advancing from offline to online activity recognition
with wearable sensors. In: 2008. 30th Annual International Conference EMBS. pp. 4451–
4454 (2008)
7. He, Z., Jin, L.: Activity recognition from acceleration data based on discrete consine trans-
form and svm. In: SMC. pp. 5041–5044. IEEE (2009)
8. Honda, D., Sakata, N., Nishida, S.: Activity recognition for risk management with installed
sensor in smart and cell phone. In: HCI (3). pp. 230–239 (2011)
9. Igual, R., Medrano, C., Plaza, I.: Challenges, issues and trends in fall detection systems.
BioMedical Engineering OnLine 12(1), 1–24 (2013)
10. Khan, S.S., Karg, M.E., Hoey, J., Kulic, D.: Towards the detection of unusual temporal events
during activities using hmms. In: SAGAWARE - Proceedings of the 2012 ACM Conference
on Ubiquitous Computing. pp. 1075–1084. UbiComp ’12, ACM (2012)
11. Kubat, M., Matwin, S.: Addressing the curse of imbalanced training sets: one-sided selection.
In: ICML. vol. 97, pp. 179–186 (1997)
12. Lühr, S., Venkatesh, S., West, G.A.W., Bui, H.H.: Explicit state duration hmm for abnor-
mality detection in sequences of human activity. In: Zhang, C., Guesgen, H.W., Yeap, W.K.
(eds.) PRICAI. Lecture Notes in Computer Science, vol. 3157, pp. 983–984. Springer (2004)
13. Luo, X., Liu, T., Liu, J., Guo, X., Wang, G.: Design and implementation of a distributed fall
detection system based on wireless sensor networks. EURASIP Journal on Wireless Com-
munications and Networking 2012, 1–13 (2012)
14. MobileHelp: Fall button. http://www.mobilehelpnow.com/products.php
(2014), accessed on 12th September 2014
15. Nadales, M.J.V.: Recognition of Human Motion Related Activities from Sensors. Master’s
thesis, University of Malaga and German Aerospace Cener (2010)
16. Philips: Lifeline. http://www.lifelinesys.com/content/
lifeline-products/auto-alert (2014), accessed on 12th September 2014
17. Quinn, J.A., Williams, C.K., McIntosh, N.: Factorial switching linear dynamical systems
applied to physiological condition monitoring. IEEE Transactions on PAMI 31(9), 1537–
1551 (2009)
18. Rabiner, L.: A tutorial on hidden markov models and selected applications in speech recog-
nition. Proceedings of the IEEE 77(2), 257–286 (1989)
19. Shi, G., Zou, Y., Jin, Y., Cui, X., Li, W.J.: Towards hmm based human motion recognition
using mems inertial sensors. In: ROBIO. pp. 1762–1766. IEEE (2008)
20. Thome, N., Miguet, S.: A hhmm-based approach for robust fall detection. In: ICARCV. pp.
1–8. IEEE (2006)
21. Tokumitsu, M., Murakami, M., Ishida, Y.: An adaptive sensor network for home intrusion
detection by human activity profiling. Artificial Life and Robotics 16(1), 36–39 (Jun 2011)
22. Tong, L., Song, Q., Ge, Y., Liu, M.: Hmm-based human fall detection and prediction method
using tri-axial accelerometer. Sensors Journal, IEEE 13(5), 1849–1856 (2013)
23. Vavoulas, G., Pediaditis, M., Spanakis, E., Tsiknakis, M.: The mobifall dataset: An initial
evaluation of fall detection algorithms using smartphones. In: Bioinformatics and Bioengi-
neering (BIBE), 2013 IEEE 13th International Conference on. pp. 1–4 (Nov 2013)
24. Yu, M., Naqvi, S., Rhuma, A., Chambers, J.: Fall detection in a smart room by using a fuzzy
one class support vector machine and imperfect training data. In: ICASSP. pp. 1833–1836
(2011)
25. Zhang, T., Wang, J., Xu, L., Liu, P.: Fall detection by wearable sensor and one-class svm
algorithm. In: Intelligent Computing in Signal Processing and Pattern Recognition, vol. 345,
pp. 858–863. Springer Berlin Heidelberg (2006)You can also read