Visitor Demand Mapping - for Queenstown Update 7 Published on Wednesday, November 4, 2020
←
→
Page content transcription
If your browser does not render page correctly, please read the page content below

Visitor Demand Mapping
 for Queenstown                   Update 7

 Published on Wednesday, November 4, 2020

                                             1 | Visitor Demand Mapping for Queenstown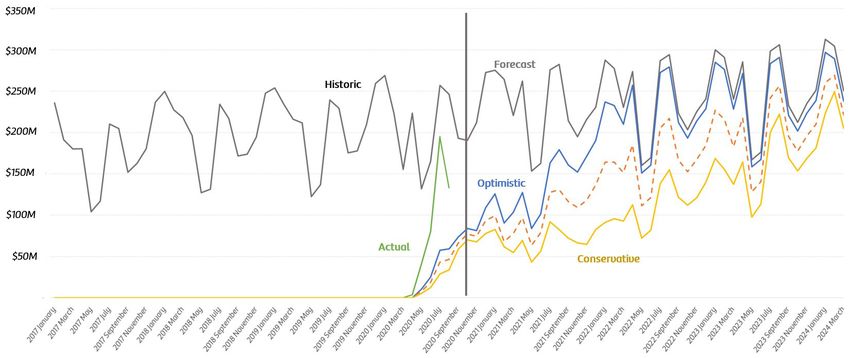
This is an update to the Visitor Demand Mapping for Queenstown-Lakes (2020 to 2024) report
    published on Thursday, May 14, 2020. You can get the full version of the earlier report here.

    We ask you to please take this short 5 question survey that will help us gauge how you are using
    these reports and welcome any feedback on topics that you feel would be useful in including and
    tracking in future reports. For further feedback, more information or clarifications about the
    content below please contact kirann@queenstownnz.nz.

    Recent developments to factors
     that impact visitation to Queenstown
    New Zealand Economy
    In the International Monetary Fund’s latest update of their World Economic Outlook, New Zealand’s GDP
    projections has been revised upwards for a -6.1% drop in 2020 up 1.1% from April projections and a 4.4%
    increase in 2021 down 1.5% from April3.

    Following the containment of the Auckland cluster it seems that New Zealand has returned toward positive
    sentiments with the majority of indexes and high frequency indicators now sitting in positive territory1. Mobility
    reports from Google indicate that people movements have returned to levels in January and other indicators like
    traffic movements, grid demand and the manufacturing index were all up on 2019 September levels. The New
    Zealand Activity Index (NZAC) shows a recovery in September, with activity up 1.0% on September 2019.

    On the employment front the number of people receiving income support has declined from August levels to a
    total of 212,500 recipients and a total of 7,266 jobs were added in September to make a total of 2.2 million jobs
    nationwide2. However, the number of people receiving income support is still far higher than last year. Also there
    was a tightening on the criteria for the Covid Income Relief payment which disqualified some people for this
    payment and the jobs created for the election administration may have artificially inflated the employment figures.

    Business confidence is trending upward with a 13 point rise in for the October period largely driven by the goods
    producing sector. Investment intentions remain subdued but overall the general trend is improving. Consumer/
    card spending recovered following a dip in spending due to the Auckland Lockdown to previous COVID Alert
    Level 1 levels. City centres have finally caught up to regional areas in the return to spending levels as well.

    Another positive factor impacting the New Zealand economy is a rise in dairy prices at the GlobalDairyTrade
    auction, the third rise in as many auctions which has resulted in a move up for the FGMP. This is driven by
    increased demand from China holding prices up.
.
    Australia Economy
                                                                                                                            2 | Visitor Demand Mapping for Queenstown

    As Australia appears to be getting its most recent Victoria outbreak under control state border restrictions are
    easing and a return to the new normal is underway. It appears appetite to spend is present with September retail
    sales 4.6% higher than September 2019 and the September quarter overall was up 6.8% compared to the 2019
    September quarter2. Consumer confidence has improved 11.9% in October which is their highest levels since July
    2018. Despite most data sets being positive and tending toward growth, unemployment figures rose likely due to
    the changes to the JobKeeper subsidy which resulted in a wave of layoffs.

    The IMF’s latest update saw Australia’s GDP projections revised upward from -6.7% growth to -4.2% for 2020 and
    down for 2021 from a 6.1% to 3.0% growth3. It’s likely that with the easing of restriction in Victoria Australia will
    see a strong December Quarter across most indicators.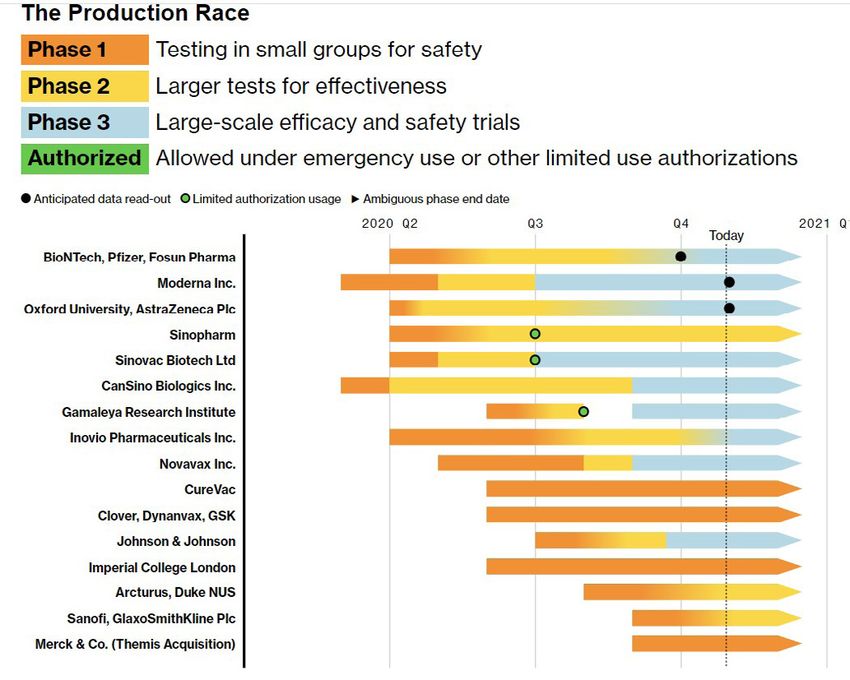
USA Economy
All eyes are on the USA as they make their way through a turbulent time, the USA election takes place on 3
November not long after the country has moved past the 9 million covid case mark. As cases continue to climb,
new daily case records are set, and with uncertainty around the election result the stock markets are sliding and
have just wrapped up their worst months performance since the March when the first market slide due to covid
happened4. The IMF revised their projection down for 2020 to -5.9% from -4.3% and down again for 2021 for
4.7% to 3.1%.

Despite the turbulence the USA actually had a relatively strong September quarter recording a 7.4% GDP growth
on its previous quarter when they recorded a 9.0% decline. It’s likely this will not continue as experts contributed
a lot of this growth to private consumption aided by government stimulus and economic indicators are expected
to stall. Employment figures show that the market is now stagnant following a surge of rehires after the April/ May
layoffs (exhibit 1)

China Economy
In contrast to the increasingly declining situation in the USA China’s economy continues shift toward recovery.
According to the National Bureau of Statistics of China, the country’s GDP grew by 4.9 percent year-on-year in
the three months ended September 30, up from 3.2% growth in the second quarter5. This is almost back up to
China’s pre Covid growth rate of 6.0% (exhibit 2). Other economic indicators from China show more mixed results
with small businesses losing confidence and property markets weakening so it would appear even the second
largest economy in the world which is practically covid free can’t shake the underlying fear of a resurgence in
global covid cases and its knock on effects to the macro economy2.

Global Economy
In the International Monetary Fund’s latest update to their World Economic Outlook titled “A Long and Difficult
Ascent” the I.M.F.’s chief economist warned that “the ascent out of this calamity is likely to be long, uneven,
and highly uncertain”3. There are definitely signs of recovery in places like China but it’s still the world’s worst
economic downturn since the Great Depression.

In line with all this uncertainty around the time frame and direction of a recovery, the IMF has revised their
projections. For the 2020 period they are expecting to see a 4.4% decline globally which is better than their April
projection mostly due to the easing of lockdowns and robust financial and monetary policy support. In 2021 they
are expecting a 5.2% increase stabilitising at 3.5% growth over the next several years. Compared to their pre-
covid figures they are estimating that covid will cost the global economy around $28 trillion in total output by
2025.

Global Aviation
Recovery continues to be a long way off for the aviation industry. Its estimated that the industry globally will burn
through NZ $115 bln during the second half of 2020 and then in 2021 burn cash at approximately NZ $8 bln per
month6. On the back of surging COVID-19 cases across the majority of the world IATA have downgraded their
outlook for global air travel7. The pace of recovery slowed significantly in August due to the continued weakness
                                                                                                                        3 | Visitor Demand Mapping for Queenstown

in international markets and have slowed further growth due to more COVID-19 cases in September and October
(exhibit 3). Domestic travel is continuing to recover in countries that have covid under control, but this won’t
serve as viable substitute long term (exhibit 4). Bookings data is pointing to a weak fourth quarter with forward
bookings down a further 8% compared to the third quarter which will create further issues for the survival of the
aviation industry (exhibit 5).

The pressure of these factors is being felt at an operational level – Airbus COO has said that they are planning on
a minimum of 15,000 job cuts due to the impacts of the pandemic on the aviation industry although interestingly
Airbus’s order book is still largely intact with few cancellations8. Boeing released their forecasts predicting
that they will be down $8.7 bln compared to 2019 but long term in the next ten years they are only expecting
projected demand to be down 11% compared to the same projections made in 20199. Air Asia has pulled out
of Japan effective immediately in steps to preserve cash and reduce cash burn and are evaluating operations in
India. It seems that low budget airlines are more acutely feeling the pressures currently but without intervention
and formalized policy it seems few will survive in the industry.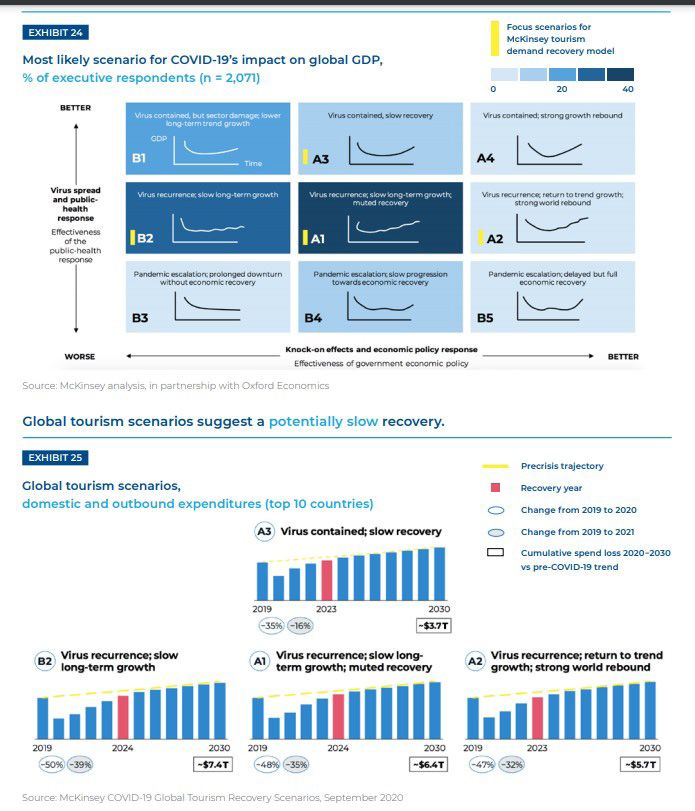
Encouragingly United Airlines will started a pilot rapid testing program mid-November on their flights between
London and New Jersey in an effort to ease strict quarantine rules and reduce passenger concerns in an effort to
get people travelling again10. United will offer the Abbott Laboratories ID Now rapid molecular tests free which
give test results in under 20 minutes. United has actually already started using this test for passengers flying from
mainland USA to Hawaii for a $250 USD cost and a negative result means flyers can skip the two week isolation.

Trans-Tasman Aviation
With the announcement and introduction of the quarantine free one way trans-Tasman bubble, Air New Zealand,
Qantas, Qatar and Jetstar have resumed flights between Auckland and Sydney and Christchurch and Sydney
effective 15 October 202011. Air New Zealand is aiming for six quarantine free flights a week between the
destinations and has just restarted domestic routes within Australia providing passengers meet a strict set of
conditions.

Auckland International Airport is currently trialing COVID testing technology such as thermal-imaging cameras to
detect travelers with fevers, ultraviolet light technology and antimicrobial shields to sterilise high touch areas12.

Domestic Aviation
Air New Zealand ramped up their domestic capacity during the September school holidays to almost 90% of its
pre-COVID domestic capacity levels and added a 1000 extra one-way flights compared to the July holidays.

Auckland International Airport has put their underlying earnings guidance for FY 2021 on hold until 2021 as the
company navigates “the toughest year in the company’s 54-year history” according to Chair Patrick Strange12.
They believe a full recovery will take longer than three years but are optimistic that domestic capacity will return
to normal within two years.

Queenstown Aviation
During the September School Holiday period Air New Zealand’s Queenstown overall capacity operated at 125%
compared to the same school holiday period in 2019.

Queenstown District Lakes Council has supported Queenstown Airport’s promise to not increase the number
of aircraft into Queenstown or develop Wanaka Airport until July 202313. Also acknowledged was the CIAL’s
acquisition in Tarras but for the period covered by the Statement of Intent (until July 2023) it would not have an
impact but will be considered in long term planning.

Epidemiology
The Federal Drug Administration has officially approved the first treatment for COVID-19 patients for the antiviral
drug Veklury (remdesivir) in humans older than 12 years of age. Regeneron (the antibody cocktail taken by Trump)
is showing promising signs as well and the generic steroid drug dexamethasone has had approval as well14.

The vaccine race has had a couple of set backs with two key trials having to be paused due to safety concerns but
these have both resumed now and there are 8 in stage three development which is large-scale efficacy and safety
                                                                                                                        4 | Visitor Demand Mapping for Queenstown

trials (exhibit 6)15 There is a total of 45 vaccines in clinical evaluation globally with a further 156 candidates in
preclinical evaluation.

The testing options are expanding as well with new options being added to test communities and individuals.
Some include testing sewage (indications of COVID 19 are present in the stool before symptoms) and other urine
tests. Binax NOW has a $5 disposable oral swab test that has results in under 5 minutes16.

Domestic Market
Since update 6 there have been a few significant changes in the New Zealand tourism market with an
overwhelming feeling that Kiwis are out and about supporting the tourism industry, but it won’t make up for
the gap left by international tourism. Tourism New Zealand’s updated scenario modeling indicated that kiwis
travelling around in January 2021 may spend up to 18% more than the same period last year indicating that
appetite for domestic tourism is expected to continue for the foreseeable future17. Research completed by
Tourism New Zealand showed that 71% of kiwis are looking to take holidays in New Zealand with the next 12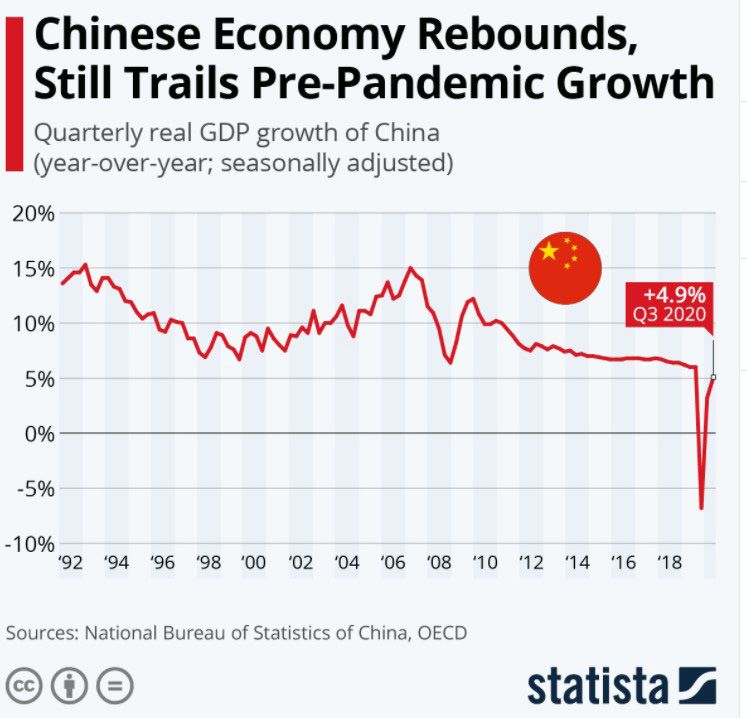
months which was up from 64% recorded in the same sentiment and perception research completed in May18.

The domestic tourism movements recorded by Date Ventures during the September school holiday period were
strong, although 20,000 fewer Kiwis were recorded as being outside of their home region compared to the July
holidays19. Encouragingly Queenstown had 2,500 more domestic tourist over the holiday compared to same
period last year, up 27.3% which was the second highest increase after the Kaikoura region (exhibit). Labour
Weekend also would have provided an extra boost of domestic visitation.

Of course, the other development that will impact domestic tourism further in the future is the opening of the one
way quarantine free trans-Tasman bubble which was announced 2 October 2020 and came into effect 16 October
2020. This hasn’t had a major impact on domestic tourism as quarantine is still a requirement for coming back into
New Zealand and the majority of Kiwis booked on the quarantine free flights are one way tickets so there is no
real “holiday makers” going over to Australia yet20.

Australia Market
With Australia recording its first day with no community transmission on the 1 September since 9 July and Victoria
having recorded several days with zero cases the focus on the two way quarantine free trans-Tasman bubble
has returned20. Rumours are again flying with Australian media reporting that the bubble will be open prior to
Christmas but it has been confirmed that a date has not been set and will only be set when a range of health and
border requirements are met to allow safe travel21.

The Australian Tourism Industry taskforce has set out a set of dates including all interstate borders being
removed by 1 December 2020 and Australians being able to travel to New Zealand around the first quarter of
2021. Currently the only state with a strict entry is Western Australia. South Australia, Tasmania, New South Wales,
ACT and Queensland all have partial restrictions in place and mandatory quarantine for international, Victorian
and sometime Sydney based travelers. The Northern Territories is the only state that is “open” with supervised
isolation for travelers from Victoria but that’s expected to be lifted shortly.

Tourism New Zealand’s latest Scenarios highlights the potential gains for having an Australian/New Zealand
bubble running estimating that if the bubble is in place by January 2021 Australian visitors could grow the visitor
economy to $1 by September 2021. The Australian tourism industry will be vying to keep Aussies at home as well
with Tourism Research Australia estimating that the industry has seen an approximate $33.7 bln lost between
January to July 2020 with the majority ($21.7 bln) being lost from domestic tourism22. The Australian Government
has pledged $231 mln to Tourism Australia to “ramp up” domestic marketing as well as “aggressively execute”
new campaigns to attract international tourist when possible23.

Asian Markets
Life continues to return to the new normal in the Asian regions- China hasn’t recorded a community case since 15
August 2020 and Taiwan hasn’t had a community case in over 200 days!

The start of October saw millions of travelers hit the road in China as they began their extralong Golden week
national holiday period. An estimated 425 million trips were taken over Golden week, nearly 80% of the same
period last year’s 600 million trips24. Hotels were booked out, flight bookings were up 11% on last year, tickets
to major attractions sold out in minutes and ride share apps crashed. Impacts of Covid-19 linger on with spend
                                                                                                                       5 | Visitor Demand Mapping for Queenstown

down around 31% and people still nervous to travel.

Singapore will lift its border restrictions from mainland China on 6 November and quarantine free travel has
already been in place between Hong Kong and Singapore25.

European Markets
In stark contrast to our domestic, Australian and Asian markets, Europe is now reentering lockdowns with
restriction on travel, gathering sizes and cross border movements coming back into place26. England is shutting
down pubs, restaurants and most retail but leaving schools open starting 2 December and the rest of the UK has
already started stricter lock downs. France, Germany, Belgium, Greece and Austria are also already in lockdowns
in an effort to curb the resurgence.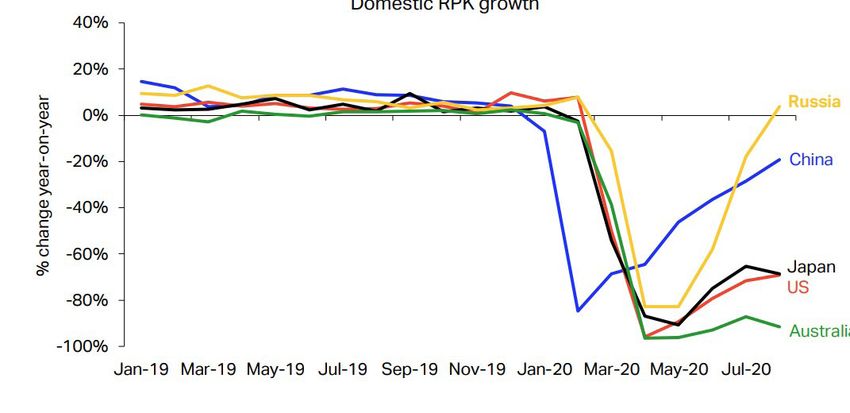
Global Markets
As time goes on the impact of border closures is becoming clearer. The UNWTO is estimating that international
tourism arrivals are down 70% in the first 8 months of 2020 – more than 8 times the loss experienced due to the
Global Financial Crisis27. The UNWTO is expecting to see a rebound in international travel by Quarter 3 2021
though some warn it won’t be until 2022 and are predicting a return to pre covid levels by late 2023 (exhibit).

A report by Skift and McKinsey align with this and aren’t expecting pre covid level spend until well into 202328.
They went on to explain that recovery will look different depending on the country/ geography, macro economic,
social and public health factors and they highlighted there will be countries with strengths in these areas (like
New Zealand) that will enable a faster recovery of the tourism industry.

                                                                                                                    6 | Visitor Demand Mapping for Queenstown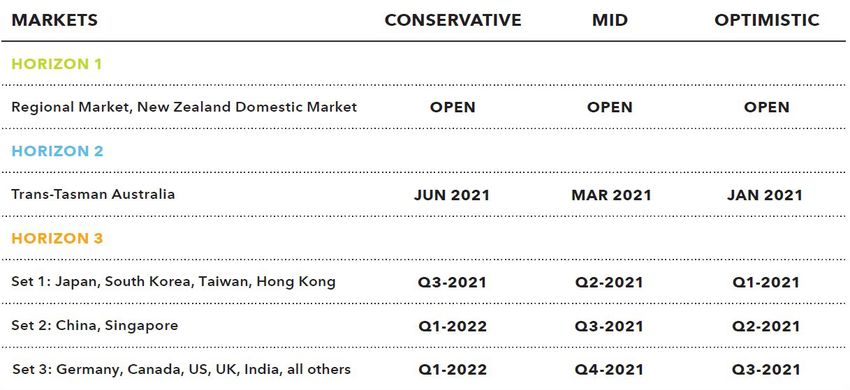
Updates in Destination Queenstown
 Assumptions
Scenario Updates
Several sources have been checked and compared to develop the below timeline expectations. This update we
have compared the time frame with Tourism New Zealand’s October Scenario Models and McKinsey’s Tourism
Restart modelling and kept our projections for timelines the same as the last update.

Scenarios
Queenstown – All markets

                                                                                                            7 | Visitor Demand Mapping for Queenstown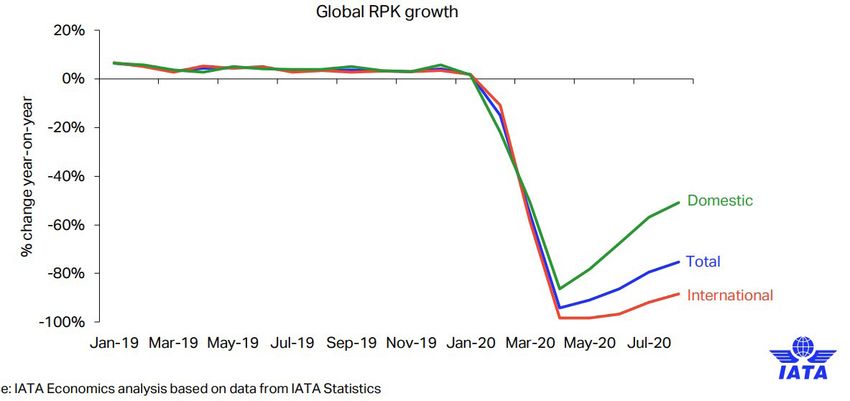
Queenstown – All Markets Optimistic Scenario

Queenstown – All Markets Conservative Scenario

For further reading and reference please find the link to Tourism New Zealand’s
Scenario Modelling last updated 13 October 2020 HERE and the link to the
Tourism Export Councils Modelling last updated 8 September HERE.
                                                                                  8 | Visitor Demand Mapping for Queenstown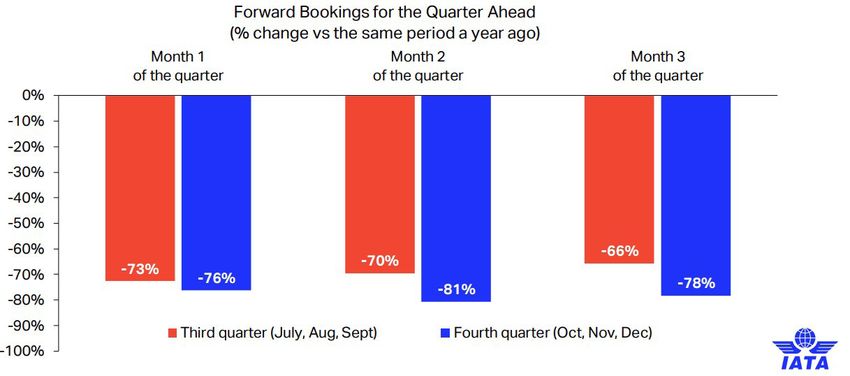
Percentage of Market Spend Recovery Compared to MBIE 2019 – 2024 Forecasts (Monthly, Queenstown
Region)

                                                                                                  9 | Visitor Demand Mapping for Queenstown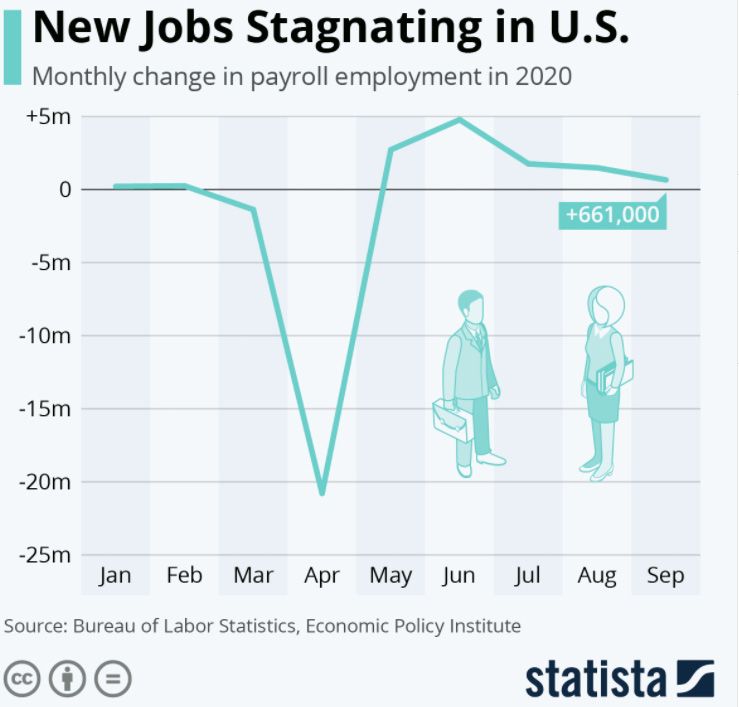
Exhibits
Exhibit 1.
Statista: New jobs stagnating in te US. Published 15 October 2020.

Exhibit 2.
Statista: Chinese Economy Rebounds, Still Trails Pre-Pandemic Growth. Published 19 October 2020.

Exhibit 3.
IATA: COVID-19 Downgrade for global air travel outlook. Published 29 September 2020.
                                                                                                   10 | Visitor Demand Mapping for Queenstown
Exhibit 4. IATA: COVID-19 Downgrade for global air travel outlook. Published 29 September 2020. Exhibit 5. IATA: COVID-19 Downgrade for global air travel outlook. Published 29 September 2020. Exhibit 6. Bloomberg: Vaccine Trials Restart, Providing Hope as Virus Spreads. Updated 3 November 2020 11 | Visitor Demand Mapping for Queenstown
Exhibit 7.
Data Ventures & Tourism New Zealand. School Holidays Domestic Tourism Report. Published 12 October
2020

Exhibit 8.
McKinsey: The Travel Industry Turned Upside Down. Published September 2020.

                                                                                                     12 | Visitor Demand Mapping for Queenstown
Exhibit 9.
McKinsey: The Travel Industry Turned Upside Down. Published September 2020.
Exhibit 10.
Tourism New Zealand: Tourism Scenario Modelling. Published 13 October 2020.
13 | Visitor Demand Mapping for QueenstownExhibit 11.
Covid-19 WHO bell curves (Current as of 3 November 2020)
(World Health Organisation: WHO Coronavirus Disease (COVID-19) Dashboard. Link
Global
New Zealand
Australia
United States
China
14 | Visitor Demand Mapping for Queenstown
United KingdomIndia
Japan
Germany
Singapore
South Korea
15 | Visitor Demand Mapping for QueenstownSources and
References
1 The New Zealand Treasury: Weekly Economic Update. Released 30, October 2020 (link)
2 The New Zealand Treasury: Weekly Economic Update. Released 23, October 2020 (link)
3 The International Monetary Fund: World Economic Outlook, October 2020: A Long and Difficult Ascent. Published
October 2020. (link)
4 The Wall Street Journal: Dow Wraps Up Worst Month Since March. Published 30 October 2020. (link)
5 Statista: Chinese Economy Rebounds, Still Trails Pre-Pandemic Growth. Published 19 October 2020. (link)
6 Interest.co.nz: Dairy prices rise; US retail sales flat; US job openings fall; US trade deficit rises; Australia get big
spending Budget; airlines bleed; UST 10y at 0.77%; oil up and gold down; NZ$1 = 66.4 USc; TWI-5 = 69.6. Published
7 October 2020. (link)
7 IATA: COVID-19 Downgrade for global air travel outlook. Published 29 September 2020. (link)
8 Bloomberg: Airbus COO Expects Minimum of 15,000 Job Cuts, Handelsblatt Says. Published 4 October 2020. (link)
9 Boeing: Boeing Forecasts Challenging Near-Term Aerospace Market with Resilience in Long Term. Published 6
October 2020. (link)
10 Bloomberg: United Plans Newark-London Virus Testing as Tool to Spur Travel. Published 30 October 2020. (link)
11 Stuff: Trans-Tasman bubble: Australia releases new rules for Kiwi travellers. Published 15 October 2020
12 New Zealand Herald: Auckland Airport says international aviation recovery could be more than three years away,
systems needed to live with Covid-19. Published 22 October. (link)
13 Radio New Zealand: Councillors support move to put Queenstown and Wānaka airport plans on hold. 29 October
2020. (link)
14 The Lancet: Dexamethasone and remdesivir: finding method in the COVID-19 madness. Published 23 October
2020. (link)
16 | Visitor Demand Mapping for Queenstown
15 World Health Organisation: Draft landscape of COVID-19 candidate vaccines. Published 29 October 2020. (link)
16 Bloomberg: U.S. Buys Almost All Abbott’s $5 Rapid Tests Made This Year. Published 28 August 2020. (link)
17 Tourism New Zealand: Data shows Kiwis supporting tourism sector recovery. Published 21 October 2020. (link)
18 Tourism New Zealand: Domestic Audience sentiment. Published 21 October 2020. (link)
19 Data Ventures & Tourism New Zealand. School Holidays Domestic Tourism Report. Published 12 October 2020
20 The Guardian: Donut Day: Australia Records first day of zero cases of community Covid transmissions. Published 1
November 2020. (link)
21 News Talk ZB: NZ-Australia bubble - claims transtasman travel to resume before Christmas. Published 31 October
2020. (link)22 Travel Weekly: THE FINANCIAL IMPLICATIONS OF THE CORONAVIRUS PANDEMIC ON AUSTRALIA’S TOURISM
INDUSTRY DURING THE FIRST HALF OF 2020 HAVE BEEN REVEALED. Published 6 October 2020. (link)
23 The PIE News. Aus gov allocates $231m to domestic tourism. Published 6 October 2020. (link)
24 Bloomberg: Half a Billion Trips Show China’s Economy Moving Past Covid. Published 6 October 2020. (link)
25 Bloomberg: Singapore to Drop Quarantine for Visitors From China, Australia’s Victoria. Published 29 October 2020.
(link)
26 The New York Times: England to Shut Pubs, Restaurants and Most Shops as Virus Surges. Published 31 October
2020. (link)
27 UNWTO: INTERNATIONAL TOURISM DOWN 70% AS TRAVEL RESTRICTIONS IMPACT ALL REGIONS. Published 27
October 2020. (link)
28 McKinsey: The Travel Industry Turned Upside Down. Published September 2020. (link)
17 | Visitor Demand Mapping for QueenstownYou can also read