Standard Life Private Equity Trust plc (SLPET) - Aberdeen Standard Investments
←
→
Page content transcription
If your browser does not render page correctly, please read the page content below

‘Title slide + image’
slide layout
     January 2020

     Standard Life Private
     Equity Trust plc (SLPET)

     Analyst & Shareholder presentation

  This presentation is for one-on-one use with institutional investors and professional investors only and should not be distributed to or relied upon by retail clients.
1. Executive Summary

1
Standard Life Private Equity Trust plc

                                                •      A portfolio of high-conviction private equity managers, built from years of strong
          High                                         relationships and independent research
        Conviction
                                                •      Over 60% of Net Asset Value (‘NAV’) to 14 core private equity managers1

                                                •      European mid-market focus, but with increasing international diversification

       Disciplined                              •      Active management with an over-commitment strategy, utilising co-investments
                                                       and the secondary market

                                                •      Current dividend yield of 3.6%2
          Cash                                  •      £67.7m liquid resources3 + £100m unutilised credit facility
        Generative
                                                •      Unique flat fee of 0.95% on NAV

                                                •      Deliver strong, long-term total returns for shareholders through capital gain and

      Performance                                      dividend yield
                                                •      Share price outperformed public equity markets over 1, 3, 5 and 10 years4

Notes: 1. As at 30 September 2019, Aberdeen Standard Investments. 2. Based on proposed full year dividend to 30 September 2019 and 30 September 2019 share price. 3. Includes cash and other liquid assets available for
investment. 4. Public equity markets indices refer to FTSE All Share (£), source: Thomson Reuters.

 2                                                                       Past performance is no guide to future returns
2. Manager Overview
ASI Private Markets
Significant global presence offering extensive access to private markets opportunities
                                          We have +400 professionals across 21 locations managing £64 billion across private markets.
                    This allows us to source opportunities for clients on a global scale and makes us one of the top ten private markets managers worldwide.1

                                                                                                        Olso        Helsinki
                                                                                                                Stockholm
                                                                                         Edinburgh             Copenhagen
                                                                                             London         Amsterdam
                                                                                                Paris          Frankfurt
                                                                   Boston
                                                  New York        Stamford                   Madrid     Brussels                 Seoul       Tokyo

                                                              Havana
                                                                                                                                 Hong Kong

                                                                  Bogota
                                                                                                                               Singapore

          Private Equity
          Infrastructure

          Real Estate

         Private Credit
                                                                                                                                                Sydney
         Natural Resources

Source: Aberdeen Standard Investments, as at 30 September 2019. 1: Willis Towers Watson Global Alternatives Survey 2017

  4
Private equity capabilities
Experienced team providing access to best performance areas of private equity

                             Leveraging our large and connected team, networks and research capabilities

                   AUM:                                     Professionals:                           Fund commitments:   SLPET Manager:
            > £12bn                                                  41                                 1,000+           > 18 years

                                       Capabilities: Ranging from early stage venture through growth and buy out capital

                                        Office locations

                                                                                     Edinburgh
                                                                                        London

                                                            Boston                    Stamford

                                                                                      New York

As at 30 September 2019 Source: Aberdeen Standard Investments. AUM is calculated as NAV + Unfunded

 5
SLPET Team and Senior Investment Resource
                  SLPET investment team and senior management team with an average industry experience of 20 years

                                                                                  SLPET Team

              Alan Gauld,                             Patrick Knechtli,               Mark Nicolson,                              Simon Tyszko,                      Ramone Moody,
              Investment Director                     Head of Secondaries             Head of Primaries                           Investment Manager                 Investment Analyst
              Edinburgh                               Edinburgh                       Edinburgh                                   Edinburgh                          Edinburgh

                                                                            Senior Private Equity Team

                        Merrick McKay, Head of Private Equity Europe               Kevin Carey, Senior Investment Director                    Mark Nicolson, Head of Primaries
                        Edinburgh/London                                           London                                                     Edinburgh
 Europe

                        Colin Burrow, Head of Co-investments                       Guy Eastman, Senior Investment Director                    Alistair Watson, Senior Investment Director
                        Edinburgh                                                  London                                                     Edinburgh

                        Patrick Knechtli, Head of Secondaries                      Cameron Graham, Senior Investment Director                 Sarah Farrell, Senior Investment Director
                        Edinburgh                                                  Edinburgh                                                  London
 USA

                         Scott Reed, Co-Head of Private Equity USA                 John Dickie, Co-Head of Private Equity USA                 Eric Albertson, Senior Investment Director
                         Boston                                                    Boston                                                     Boston

                                       Wider Investment Team                                                                 SLPET Governance
                 •    Global primary, secondaries and co-investment teams                                          •   Quarterly SLPET Board Meetings
                 •    Provides broad market coverage and sourcing capability                                       •   SLPET Portfolio Management Committee
                 •    Supported by Private Markets legal and back office teams                                     •   European Investment Committee process
                 •    In-house Listed Private Equity expertise                                                     •   Pipeline review and cash flow monitoring

Source: Aberdeen Standard Investments, as at 30 June 2019.

  6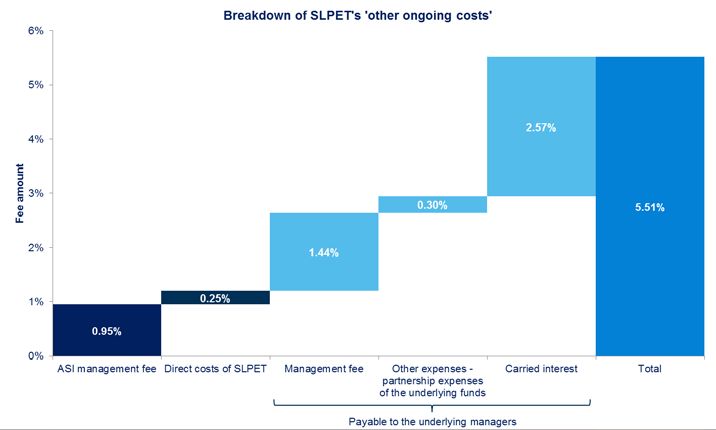
3. Why SLPET?
A differentiated offering
• A carefully selected range of private equity managers, built from                                                       • Consistent track record of selecting top performing managers
  years of established relationships and proprietary research                                                               and funds
• One of the most concentrated listed private equity offerings, with                                                      • 75% / 66% of our investments fall within top or second
  SLPET’s top 10 fund investments representing over 50% of                                                                  quartile from a TVPI2 and IRR perspective, respectively3
  portfolio NAV1

                                                                      Over 60% portfolio NAV to
                                                                        14 core managers…                                                       … which has led to superior returns

                                                                                                                                                       10%                                              13%
                                                                                                                                                       15%
                                                                                                                                                                                                        21%
                                                                                                                          70%

                                                                                                                          50%
                                                                                                                                                       42%
                                                                                                                                                                                                        35%

                                                                                                                                                       33%                                              31%

                                                                                                                                                      TVPI                                              IRR
                                                                                                                                                     Top           Second              Third           Fourth

Source: 1. Aberdeen Standard Investments, 53.9% portfolio NAV at 30 September 2019; excludes offerings which invest exclusively in affiliate or “in-house” funds 2. TVPI defined as Total value over paid in capital, representing
           the return multiple of capital invested, net of management fees and carried interest; IRR defined as Internal rate of return 3. Source: Burgiss, data from 2007 – 2017 as at 30 June 2019. © owned by each of the
           corporate entities named in the respective logos
   8
Core European mid-market focus
• We are committed to our European mid-market focus, with an • Highly selective exposure to differentiated US mid-market
attractive mix of pan-European and regional managers managers
• We selectively continue to evaluate top performing, hard-to-access
opportunities in the European lower mid-market and large cap /
global managers
Over 80% portfolio NAV to … with selective non-European exposure
European managers… that leverages ASI’s global platform
Large cap / global
US mid–market
Europe
US
US lower mid–market
Global
Notes: Figures at 30 September 2019. © owned by each of the corporate entities named in the respective logos. Companies selected for illustrative purposes only
to demonstrate Aberdeen Standard Investments’ investment management style and not as an indication of performance
9Leveraging the ASI private equity platform
Knowledge sharing is key to the platform
Secondary
• High quality deal flow
Idea Knowledge
Generation • Network Sharing
• GP relationships
• Manager selection
• Direct experience
• Active investor
Primary Co-investments
Reinforcing
Relationships
10Targeted deployment backing leading private equity managers
SLPET’s recent commitments demonstrate our selective
focus to the best performing managers…
2015 2016 2017 2018 2019
Secondary sale of
selected fund interests
… and active use of the secondary and co-investment market to
assist portfolio construction and cash utilisation
Notes: © owned by each of the corporate entities named in the respective logos. Companies selected for illustrative purposes only to demonstrate Aberdeen Standard Investments’ investment management style and not as an indication
of performance. Logo inside a dashed box represents a co-investment
11Disciplined investing
• Review a broad range of established private equity managers • “Best in class” in terms of geography, sector specialisation,
• Leveraging global presence to unlock opportunities investment strategy, value creation and deal sourcing
• Full due diligence process irrespective of track record and • Demonstrated the changing mix of our core manager group
relationship
Total primary pipeline >100 opportunities SLPET opportunities reviewed – 21 Commitments made in 2019 – 7
Core Manager Example Matching SLPET criteria
• Defensible – consistently strong performance
throughout the cycle
• Sourcing – Strong market position in the Nordic
mid-market
• Geographic focus – DACH and Nordic • Focus on operational change – Active owner
• Market segment – Mid-market
driving value creation through improving key
operational metrics
• Sector – Generalist • Experienced team – lessons learnt during the
global financial crisis
Notes: © owned by each of the corporate entities named in the respective logos. Companies selected for illustrative purposes only to demonstrate Aberdeen
Standard Investments’ investment management style and not as an indication of performance
12Sustainable dividend underpinned by robust long-term performance
• SLPET is committed to maintaining the current dividend of • Long-term outperformance against the FTSE All Share index
12.8 pence per share in real terms
• Dividends underpinned by strong realisations at the underlying
• 3.6% dividend yield ahead of peer group average of 2.1%1 portfolio and future expected realisations
SLPET share price and dividend yield
400 4.0%
350 3.5%
300 3.0%
250 2.5%
Pence
200 2.0%
150 1.5%
100 1.0%
50 0.5%
0 0.0%
Sep 2012 Sep 2013 Sep 2014 Sep 2015 Sep 2016 Sep 2017 Sep 2018 Sep 2019
Share price (price) Dividend yield (%)
Notes: Thomson Reuters Datastream. Dividend per share is based on proposed full year dividend to September 2019
Notes: 1. Based on proposed full year dividend to 30 September 2019 and 30 September 2019 share price.
13 Past performance is no guide to future returns4. Performance Highlights
Overview of SLPET Performance

                                                         UK Listed Investment Trust
                    £710.1m
                           Net assets
                                                         High-conviction investor in leading private equity funds
                      +5.7%1                             Long-term outperformance against listed markets
                    12 month share price
                        total return

                                                         Robust balance sheet with strong cash generation from the portfolio
                     +10.5%1                             Enhanced dividend policy with an attractive yield of c. 3.6%
                        12 month NAV
                         total return

                                                         Unique flat rate fee of 0.95% on NAV
                       +8.9%
                Since inception share price
                  annualised total return

                      +10.2%
                    Since inception NAV
                   annualised total return

Notes: 1. NAV and share price performance as at 30 September 2019. Total return includes re-invested dividends.

   15                                                                       Past performance is no guide to future returns
SLPET Highlights for the 12 months to 30 September 2019
Net Asset Value per ordinary share
(“NAV”) NAV Share price
growth1 growth
461.8p (2018: 430.2p)
Net Assets +10.5% +5.7%
£710.1m (2018: £661.4m)
(2018: 13.5%) (2018: 5.8%)
Market cap 12 month total return
12 month total return
£541.2 million (2018: £531.2m)
Share price Proposed full year Management fee
352.0p (2018: 345.5p)
dividend
0.95% (2018: 0.95%)
12.8p (2018: 12.4p) of NAV
Yield 1.09% (2018: 1.10%)
23.8%2 (2018: 19.7%) Ongoing charged
Discount to net asset value 3.6%3 (2018: 3.6%) ratio
Notes: 1. Total return includes re-invested dividends. 2. As at 30 September 2019. 3. Based on proposed full year dividend to 30 September 2019.
16 Past performance is no guide to future returnsSLPET performance against peers
• Robust NAV performance versus peers across multiple time periods.
• With the exception of the 1 year time period, SLPET’s NAV performance (annualised NAV total return) has been strong in
comparison with peers
• In addition, SLPET offers a 3.6% dividend yield, which is above the peer group average1
NAV performance compared to peer group
20%
18%
16%
Annualised performance
14%
12%
10%
8%
6%
4%
2%
0%
1 year 3 years 5 years 10 years Since
inception
SLPET Pantheon ICG BMO HarbourVest
Source: ASI PE, Thomson Reuters Datastream
Notes: 1. Peer group includes BMO; ICG Enterprise; Harbourvest GPE; Pantheon International.
17 Past performance is no guide to future returnsRobust Balance Sheet
Strong balance sheet in line with peer group1 Prudent over commitment strategy
• Liquid resources of £67.7m (10.8% of portfolio NAV)2 • Outstanding commitments less liquid resources: 43% of
Fund NAV3 (long term target of 30-75%)
• £100m revolving credit facility available for short term
liquidity requirements • £450.2m outstanding commitments (of which £62.0m is
unlikely to be called)
Outstanding commitments
35% 500 76% 80%
450
450
70%
30%
400 388
369
60%
25% 350 326
47%
306
50%
As a % of NAV
300 43%
20%
£ million
246
250 228 40%
214
15% 31%
200 179
25% 30%
150 22% 23%
10% 150 126 129
18%
20%
14%
100
5% 14% 10%
50
1% 1%
0% 0 0%
Cash balance as % portfolio NAV Facility as % portfolio NAV Sep Sep Sep Sep Sep Sep Sep Sep Sep Sep Sep Sep
2008 2009 2010 2011 2012 2013 2014 2015 2016 2017 2018 2019
Outstanding commitments Commitments in excess of liquid resources as a % of Fund NAV
SLPET ICG Enterprise BMO Harbourvest Pantheon
Notes: 1. Source: available annual reports and factsheets, data as at at 30 September 2019 2. Includes cash and other assets available for investment. 3. Over commitment ratio reduces to 40% following increased debt facility of
£100m agreed post-30 September 2019
Past performance is no guide to future returns
18Summary – a differentiated opportunity
The Standard Life Private Equity Trust provides exposure to:
• A diversified portfolio of leading private companies
• A carefully selected range of private equity managers, built from years of established relationships and
proprietary research
• Investments principally focused on European mid-market private companies
With the objective of delivering strong, long-term total returns for Shareholders through a
combination of capital growth and a progressive dividend.
19Appendix 1: Private Equity Overview
Benefits of investing in Private Equity
Private Equity Value Creation Model
Proactive sourcing and Growing profits through Introducing leverage A transformed
acquisition of businesses increased revenue and to enhance returns business
improved efficiency
• Investing in Private Equity can generate high risk-adjusted returns
• Enables investors to access companies closed to listed-only investors
• Broader universe of opportunities – c. 5 times as many private companies versus listed
• Private equity is an investment style enabling alpha generation through
longer-term orientation
information advantage
less efficient markets
corporate governance / active ownership
better alignment of interests
control over exit
21Attractions of the SLPET model
Listed Private Equity Value Chain
• Liquid access to an illiquid asset class
• Long-term outperformance vs listed markets
• No private equity ‘J-curve’ via open-ended, evergreen structure
• No up front or exit fees associated with traditional private funds
• Historically SLPET has been a pure fund selector with no direct investments. New co-investment
programme leverages ASI’s existing platform to add diversification and reduce management fee expenses.
• Stable dividend yield and NAV growth
22Showcasing SLPET at work: Past and current portfolio companies © owned by each of the corporate entities named in the respective logos. Companies selected for illustrative purposes only to demonstrate Aberdeen Standard Investments’ investment management style and not as an indication of performance. 23
Private Equity market dynamics
                                   Global private equity dry powder: buyout                                                                          European buyout dry powder

                  $500bn
                                                                                                                              $200bn

                  $400bn                                                                                                      $160bn
     Dry Powder

                  $300bn                                                                                                      $120bn

                                                                                                                 Dry Powder
                  $200bn                                                                                                      $80bn

                                                                                                                              $40bn
                  $100bn

                                                                                                                               $0bn
                   $0bn                                                                                                                2009   2010       2011   2012   2013    2014      2015    2016    2017     2018   YTD Nov-
                           2009   2010    2011   2012     2013   2014   2015   2016   2017   2018   YTD Nov-                                                                                                               19
                                                                                                      19
                                         US Buyout      Europe Buyout    Asia/RoW Buyout                                               Small (< $750m)      Mid ($750m - $2.5bn)      Large ($2.5bn - $5bn)     Mega ($5bn+)

   • Global private equity dry powder has reached record heights of                                            • European buyout dry powder reached $184bn in November
     $1.25tn as of November 2019, of which $728bn is targeted at                                                 2019, slightly less than the dry powder in 2018 but well above
     buyouts and $517bn at venture/growth.                                                                       that available at the prior peak ($146bn in December 2009).
   • The majority of buyout dry powder is targeted at the US, which                                            • Despite the overall market trend, dry powder for funds less than
     stands at $465bn for buyout funds. This is 120% above the post-                                             $5bn in size has been relatively consistent since 2007, as the
     crisis low point in 2012 and 55% above its previous peak in 2008.                                           fund size expansion below $5bn and new entrants into the
     European buyout dry powder is also at record levels, having                                                 market are offset by those GPs moving beyond $5bn in fund
     reached $184bn at August 2019, however, expansion has been                                                  size.
     slower than in the US and is currently at 75% above the post-crisis
     low point in 2012 and 30% above its previous peak in 2008.

Source: Preqin, data as at 30 November 2019

  24
Private Equity market dynamics
European deal value and volume European deal value
€60bn 600 100%
90%
€50bn 500
80%
70%
€40bn 400
60%
50%
Volume
€30bn 300
Value
Value
40%
€20bn 200 30%
20%
€10bn 100
10%
0%
€0bn 0 H1 H2 H1 H2 H1 H2 H1 H2 H1 H2 H1 H2 H1 H2 H1
H1 H2 H1 H2 H1 H2 H1 H2 H1 H2 H1 H2 H1 H2 H1 H2 H1 H2 H1 H2 H1 2012 2013 2014 2015 2016 2017 2018 2019
2009 2010 2011 2012 2013 2014 2015 2016 2017 2018 2019
< €100m €100m - €1bn €1bn+ Buyout Volume < €100m €100m - €1bn €1bn+
• European buyout activity has increased overall following the 2009 • Activity increasingly dominated by large cap deals
trough, growing in value and volume by 19% and 11% CAGR • Over 50% value in deals over €1bn in value (measured
respectively through to 2018. by company’s Enterprise Value)
• 2018 activity was particularly active, with total transaction value • 30% within SLPET’s sweet spot of mid-sized transactions
surpassing all previous periods post-crisis.
• Activity in the large/mega buyout space has been more subdued
since the peak in the 2005-2007 period; however, this segment
showed a spike in activity in H1 2018, driving full-year values.
Source: Preqin, data as at 30 November 2019. For illustrative purposes only.
25SLPET discount and secondary market trading
• During 2019 SLPET’s discount ranged from 9.2% to its • High quality private equity funds continue to trade at, or a
current level of 23.5%1 premium to NAV
• 1-year average moving average discount of 20.0% • Slight dip in marketing pricing from 97% at December 2018
to 95% at June 2019
• Clear spread between SLPET pricing and that of the
secondary private equity market, despite the SLPET
secondary portfolio being of high quality
Share price premium / (discount) to NAV Secondary pricing as a percentage of NAV
15% 120%
110%
10%
100%
5%
Share price premium / (discount)
90%
Pricing as a percentage of NAV
0%
80%
-5% 70%
-10% 60%
50%
-15%
40%
-20%
30%
-25%
20%
-30% 10%
-35% 0%
Jan 2019 Apr 2019 Jul 2019 Oct 2019 Jan 2020 Dec Dec Dec Dec Dec Dec Dec Dec Dec Dec Dec Dec Dec Dec
2006 2007 2008 2009 2010 2011 2012 2013 2014 2015 2016 2017 2018 2019
SLPET Pantheon ICG BMO HarbourVest % of NAV (SLPET) % of NAV (Secondaries)
Source: Thomson Reuters Datastream
Source: SL Capital, Thomson Reuters Datastream, Greenhill Secondary Market Update & Outlook
Notes: Data as at 31 December 2019. Source: Aberdeen Standard Investments, Thomson Reuters Datastream.
26 Past performance is no guide to future returnsAppendix 2: SLPET Portfolio
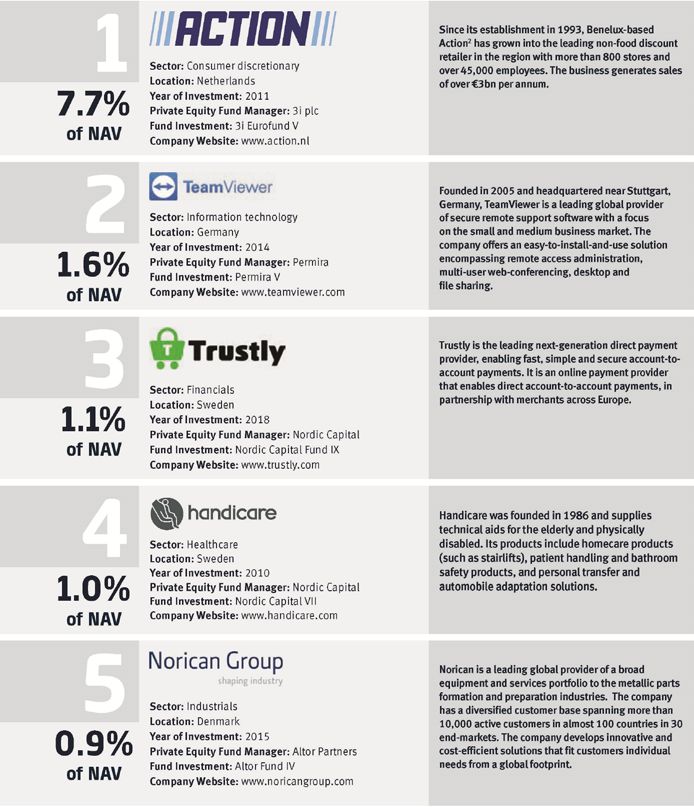
SLPET Portfolio
  Largest 10 private equity funds – 53.9% Total Fund NAV

Notes: Aberdeen Standard Investments, 30 September 2019. © owned by each of the corporate entities named in the respective logos. Companies selected for illustrative purposes only
to demonstrate Aberdeen Standard Investments’ investment management style and not as an indication of performance

  28
SLPET Portfolio
  Largest 10 underlying companies – 16.7% Total Fund NAV

Notes: Aberdeen Standard Investments, 30 September 2019. © owned by each of the corporate entities named in the respective logos. The figures shown above are based on gross
valuations, before carry provision. In the exceptional case of Action the Manager has estimated Action's as a % of NAV, net of carry provision.

  29
SLPET Portfolio
 Geographic location of underlying investments

Notes: Aberdeen Standard Investments, 30 September 2019

  30
SLPET Portfolio

 Sector exposure and holding period of underlying investments

Notes: Aberdeen Standard Investments, 30 September 2019

  31
Portfolio valuation multiples – top 50 investments
  Enterprise value/EBITDA                                                                                                    Multiple of enterprise value / EBITDA
                                                                                10
  •    The top 50 private companies that represent 50% of the net
       asset value at 30 September 2019 (being the most recent                    8                                                                                                                                                7
       data) had a median EV / EBITDA multiple of 13.1x.                                                                                                                          6
                                                                                  6           5                                  5           5                                                5

                                                                        Count
  •    Those valued at a multiple of greater than 15x are generally                                                  4                                   4            4
       private companies that have strategic value. These                         4
       businesses are growing strongly in highly rated sub-sectors                                                                                                                                                     2
       (e.g. software, medical technology). Higher valued                         2                                                                                                                        1

       companies include Action and Teamviewer                                                             0
                                                                                  0
                                                                                             < 8x     8x - 9x    9x - 10x 10x - 11x 11x - 12x 12x - 13x 13x - 14x 14x - 15x 15x - 16x 16x - 17x 17x - 18x                      > 18x
                                                                                                                                                 EV / EBITDA Multiple
                                                                                                  Current Investments                Exited Investments - Not Listed                       Exited Investments - Listed
 Net debt/EBITDA                                                           Top 50 underlying portfolio companies as at 30 June 2019
                                                                           In the case of 2 investments, it has not been possible to calculate meaningful multiples due to the nature of the underlying businesses.

  •    Median Net Debt / EBITDA in the portfolio at 4.8x was
                                                                                                                                     Multiple of net debt / EBITDA
       consistent with the prior period. The private equity                             18                                                                       16

       managers in the portfolio are generally prudent in relation to                   16

                                                                                        14
       the capital structures of their underlying companies.
                                                                                        12                                                                                            10
  •    Whilst leverage can be relatively high (>5x EBITDA),

                                                                                Count
                                                                                        10
       optically high multiples often relate to highly cash                              8                                                   6
       generative businesses.                                                            6
                                                                                                                         5                                                                                                     5
                                                                                                                                                                                                           4
                                                                                         4
  •    Both metrics are in line with the private equity market for                                   2
                                                                                         2
       similar sized deals and vintages.
                                                                                         0
                                                                                                    < 2x            2x - 3x              3x - 4x              4x - 5x             5x - 6x              6x - 7x                > 7x
                                                                                                                                              Net Debt / EBITDA Multiple

                                                                                                           Current Investments                Exited Investments - Not Listed                     Exited Investments - Listed
                                                                                   Top 50 underlying portfolio companies as at 30 June 2019.
                                                                                   In the case of 2 investments, it has not been possible to calculate meaningful multiples due to the nature of the underlying businesses.

Notes: Aberdeen Standard Investments, 30 June 2019

  32
Underlying portfolio – growth rates
LTM sales and EBITDA growth
• The underlying portfolio has exhibited strong average revenue and EBITDA growth of over 10% from 2017 – 2019.
LTM Sales and EBITDA growth
20% 20%
18% 18%
LTM Sales and EBITDA growth (%)
16%
16% 16%
14% 14%
12% 12%
12% 11% 12%
10%
10% 11% 10%
8%
8% 8%
6% 6%
4% 4%
2% 2%
0% 0%
Jun 2016 Jun 2017 Jun 2018 Jun 2019
LTM sales growth LTM EBITDA growth
Data sourced from average growth rates across portfolio companies at underlying private equity funds
Notes: Aberdeen Standard Investments, 30 June 2019
33Appendix 3: Costs
SLPET costs compared to peers

•       Current NAV is net of ongoing costs
•       Fees and carry already priced into secondary transactions
•       Most significant element is underlying carried interest – only
        payable when underlying funds generate strong
        performance

                                                                                                                           Fund of Funds                                        Direct

                                                              Costs                          SLPET              ICG              BMO            Pantheon         HarbourVest   HgCapital

                                                             Entry costs                      0.00%             0.00%            0.00%            0.00%             0.00%        0.00%
                                          One-off costs
                                                             Exit costs                       0.00%             0.00%            0.00%            0.00%             0.00%        0.00%

                                                             Portfolio transaction costs      0.03%             0.13%            0.06%            0.05%             0.00%        0.20%
                                          Ongoing costs
                                                             Other ongoing costs              5.51%             3.22%            3.36%            3.89%             1.89%        2.10%

                                                             Performance fees                 0.00%             0.00%            0.53%            0.00%             0.00%        0.00%
                                          Incidental costs
                                                             Carried interests                0.00%             2.68%            0.00%            0.00%             0.80%        2.00%

                                                               Total                          5.54%             6.03%            3.95%            3.94%             2.69%        4.30%

    Notes: As at 1 January 2019 for SLPET, source: Aberdeen Standard Investments. Peer group data as at 1 January 2018, source: Key Information Document (KID)

      35
Appendix 4: Current Shareholders 36
Current Shareholder Constituents
 •      Large investor base of over 150 shareholders. Largest shareholder is Phoenix Group, with c. 56% shareholding1
 •      Remaining investor base is diverse with a mixture of asset managers (Blackrock, L&G) and smaller retail investors via
        platforms (Hargreaves Lansdown, FundsDirect)
                                                                                                            No. of shares at
                                 No.                Name                                      % of shares     30-Nov-19
                                                                                                                  (m)
                                  1                  Phoenix Group Holdings                     56.37%        86,661,475
                                  2                  Quilter Cheviot Investment Management      5.97%          9,179,047
                                  3                  Oxfordshire CC PF                          3.03%          4,658,684
                                  4                  Hargreaves Lansdown, stockbrokers (EO)     2.63%          4,037,044
                                  5                  Charles Stanley                            2.45%          3,769,014
                                  6                  Interactive Investor (EO)                  2.41%          3,708,150
                                  7                  Smith & Williamson Wealth Management       1.75%          2,691,529
                                  8                  Scottish Enterprise PF                     1.74%          2,670,482
                                  9                  Legal & General Investment Management      1.55%          2,376,585
                                  10                 LGT Capital Partners                       1.50%          2,303,617
                                  11                 AJ Bell, stockbrokers (EO)                 1.05%          1,613,776
                                  12                 BlackRock                                  0.93%          1,430,108
                                  13                 EFG Harris Allday, stockbrokers            0.81%          1,241,885
                                  14                 Transact (EO)                              0.77%          1,189,672
                                  15                 Rathbones                                  0.76%          1,160,813
                                  16                 Red Rocks Capital                          0.74%          1,135,999
                                  17                 Mr David Currie                            0.73%          1,116,696
                                  18                 Brewin Dolphin, stockbrokers               0.71%          1,085,435
                                  19                 Alliance Trust Savings                     0.69%          1,068,201
                                  20                 Credit Suisse Private Banking              0.68%          1,040,000

                                                                            Total               87.25%

Notes: Aberdeen Standard Investments, 30 November 2019

  37
Appendix 5: Discrete performance
Discrete performance

        Annual total return (annualised)                                  1 year                      3 years                     5 years                     10 years               Since Inception
        SLPET NAV                                                         +10.5%                      +13.2%                      +15.2%                      +12.7%                       +10.2%
        SLPET Share Price                                                  +5.7%                      +13.8%                      +12.6%                      +14.6%                           +8.9%
        FTSE All Share Index                                               +2.7%                       +6.8%                       +6.8%                        +8.3%                          +5.6%

        Discrete Performance                                             30 Sep 19                   30 Sep 18                   30 Sep 17                   30 Sep 16                    30 Sep 15
        SLPET NAV                                                         +10.5%                      +13.8%                      +15.3%                      +25.0%                       +12.1%
        SLPET Share Price                                                  +5.7%                       +5.8%                      +31.9%                      +28.0%                           -4.0%
        FTSE All Share Index                                               +2.7%                       +5.9%                      +11.9%                      +16.8%                           -2.3%

Notes: Net performance data as at 30 September 2019. Discrete performance shown as 12 month periods to 30 September 2019. Source: Aberdeen Standard Investments, Thomson Reuters Datastream.

 39                                                                    Past performance is no guide to future returns
Important information The value of investments, and the income from them, can go down as well as up and investors may get back less than the amount invested. Past performance is not a guide to future results. An investment in this Company is subject to market, currency, over- commitment and liquidity risks. Investors should review the relevant Key Information Document (KID) prior to making an investment decision. These can be obtained free of charge from www.slpet.co.uk or by writing to SL Capital Partners LLP, 1 George Street, Edinburgh, Scotland, United Kingdom, EH2 2LL The information in this document is confidential and may not be reproduced or redistributed in whole or in part without the prior written consent of Standard Life Investments (Private Capital) Limited (“SL Capital”). Recipients of this document acknowledge that unauthorised disclosure of the information in this document may give rise to significant loss to SL Capital and/or its affiliates and civil liability for the discloser. Nothing in this document constitutes a direct or indirect offering or placement by SL Capital (or by any other person) of interests, units or shares in any alternative investment fund or in any other fund, entity or undertaking. Any such offering or placement would only be made where, among other conditions, all required regulatory consents, authorisations and approvals to such offering or placement have been obtained. There is no guarantee that any such offering or placement will be made. No future decision to invest in any fund which may be established to participate in the investment opportunity contemplated in this document should be made other than on the basis of the constitutional documents of such fund. While the information set out in this document has been prepared in good faith, no representation or warranty is given, and no responsibility is accepted, by SL Capital or its affiliates (or by any of their respective officers, employees or agents) in relation to its accuracy or completeness and any such liability is expressly disclaimed. All opinions and estimates in this document are those of SL Capital, and constitute SL Capital’s best judgement as of the date of this document (or, if different, as of the date indicated in this document). The information is only as current as the date of this document (or, if different, the date indicated), and may be superseded by subsequent market events or for other reasons. Statements concerning market trends are based on current market conditions, which may fluctuate. References to future returns are not promises or even estimates of actual returns that may be achieved, and should not be relied upon. Any forecasts contained herein are for illustrative purposes only and are not to be relied upon as advice or interpreted as a recommendation. In addition, any forecasts are based upon subjective estimates and assumptions about circumstances and events that may not yet have taken place or may never do so. Any investment in any fund which may be established would be speculative, would involve significant risk and would only be suitable for sophisticated investors who have sufficient experience and knowledge to make their own evaluation of the merits and risks of an investment in such fund. In particular, the investment objective of any such fund may not be achieved and an investment in any such fund would only be suitable for investors who are able to bear a substantial loss of investment and for whom the illiquid nature of the investment is suitable. If a fund is established to participate in the investment opportunity contemplated in this document, a more detailed explanation of the material risks associated with an investment in such fund will be set out in an investor disclosure document issued by SL Capital. Prospective investors in any such fund should ensure that they read that document and understand the nature of the investment and the extent of their exposure to risk in making an investment in such fund. Prospective investors will be required to determine for themselves the suitability of an investment in any fund which may be established in light of their own circumstances and seek such professional advice as they may require. Prospective investors must not treat the content of this document or any subsequent communications from SL Capital or any of its affiliates as advice relating to legal, taxation, accounting, regulatory, investment or other matters. No person has been authorised to give any information or make any representations not contained in this document and, if given or made, such information or representations may not be relied upon as having been made or given with the authority of SL Capital. No responsibility is accepted by SL Capital or any of its affiliates or by any other person in respect of any such information or representations. Aberdeen Asset Managers Limited, registered in Scotland (SC108419) at 10 Queen’s Terrace, Aberdeen, AB10 1XL. Standard Life Investments Limited registered in Scotland (SC123321) at 1 George Street, Edinburgh EH2 2LL. Both companies are authorised and regulated in the UK by the Financial Conduct Authority. Calls may be monitored and/or recorded to protect both you and us and help with our training. © 2019 Standard Life Aberdeen, images reproduced under licence D/H GB-270619-92397-2 40
You can also read