MOBILE AD CREATIVE INDEX - 2019 PERFORMANCE TRENDS & BENCHMARKS - Liftoff
←
→
Page content transcription
If your browser does not render page correctly, please read the page content below

MOBILE AD
CREATIVE INDEX
2019 PERFORMANCE TRENDS & BENCHMARKS

LIFTOFF MOBILE AD
CREATIVE INDEX
2019 PERFORMANCE TRENDS & BENCHMARKS

Introduction                                          3

Mobile Ad Creative Benchmarks                         6

Key Takeaways                                         8

Ad Creative Performance by Platform                  11

Engagement by Ad Format                              13
 Banner Ads                                          13
 Interstitial Ads                                    14
 Video Ads                                           15
 Interactive Ads                                     16
 Native Ads                                          17

Ad Creative Seasonal Trends                         18
 Banner Ads                                         18
 Interstitial Ads                                   19
 Video Ads                                          19
 Interactive Ads                                   20
 Native Ads                                        20

A/B Testing Mobile Ad Creative                      21

Summary                                             24

                                      Liftoff 2019 Mobile Ad Creative Index   2
Introduction
In 2019, people around the world will spend more time online than
they do watching TV. That’s a first -- and mobile will be responsible
for all growth in Internet consumption.

This opportunity is driven by two         more apps and spend a quarter of
key trends: record-high smartphone        their waking hours on mobile screens,
penetration rates and a growing number    capturing people’s attention -- today’s
of apps -- over five million in the two   most scarce resource -- has never been
leading app stores combined. That         harder. By a modest count, the average
means marketers can reach more users,
                                          person is exposed to 5,000 ads a day,
with more ad placements and more data
                                          online and off. To be relevant, marketers
to refine their targeting.
                                          need data and technology to gauge
And even though more people now           people’s context, and human creativity to
own a smartphone, have access to          craft the message that resonates.

                                                           Liftoff 2019 Mobile Ad Creative Index   3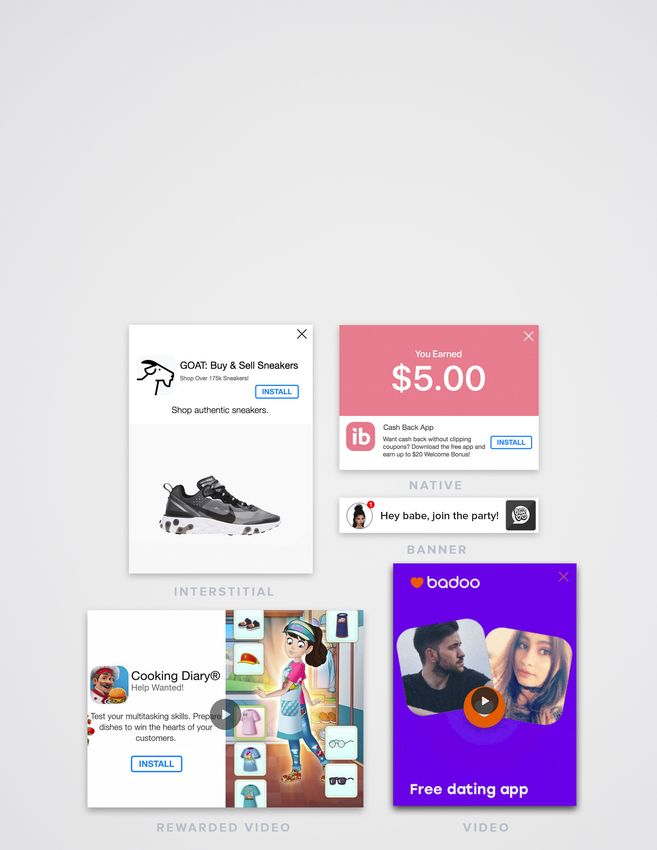
The 2019 Mobile Ad Creative Index              This report draws from Liftoff internal
reveals how ad creative impacts user           data from November 1, 2017 through
engagement in deep-funnel events,              October 31, 2018, spanning over 273
profiling five key ad formats and sharing
                                               billion impressions, over 4.5 billion clicks,
tips on how to leverage each to drive app
                                               63 million installs and 22 million post-
growth. These insights will arm mobile
                                               install events in over 1,200 apps. You
marketers with the benchmarks and
trends you need to know to effectively         will find key takeaways on how banner
win high-value customers on mobile in          ads, interstitials, video, interactive (aka
2019.                                          playables) and native ads perform.

        BANNER                              VIDEO                                INTERSTITIAL

                    INTERACTIVE                               NATIVE

                                                                  Liftoff 2019 Mobile Ad Creative Index   4
2019 mobile ad creative index benchmarks
              ITI Impressions-to-install, calculated as installs divided by impressions.

              CPI Cost-per-install, calculated as ad spend divided by installs.

              CPA Cost-per-action, calculated as ad spend divided by post-install events.

              ITA Install-to-action rate, calculated as post-install events divided by installs.

The data is broken down by ITI, CPI,                       throughout the year by comparing
CPA and ITA to benchmark the cost of                       acquisition costs and engagement rates
acquiring a new user from a paid app                       month-over-month. Finally, we share
install campaign, compare top-funnel                       best practices in designing ad creatives
performance metrics by format and                          and optimizing ad performance with A/B
examine deeper-funnel impact on post-                      testing.
install actions1 including registrations,
purchases, in-app purchases,             This is the first report from Liftoff
subscriptions and reservations.          highlighting ad costs and engagement
                                         by ad creative format -- and the largest
To compare how each format performs      dataset we analyzed to date. We hope
on iOS and Android, the report breaks    the insights will help you benchmark your
down the data by operating system. We    mobile ad creative performance and plan
examine how different ad formats perform your mobile ad creative strategy in 2019.

1
    The data includes first-time events only, and doesn’t include recurring events.

                                                                                 Liftoff 2019 Mobile Ad Creative Index   5
Mobile Ad Creative Benchmarks
The quality of creatives determines 75% of an ad’s impact. With
technology and data upending the advertising industry, it is easy for
marketers to lose sight of a fundamental truth: creative is still king.

But as screens have shrunk to the size       a desktop banner to mobile size, or
of our hands, people’s attention span        reusing a TV commercial as a video ad
has markedly decreased too. Mobile           on the Display Network is unlikely to
users are busy and distracted. On            work.
average, they will only spend 1.7 seconds
engaging with mobile content. Today’s        Mobile ads that work best are designed
biggest challenge is not to capture          for mobile first and foremost, then tested
location and purchase intent data            and optimized to deliver on campaign
with accuracy; it is to capture people’s     goals. For mobile marketers, getting
attention in a world where ad avoidance      there starts with understanding the
is the new default. Naturally, repurposing   nuances of different ad formats.

                                                              Liftoff 2019 Mobile Ad Creative Index   6
IMPRESSION-TO-INSTALL RATE BY AD FORMAT

Looking at the top of the user                Based on top-of-funnel metrics alone,
acquisition funnel, video (0.16% ITI)         video and interactive ads present the
and interactive ads (0.15% ITI) show          biggest opportunity for mobile marketers.
the highest impression-to-install rates,      But if you drill down to the costs and
followed by interstitials, native ads and     deeper-funnel conversion rates by ad
banners.                                      format, the data shows a different picture
                                              of ad creative performance.

                        COST AND ENGAGEMENT RATE BY AD FORMAT

                                                                Liftoff 2019 Mobile Ad Creative Index   7
Though not as exciting as video or
                                              interactive ads, banner ads have
                                              stood the test of time and remain an
                                              important component of our overall
                                              marketing mix.

                                              Chris Chee, Performance Marketing
Key Takeaways                                 Manager at Apartment List

Banner Ads Drive
Performance at a Lower Cost

High ad costs don’t always translate
into higher action rates. In fact, the data
shows that at $2.31 per install and $6.18
per first time post-install action, banner
ads -- the cheapest mobile ad creative
type -- deliver the best bang for the
buck.

Banner ads also have one of the
highest install-to-action (ITA) rates,
second only to native ads. People
exposed to banner ads are more likely
to complete an action (37.4% ITA), such
as a registration or in-app purchase,
after they install an app, compared to
those who saw a video ad (33.4% ITA).
And compared to native ads which
have the highest ITA rate of all ad types
(38.7% ITA), banner ads come with a
more attractive price tag.

                                                            Liftoff 2019 Mobile Ad Creative Index   8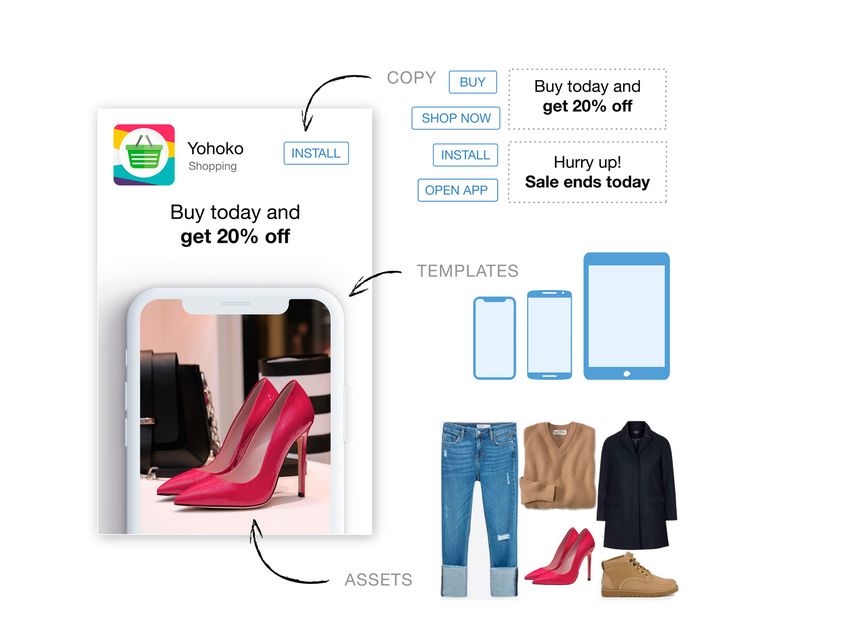
For the Highest Post-Install Conversion Rate, Go Native

Native ads feature the highest post-      On average, with native ads, marketers
install conversion rate across all ad     pay $2.96 per install and $7.65 per post-
creative types. With a 38.7% ITA,         install action. Especially on iOS, native
native ads also offer good value when     ads deliver a very high post-install
benchmarked against other ad types.       engagement rate at a relatively low cost.

       Native ads are our bread
       and butter. It’s critical for us
       to optimize native ads as
       they aren’t as distracting
       as other ad formats, which
       the performance shows.

       Lomit Patel, Vice President
       Growth at IMVU

                                                           Liftoff 2019 Mobile Ad Creative Index   9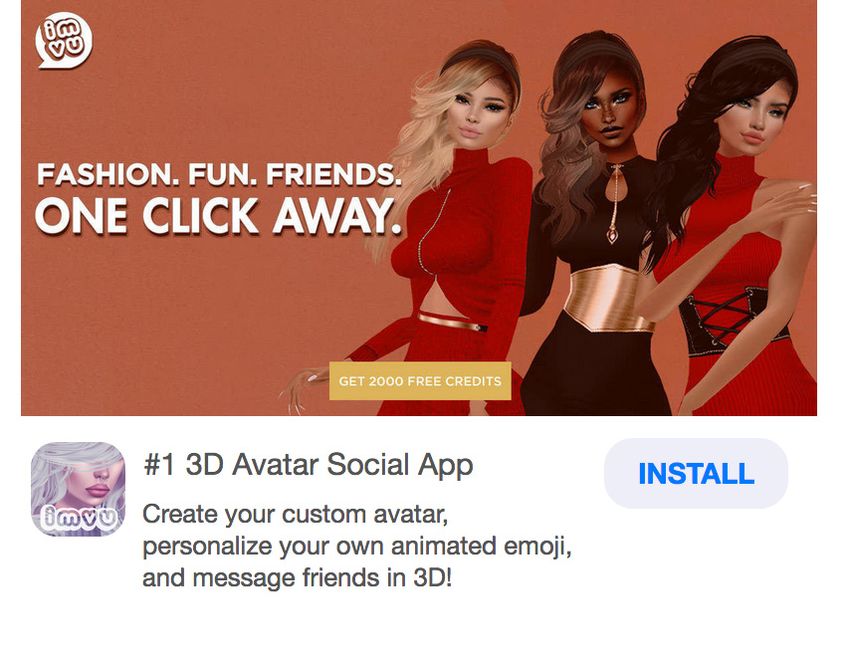
Video and Interactive: All Talk, Little Action

If you listen to industry chatter, video    offer a competitive price per install, yet they
format is all the rage. But when it comes   have the lowest post-install conversion
to performance, banner and native           rate of all the ad formats analyzed in this
ads still reign supreme. At $4.05 per       report. Just 23.8% of people who installed
install and $12.16 per action, the price/   an app after engaging with an interactive
performance ratio somewhat limits the       or playable ad proceeded to convert in a
appeal of video -- that is, if you look     post-install event.
purely at performance, not brand lift.
                                            Does it mean that video and interactive
Interactive ads (commonly referred to as    ads don’t convert as well as the other ad
“playables” in the gaming app category)     formats? App category data is outside the
                                            scope of this report, so we can’t apply this
                                            insight to all apps. Playables for gaming
                                            apps, for example, will likely show a better
                                            conversion rate. And how marketers
                                            use these new ad formats also varies.
                                            Anecdotal feedback from the industry
                                            suggests that marketers are still using
                                            social media ads and TV commercials in
                                            the mobile in-app environment, potentially
                                            driving down performance.

                                             The best performing video ads tend
                                      to showcase the value proposition of an app in a
                                       clear and concise way. They shouldn’t be huge
                                         Hollywood productions to gain conversions.

                                     Ira Krachanovskaya, Head of Growth Marketing at Badoo
                                                               Liftoff 2019 Mobile Ad Creative Index   10
Ad Creative Performance by Platform
A breakdown of ad creative performance by platform reveals what
you might expect: iOS users cost more than Android users. But isolate
performance by ad creative type, and you will see curious differences
in post-install engagement rates by platform.
Native ads drive better user
experiences for iOS users, resulting in
a higher install-to-action rate. Native
ads feature an impressive 40.1% ITA,
followed by video ads (36.2%) and
banners (34.3%). And if you look at
the costs for iOS, native ads offer
better value for money compared to
interstitials and interactive ads.
PLATFORM: IOS COSTS & ENGAGEMENT RATE
Liftoff 2019 Mobile Ad Creative Index 11Banner ads, on the other hand, deliver creative performance data show
the best post-install engagement that native ($11.17 CPA) and banner
rate for Android users at a low $1.42 ads ($13.53) help acquire the highly
per install and $3.73 per post-install valuable iOS users at the best price/
action. Low banner costs coupled with performance ratio.
the high popularity of Android devices
in developing markets make banners However, if you are looking to scale
and the Android platform the perfect fast and cheap, or targeting specific
match for marketers looking to scale geos where Android dominates the
ambitiously in 2019. market, look no further than banners
and interactive ads on Android. At
As stated previously, the high cost $3.73 and $4.60 per first-time post-
to acquire iOS users -- using any ad install action respectively, these ad
type -- is no surprise. If you track types feature the lowest CPA. Though
performance down to deeper-funnel be mindful that interactive ads show a
metrics such as revenue and ROAS, lower install-to-action rate overall and
you will see that iOS users tend may work for some categories better
to spend more over time. Our ad than others.
PLATFORM: ANDROID COSTS & ENGAGEMENT RATE
Liftoff 2019 Mobile Ad Creative Index 12Engagement by Ad Format
Programmatic advertising technology enabled mobile marketers
to have 1:1 conversations with thousands of people on their most
personal devices. But technology is only meaningful if it fits into
people’s lives. Mobile marketers have the opportunity to win
consumer attention if they focus on adapting their message to
mobile in-app context and its new and emerging ad formats.
Banner Ads banners also cost less than other mobile
ad creative types while featuring the
This year marks the 25th anniversary second-highest ITA rate (after native ads)
of the banner ad, launched as part of of all ad types.
an AT&T advertising campaign back
in 1994. This may sound like a lifetime And banner size matters, though bigger
for a digital format, but banners are doesn’t always mean better. The “mobile
still relevant -- on web and mobile. Of leaderboard,” modestly sized at 320x50,
course, the mobile version of a desktop provides ample width for readability on
banner has evolved over the years. mobile screens. This small but mighty
Modern banners are optimized through ad format features an impressive 39.31%
responsive serving that customizes ad ITA rate and performs nearly four times
creative for different devices, content better than the 728x90 tablet-optimized
and audiences. “leaderboard.”
While banners obviously don’t push
the boundaries of creative tech, they
offer broad reach and work with most
publishers. Unlike other ad types,
banners don’t present any inventory
scale issues. At $2.31 CPI and $6.18 CPA, BANNER ADS: COSTS & ENGAGEMENT RATE
Liftoff 2019 Mobile Ad Creative Index 13Anchored to the top or bottom of the performance, while going too far with
screen, banners follow the user as they animation will only annoy users, cause
scroll through the app and on average, accidental clicks and drive down the
appear for 25-30 seconds -- longer value of ads.
than other formats, according to Liftoff
data. But as marketers know well, views
can be a deceptive metric. To boost
engagement, it is important to get the
message across much quicker -- within
the first few seconds.
Cheap and versatile, banners work
best for scaling campaigns. But when it
comes to design and messaging, less is
more. The right targeting, fast load time
and direct messaging will help boost BANNER ADS: COSTS & ENGAGEMENT RATE BY SIZE
Interstitial Ads bigger. The bad news: interstitials often
don’t have an immediate option to close
Interstitial ads are served at natural in- the ad, leaving the user feeling annoyed,
app transition points taking up the entire especially if placed in the wrong type of
mobile screen. Depending on how and app. Interstitials are viewed on average
where they are served, interstitials can for two to four seconds, according to
be a blessing or a curse. The good Liftoff data.
news: these full-screen ads capture the
user’s full attention and year over year, Interstitials cost $3.37 per install and
offer a larger media canvas for creativity $10.68 per post-install action, which
as our device screens keep getting makes them the second most expensive
Liftoff 2019 Mobile Ad Creative Index 14ad format after video. Interstitial ads also
feature a fairly low install-to-action rate.
At 31.5% ITA, they convert users better
than interactive ads but not as well as
banners (37.4% ITA), native (38.7% ITA)
INTERSTITIAL ADS: COSTS & ENGAGEMENT RATE
and video ads (33.4% ITA).
As you can see, on average, display rich media content and
interstitials cost a premium and often emphasize the CTA. When placed in
don’t perform as well as other, less apps with clear linear user journeys,
expensive ad types. On the positive such as multi-level games, interstitials
side, they do offer more room to can be very effective.
INTERSTITIAL ADS: COST & ENGAGEMENT RATE BY SIZE
Video Ads for direct performance, where brevity
trumps detail, video ads don’t always
As a storytelling medium, video offers live up to the hype. At $4.05 per
marketers a richer way to appeal to install and $12.16 per first-time post-
our human emotions and senses. But install action, video ads are the most
Liftoff 2019 Mobile Ad Creative Index 15expensive ad type in the data set. At Short, under-15-second, videos that
the same time, video offers a fairly high are typically non-skippable and play
install-to-action rate -- 33.4%. all the way through are more effective.
And a simple video walkthrough
The numbers, however, don’t show the demonstrating the features and user
full picture; marketers still have a long interface will deliver better results -- at a
way to go when it comes to adapting fraction of the budget required to make
this exciting ad format for mobile a TV commercial.
programmatic. Many marketers still use
repurposed social media ads and TV
commercials. That’s unfortunate, as TV
ads typically have a long intro and don’t
get the message across in the few short
seconds that marketers have to capture
VIDEO ADS: COSTS & ENGAGEMENT RATE
a user’s attention.
Interactive Ads However, their install-to-action rate is
far below the rest at only 23.8%.
Interactive ads, also known as playable
ads, offer users the ability to test an app While data points to weak performance
of this ad type, a further breakdown
before installing. These ads typically
by app category will likely tell a very
offer some kind of interaction, like
different story. Interactive ads seem
playing a game or exploring a product
to be well-liked among younger
showcase.
audiences: recent data on Millennials
and Gen Z shows that the “Mobile
Compared to other formats, interactives Prodigies” want mobile creative to
have lower-than-average costs with be fun and “challenge them to do
a CPI of $2.48 and CPA of $10.39. something active.”
Liftoff 2019 Mobile Ad Creative Index 16To unlock the full potential of interactive call to interaction, established clearly
ads, marketers will need to up their through copy and an interaction cue.
game in designing ads that are fun to
play but also make people feel safe
enough to navigate away from their
current experience and touch the ad.
Unlike other app install ads, where a
prominent call to action remains best
practice, interactive ads must have a INTERACTIVE ADS: COSTS & ENGAGEMENT RATE
Native Ads This success of the native ad format
on mobile programmatic shows that
Native ads blend in with the app’s users respond well to ads that are
content, thus appearing “native” to less disruptive to the user experience,
especially when these ads are aligned
the app experience. These “in-feed”
with user intent. In addition to stellar
ads, typically consisting of a thumbnail,
performance, native ads have been
headline, brand name and logo, are found to trigger a greater lift in positive
common among news and social apps. brand associations compared to display
ads. Win-win!
Seamlessly integrated into the app’s
content and thus appearing less
intrusive, this format delivers excellent
performance with an ITA rate of 38.7%,
an average CPI of $2.96 and a $7.65
CPA. NATIVE ADS: COSTS & ENGAGEMENT RATE
Liftoff 2019 Mobile Ad Creative Index 17Ad Creative Seasonal Trends
Consumer behavior and purchasing habits tend to shift throughout
the year. Adjusting ad campaign budgets seasonally helps marketers
make a greater impact.
Some of these consumer behavior Banner Ads
shifts are predictable, like the
In the winter months and early to
holiday shopping season. Other, less
midsummer, the cost per first-time post-
obvious seasonal opportunities, vary
install action drops and engagement
significantly by ad format. Identifying rates soar. We see a reverse trend in
the times when lower costs coincide the spring (Mar, Apr, May), when CPAs
with high engagement rates gives spike while engagement rates remain
savvy app marketers a leg up over the average for the year -- not the best time
competition. to drive Easter sales with this ad type!
BANNER ADS: MONTHLY COSTS & ENGAGEMENT RATES
Liftoff 2019 Mobile Ad Creative Index 18Interstitial Ads (Aug-Oct) brings a spike in cost while
engagement rates decrease below
For interstitial ads, costs drop in the average for the year -- don’t rely
May while engagement skyrockets. on this ad type for high-ROI back-to-
On the opposite end, early fall school campaigns.
INTERSTITIAL ADS: MONTHLY COSTS & ENGAGEMENT RATES
Video Ads opportunity to ramp up your video ad
spend for Mother’s Day, Memorial Day
When it comes to video ads, and Father’s Day promotions. Acquisition
engagement peaks in March, May and costs increase at the end of summer and
June while costs remain at a record low. into early fall, while engagement rates
In North America, this signals the perfect plummet.
VIDEO ADS: MONTHLY COSTS & ENGAGEMENT RATES
Liftoff 2019 Mobile Ad Creative Index 19Interactive Ads costs. On the flip side, performance
dropped significantly in November 2017
May and late summer through early fall with the cost per first-time post-install
of 2018 were great for interactive ads, action increasing to the year’s high.
with high engagement rates and low
INTERACTIVE ADS: MONTHLY COSTS & ENGAGEMENT RATES
Native Ads Midsummer, however, doesn’t offer the
best conditions for increasing spend on
In February, costs cool down while native. As consumers leave on vacation
engagement rates increase to 53% to soak up some sun in July, costs
-- the year’s high. Just in time for increase to $9.44 while engagement
Valentine’s Day promotions and deals! rates drop below average.
NATIVE ADS: MONTHLY COSTS & ENGAGEMENT RATES
Liftoff 2019 Mobile Ad Creative Index 20A/B Testing Mobile Ad Creative
Ad creative is often the first interaction a user has with your product.
Testing and optimizing your ads not only improves performance of
your app marketing campaigns but also helps create a stronger and
more positive impression.
Depending on campaign goals, look at the app’s core benefit by showcasing
click-through rate, impression-to-install the in-app experience. Take a ride-
rate, CPA and other metrics to measure sharing app for example: what is the
the results. core benefit you want to communicate
to users? Is it the fact that it is cashless?
At Liftoff, as of December 2018, we Its speed? Or that it helps you get from
have run over 27,000 A/B tests across A to B? Once that becomes clear from
all app categories and ad formats. The running a test on a static image, apply
data that we collect over time reveals your learnings to other formats.
patterns and best practices for each
vertical -- and sets the direction for A vs B
what elements to test in a campaign.
Copy, color, images, fonts, animation are
some of the many elements to test. For
example, moving a button from the top of
an ad to the bottom can boost installs by
up to 25% -- a significant improvement if
you apply this seemingly small alteration
to all campaign creatives.
But the biggest impact comes down to
identifying the right message. The best
performing ads clearly communicate
Liftoff 2019 Mobile Ad Creative Index 21Below is an example of a native ad A/B test we ran to identify the best value
proposition for the cash back rewards app Ibotta.
A B
vs
Version B had a 44.8% lower CPI and a 49.1% lower CPA compared to Version A.
Using simple copy “You Earned $5.00” more effectively communicates the core
benefit than showcasing the savings earned from different product types.
Here is another example of a native A/B test we ran for the avatar-based social
game app IMVU. Version A focuses on showing different types of avatars a user can
create in the app. Version B focuses more on the fashion elements of the app.
A B
vs
Version A had a 30% lower CPI compared to Version B, likely due to the ad better
communicating the main value proposition of the app -- the ability to creative a variety
of personalized avatars. All users are different and want to know that their unique style
and taste can be met.
Liftoff 2019 Mobile Ad Creative Index 22In another A/B test for the hidden objects game Seeker’s Notes Hidden Mystery,
we tested whether finding several different objects (Version A) would be more
intriguing than finding multiples of the same object (Version B), in this case, teapots.
This test focused on the app’s unique gameplay and resulted in a 41% lower CPI
for the ad with ten teapots (Version B). This A/B test demonstrates one of our key
learnings -- when it comes to mobile ad creative, simplicity is key. It’s important to
value users’ attention and keep the interaction straightforward.
A B
vs
Ongoing A/B tests form best practices that can be applied to specific verticals or
across all of our campaign creatives. At the same time, not all the findings can be
generalized. Sometimes, A/B tests reveal results with no clear explanation and
yet significant performance lifts, pushing mobile marketers to always approach
campaigns -- and especially campaign creatives -- with an always-be-testing
mindset.
Liftoff 2019 Mobile Ad Creative Index 23Summary
For today’s consumers, the first interaction with a product or brand
often happens on-the-go, whenever someone pulls out their mobile
device to get what they need in the moment.
For marketers, each person’s unique On the other hand, banner ads feature
context is valuable to deliver a the lowest impression-to-install rate
meaningful message, but how they yet deliver the best bang for the buck
engage on mobile matters just as if you look at CPI, CPA and post-install
much. Understanding the specifics of engagement rates. Especially on
the five key mobile ad types -- banner, Android, low costs make this ad format
interstitial, video, interactive and native the best creative solution for scaling
-- helps marketers identify the best way growth in developing markets.
to meet users’ needs appropriately and
at the right time.
Video and interactive ads show the
most impressive performance at the
top of the funnel, yet on average, don’t
convert as well as other ad creative
formats. The reason is twofold. First,
these ads likely show high performance
variance by app category. Second,
marketers may need to adapt these
formats better for mobile apps.
Even today, many mobile video ads
are repurposed TV or social media
commercials which don’t perform on
programmatic, and many interactive
(aka playable) ads lack a clear call to
interaction, which drives down the
value of interactive ads.
Liftoff 2019 Mobile Ad Creative Index 24Interstitials cost a premium and don’t perfect opportunity to benefit from lower
perform as well as banners, native and CPAs and higher conversion rates in May.
video ads. User experience is key: when
placed in between levels in gaming apps Testing is the best way to identify and
with linear user journeys, these ads are optimize high-performing campaign
less disruptive to the user experience creatives. To test smarter, identify the key
-- and more effective. value proposition on static banners first,
then experiment with more complex and
Seamless integration into the app’s interactive formats.
content leads to great performance
results for native ads. This format has While some formats work better than
the highest post-install conversion rate others in this data set, in programmatic
across all ad creative types — especially advertising, it is important to spend on
on iOS. every ad format. Machine learning can
take over tasks such as identifying which
Ad creative performance varies ad format to run and when, leaving
significantly by season. For example, people to do what they do best — create
interstitials and video ads present the and experiment.
Liftoff is a performance-based mobile app marketing and retargeting platform
which uses post-install user data to run true cost-per-action user acquisition and
re-engagement campaigns. Powered by advanced machine learning and lookalike
targeting, Liftoff campaigns are optimized to drive actions beyond the install, like
booking a hotel, making a reservation, or renewing a subscription. Liftoff’s cost-per-
action model helps customers scale and grow by acquiring users that actively spend
in revenue-producing events. Headquartered in Palo Alto, CA with offices in New York,
London, Singapore, Tokyo, and Paris, Liftoff works with leading app publishers and
brands across the globe. www.liftoff.io
Fuel your Mobile Growth! www.liftoff.io
info@liftoff.io info@liftoff.io @liftoffmobile
@liftoffmobile
Liftoff 2019 Mobile Ad Creative Index 25You can also read