A research update on the demography and injury burden of victims of New Zealand earthquakes between 2010 and 2014
←
→
Page content transcription
If your browser does not render page correctly, please read the page content below
Australasian Journal of Disaster and Trauma Studies Volume 24, Number 1
A research update on the demography and injury burden of
victims of New Zealand earthquakes between 2010 and 2014
was repeated within the data for each sex. The results
Shewa Basharati¹,
Michael Ardagh1,2, suggest that the total injury burden was positively
Joanne Deely1,3, associated with both the intensity of shaking and size
Nicholas Horspool⁴, and density of the exposed population. The localities
David Johnston⁵, where most injuries occurred suggest that where people
Shirley Feldmann-Jensen⁶, were at the time of shaking influenced their risk of injury.
Alieke Dierckx⁷,
Potential explanations for the sex disparity in number
Martin Than¹
of injuries are discussed.
¹ Canterbury District Health Board, Christchurch, New Zealand
² University of Otago, Christchurch, New Zealand Keywords: earthquakes, sex and age, scene of injury,
³ Lincoln University, Lincoln, New Zealand
⁴ GNS Science, Wellington, New Zealand
population exposed to shaking intensity, injury burden
⁵ Joint Centre for Disaster Research, Massey University,
Identifying the causes of injury and understanding who
Wellington, New Zealand
⁶ California State University, Long Beach, California, USA is most at risk during an earthquake will help to inform
⁷ Emergency Care Foundation, Christchurch, New Zealand interventions that reduce injury risk and improve rescue
© The Author(s) 2020. (Copyright notice) and medical strategies. New Zealand is a country of
Author correspondence: 5 million people, located in the south-western Pacific
Joanne Deely, Ocean, consisting of two main islands which lie
Canterbury District Health Board, along a tectonic plate boundary that forms part of the
Christchurch,
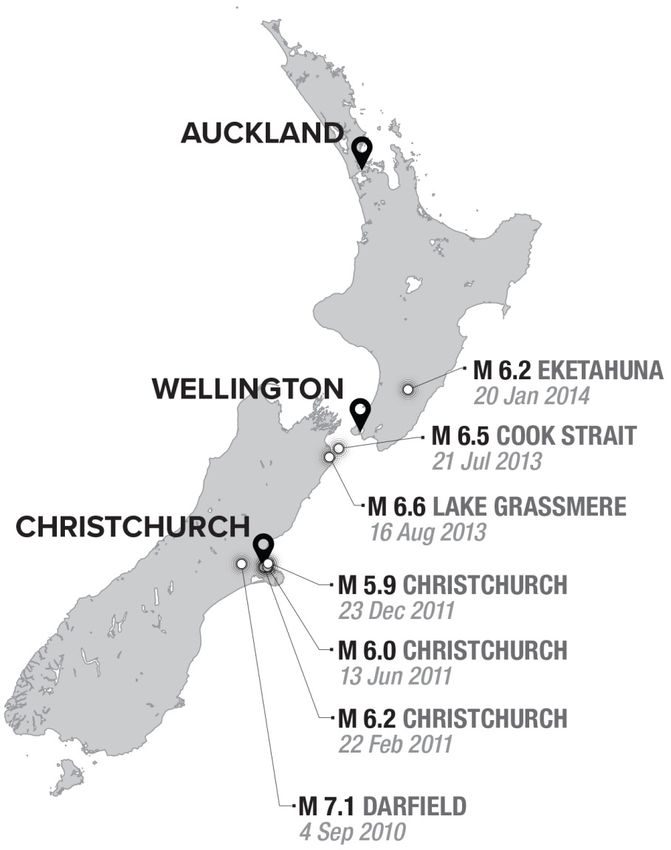
“Pacific ring of fire”. Both islands suffered some major
New Zealand.
Email: joanne.deely@cdhb.health.nz earthquakes and aftershocks between 2010 and 2014
URL: http://trauma.massey.ac.nz/issues/2020-1/AJDTS_24_1_Basharati.pdf
(see Figure 1).
Abstract
This study compared the populations exposed to
different shaking intensities of recent New Zealand
earthquakes with injury burden, demography, and scene
of injury. The population exposed to each earthquake
was approximated by overlaying estimates of ground
shaking with models of day and night population
distributions. Injury data from all earthquakes and
their aftershock periods were analysed for patient
age and sex, location, scene of injury, and date of
injury. An association was found between population
exposed to shaking intensity and injury burden. The
total injury burdens for each earthquake were: 2,815
(Darfield, 2010); 9,048 (Christchurch, February 2011);
2,057 (Christchurch, June 2011); 1,385 (Christchurch,
December 2011); 106 (Cook Strait, 2013); 166
(Grassmere, 2013); and 49 (Eketahuna, 2014). All
earthquakes injured approximately twice as many
females as males. Most people who were injured were
in the age range of 40-59 years. Two-thirds of injuries
occurred at home, followed by 14% in commercial Figure 1. Epicentres of New Zealand earthquakes from 2010 to
locations and 6.5% on roads and streets. This pattern 2014. M = Magnitude.
65
trauma.massey.ac.nzBasharati et al. Australasian Journal of Disaster and Trauma Studies
Volume 24, Number 1
Table 1.
Summary of New Zealand earthquakes from 2010 to 2014.
Earthquakes
Details Darfield Chch-Feb-11 Chch-Jun-11 Chch-Dec-11 Cook Strait Grassmere Eketahuna
Locality Darfield Christchurch Christchurch Christchurch Seddon Seddon Eketahuna
Date 4/9/10 22/2/11 13/6/11 23/12/11 12/07/13 16/8/13 20/1/14
Time 4:35 12:51 14:20 15:18 17:09 14:31 15:52
Day Sat Tues Mon Fri Fri Fri Mon
Magnitude 7.1 6.2 6.0 5.9 6.5 6.6 6.2
PGA 1.26g 2.2g 2.13g 1.0g 0.2g 0.75g 0.26g
Depth 10.8km 5.9 km 7km 7km 13km 8km 34km
Aftershock 4/9/10 – 22/2/11 – 13/6/11 – 23/12/11 – 21/07/13 – 16/07/13 – 20/01/14 –
Period 21/2/11 12/6/11 22/12/11 12/2015 15/08/13 12/2015 12/2016
Note. PGA = Peak ground acceleration; Dates are in day/month/year format.
In this paper, we present an overview of the seven of the afternoon. This earthquake caused minor to
most significant New Zealand earthquakes between moderate damage in Palmerston North, Eketahuna, and
September 2010 and February 2014 (see Table 1). The the wider Wellington region (EQC, 2018).
major Darfield earthquake (2010) caused extensive
Johnston et al. (2014) and Ardagh et al. (2012; 2016)
damage to many older brick and masonry buildings in
reported injuries from the Darfield 2010 and Christchurch
the Canterbury region, including Christchurch City. There
(22nd February 2011) earthquakes. These three studies
was a significant number of injuries associated with this
noted a disproportionate number of females injured
event (Gledhill, Ristau, Reyners, Fry, & Holden, 2011;
compared with males, and that most people injured were
Johnston et al., 2014). The Darfield earthquake initiated
in the age range 40-59 years. Although most injuries
a period of continuous local seismic activity, which
occurred at home (Ardagh et al., 2016), Johnston et
included three other major earthquakes (aftershocks)
al. (2014) also reported that most people were injured
close to Christchurch City. The most significant occurred
while moving during the Darfield earthquake, but most
on the 22nd of February 2011. This earthquake led to 185
were injured while stationary during the Christchurch
deaths and thousands of injuries (Ardagh et al., 2012;
earthquake. These studies concluded that where
Johnston et al., 2014). Destruction, including property
people were, what they were doing, and their actions
damage and liquefaction, was widespread (Kaiser et
during earthquake shaking influenced their risk of
al., 2012). The Christchurch central business district
injury. To build on this previous research, our study had
(CBD) was significantly damaged with two multi-storey
two objectives. Firstly, we compared the Darfield and
buildings collapsing (Ardagh et al., 2012). The other two
Christchurch (22nd February 2011) earthquake data
significant Christchurch-based earthquakes that caused
over their total aftershock periods with similar data from
injury in Canterbury occurred on the 13th of June 2011
the five more recent earthquakes presented in Table
and the 23rd of December 2011 (Table 1). 1 to determine if the distributions found in the earlier
Later, on the 21 st of July 2013, the Cook Strait studies are common phenomena. The other important
earthquake (also known as the Seddon earthquake) objective of this study was to compare the populations
struck 20 kilometres east of the town of Seddon in the exposed to different shaking intensities with injury rates,
Marlborough region of the South Island (Table 1; USGS, demography, and scene of injury. Such a comparison
2016a). This earthquake caused moderate damage in was not made in previous research but will contribute
the wider Marlborough area and Wellington (the capital important information for understanding earthquake
city, 55 kilometres north of the epicentre; see Figure 1). injury burden.
Six weeks later, the Lake Grassmere area was struck
by an earthquake 10 kilometres south-east of Seddon Methods
(Table 1; USGS, 2016b).
The population exposed to each earthquake was
On Monday the 20 of January 2014, an earthquake
th
approximated by overlaying estimates of ground
struck the Eketahuna area in the south-east of New shaking from ShakeMap (Horspool, Chadwick, Ristau,
Zealand’s North Island (GeoNet, 2014) in the middle Salichon, & Gerstenberger, 2015) with a model of
66
trauma.massey.ac.nzAustralasian Journal of Disaster and Trauma Studies Basharati et al.
Volume 24, Number 1
population distribution for day and night populations Results
within the RiskScape Multi-hazard Impact Modelling
Populations Exposed to Different Intensities of
software (Schmidt et al., 2011). The injury data from
Shaking
all earthquakes and their aftershock periods were
obtained from the “Researching the Health Impacts The estimated populations exposed to different
intensities of shaking are presented in Table 3 with
of Seismic Events” (RHISE) database (housed at the
definitions for the Modified Mercalli Intensity (MMI) scale
Canterbury District Health Board, Christchurch, New
given in Table 2. The results for populations exposed
Zealand). The database was established after the 22nd
to shaking reflect severity of shaking and proximity of
of February, 2011, Christchurch earthquake with patient
epicentres to large urban areas. The highest magnitude
data from the Canterbury District Health Board (CDHB)
Darfield earthquake, with a rurally located epicentre 40
live warehouses of patient data and the New Zealand
kilometres from Christchurch City, was felt over a wide
Accident Compensation Corporation (ACC) client area. More than 400,000 people experienced extreme
datasets (Ardagh et al., 2016). The CDHB provides free and severe intensity shaking and about 50,000 people
health care to the region while the ACC scheme provides experienced moderate to strong intensity shaking.
free health care for people injured in accidents in New
During the Christchurch, February 2011, earthquake,
Zealand. Each episode of care requires the completion
more than 300,000 individuals suffered extreme intensity
of details to progress funding for the claim. The RHISE
shaking and more than 200,000 experienced moderate
database combines and links patient data from both
to severe intensity shaking. During each of the latter
sources and has continued to be updated following each
two Christchurch 2011 earthquakes, 500,000 people
new earthquake event. Consequently, a comprehensive
experienced moderate to severe shaking intensities,
database has been developed.
though none experienced the extreme shaking
The RHISE database contained data from 15,697 intensities felt during the earlier 2011 earthquake. In
patients injured on the day of each earthquake and the case of the June earthquake, more than 300,000
during the aftershock periods presented in Table 1. individuals experienced severe shaking and more
Of the total patients, 71 were excluded from the study than 170,000 experienced strong shaking whereas the
because they were not earthquake-related, leaving populations were more evenly spread over the moderate
15,626 people injured in the seven earthquakes. Each to severe shaking intensities during the December event.
patient’s data contain demographic information and a During each of the three other earthquakes examined
description of injuries. The following data were analysed: in this study (Cook Strait, Grassmere, and Eketahuna)
patient age and sex, scene of injury, and date of injury. with rurally-located epicentres, more than 2,000
Table 2.
Modified Mercalli Intensity (MMI) scale for New Zealand context.
MMI Intensity Description
1 unnoticeable Barely sensed only by a very few people.
2 unnoticeable Felt only by a few people at rest in houses or on upper floors.
3 weak Felt indoors as a light vibration. Hanging objects may swing slightly.
4 light Generally noticed indoors, but not outside, as a moderate vibration or jolt.
Light sleepers may be awakened. Walls may creak, and glassware, crockery, doors, or windows rattle.
5 moderate Generally felt outside and by almost everyone indoors.
Most sleepers are awakened, and a few people alarmed. Small objects are shifted or overturned, and pictures
knock against the wall. Some glassware and crockery may break, and loosely secured doors may swing open
and shut.
6 strong Felt by all. People and animals are alarmed, and many run outside. Walking steadily is difficult.
Furniture and appliances may move on smooth surfaces, and objects fall from walls and shelves.
Glassware and crockery break. Slight non-structural damage to buildings may occur.
7 severe General alarm. People experience difficulty standing. Furniture and appliances are shifted.
Substantial damage to fragile or unsecured objects. A few weak buildings are damaged.
8 extreme Alarm may approach panic. A few buildings are damaged, and some weak buildings are destroyed.
Note. This table is adapted from Dowrick and Rhoades (2011).
67
trauma.massey.ac.nzBasharati et al. Australasian Journal of Disaster and Trauma Studies
Volume 24, Number 1
Table 3.
Estimated population exposed (in thousands) to different levels of shaking.
Shaking Intensity Level
MMI5 MMI6 MMI7 MMI8+ Total
Event (Moderate) (Strong) (Severe) (Extreme)
Darfield-Sep-10 31 24 202 210 467
Chch-Feb-11 98 54 68 310 530
Chch-Jun-11 41 178 305 0 524
Chch-Dec-11 145 231 178 0 554
C. Strait-Jul-13 456 35 1 0 492
Grassmere-Aug-13 237 2 2 0 241
Eketahuna-Jan-14 98 157 1 0 256
Note. The MMI scale is defined in Table 2. Chch = Christchurch; C. Strait = Cook Strait.
individuals experienced severe intensity shaking, but and December Christchurch events which had maximum
none experienced extreme levels of shaking. In the case MMI intensities of 7. The populations which experienced
of the Cook Strait event, 35,000 people in rural towns MMI intensities of less than 6 had injury burdens an order
of the Marlborough region experienced strong intensity of magnitude less than the Canterbury (Christchurch
shaking and more than 450,000 people in Wellington and Darfield) events.
City (further from the epicentre) likely experienced The earthquakes where more than 300,000 people
moderate intensity shaking (Table 3). The pattern was experienced severe (MMI7) or extreme (MMI8+)
similar for the Lake Grassmere earthquake except that shaking intensities had the highest injury burden rate
approximately half the population size was affected by proportional to the estimated population exposed
shaking. In the case of the deeper seated Eketahuna to shaking (Table 4). These included the Darfield
earthquake, more than 150,000 people felt strong and February Christchurch events. The February
shaking and more than 100,000 experienced moderate Christchurch extreme earthquake shaking occurred
shaking. during the middle of the day, affecting 310,000 people
and injuring approximately 9,000. Although severe and
Injury Burden
extreme shaking affected more than 400,000 people in
Figure 2 relates the maximum MMI intensity of the Darfield event, this earthquake happened in the early
earthquakes affecting populations of more than 150,000 hours of the morning and fewer than 3,000 were injured
to total injury burden. This figure suggests a relationship in total. In line with the February event, the injury rate
between the size of the population exposed to different for the June and December Christchurch earthquakes
shaking intensities and injury burden. The high intensity reflects the high numbers of people affected by strong
February Christchurch and Darfield earthquakes (MMI and severe shaking intensities during the daytime.
8+) had the highest injury burdens, followed by the June
The much lower total injury burden from the lower
intensity Cook Strait and Grassmere events compared
to the higher intensity Darfield and Christchurch
earthquakes (see Figure 2) suggests a relationship
between population size/shaking intensity and total
numbers injured. This relationship did not hold for the
deep epicentre Eketahuna earthquake, which had a
similar total affected population size to that of Grassmere
(256,000 vs 241,000), but had the smallest injury burden
(N = 49) of the earthquakes considered here.
Demographic Distribution
Figure 2. Comparison of the maximum MMI intensity (bars) that Gender. The data suggest that most earthquakes injured
affected populations >150,000, and total injury burden; (population approximately twice as many females as males. In the
(thousands), total injury burden).
68
trauma.massey.ac.nzAustralasian Journal of Disaster and Trauma Studies Basharati et al.
Volume 24, Number 1
case of the Cook Strait and Eketahuna earthquakes, the ages of 0-9 years were the least injured, followed
which had the lowest injury burdens of 106 and 49 by teenagers, young adults, and finally adults 30-39
respectively, the disparity between females and males years (Table 2). These trends held for the Grassmere
was largest. The total injury burdens were: Darfield, 1,863 earthquake, but the lower injury burdens in the Cook
females versus 952 males; Christchurch (February), Strait and Eketuna earthquakes means that trends were
5,960 females versus 3,088 males; Christchurch not clear. In the Darfield, Christchurch, Grassmere, and
(June), 1,417 females versus 640 males; Christchurch Eketahuna earthquakes, the sex disparity held for all
(December), 978 females versus 407 males; Cook age groups except children. However, more female than
Strait, 82 females versus 24 males; Grassmere, 112 male adults over the age of 40 were injured during the
females versus 54 males; and Eketahuna, 39 females Cook Strait event.
versus 10 males.
Scene of Injury
Age. Table 4 also presents the injury rate in the estimated The scenes of injury for all the earthquakes under study
population exposed to shaking stratified by age. Where combined are presented in Table 5. Approximately two-
the total injury rate for an earthquake was lower than 250 thirds of injuries occurred at home, followed by 14% in
people per 100,000 exposed to shaking (i.e., the Darfield commercial locations and 6.5% on roads and streets.
and three Christchurch events), most people who were This pattern was repeated within the data for each sex.
injured were in the age ranges 40-49 years and 50-59 Twice as many females as males were injured in all
years. Older people had the next highest percentage of locations, except industrial places, farms, and data with
injuries (60-69 years and 70+ years). Children between no scene of injury.
Table 4.
Injury rate per hundred thousand of the total estimated population exposed to shaking.
Age range
Total 0–9 10–19 20–29 30–39 40–49 50–59 60–69 70+
Darfield-Sep-10
Male 204 3 8 15 31 51 45 28 23
Female 399 3 15 25 65 95 85 60 52
Total 603 6 23 39 96 146 129 88 75
Chch-Feb-11
Male 583 12 27 57 88 123 125 80 71
Female 1125 11 45 114 165 233 233 158 166
Total 1707 23 72 171 253 356 357 238 236
Chch- Jun-11
Male 122 2 5 10 17 28 25 19 16
Female 270 3 10 22 37 54 58 45 42
Total 393 5 15 32 54 82 83 64 57
Chch-Dec-11
Male 73 1 3 5 7 14 17 13 13
Female 177 2 4 11 18 37 38 34 34
Total 250 3 7 16 25 50 55 47 47
C. Strait-Jul-13
Male 5 0 0 1 0 1 1 1 1
Female 17 0 1 3 3 3 3 2 2
Total 22 0 1 3 3 4 4 3 3
Grassmere-Aug-13
Male 22 1 2 2 3 4 5 2 3
Female 46 0 4 2 5 12 12 6 5
Total 69 2 6 4 8 16 17 8 8
Note. Data for Eketahuna not included as the low injury burden means injury rates per 100,000 are typically below 1.
69
trauma.massey.ac.nzBasharati et al. Australasian Journal of Disaster and Trauma Studies
Volume 24, Number 1
Table 5. which tends to be less in flexible-framed houses,
Scene of injury for all patients across all earthquakes.
and injuries (So & Spence, 2013).
Total Female Male
The similar injury rates within the age groups of
Claim Scene n (%) n (%) n (%)
each sex suggests that males and females of the
Home 10,076 (64.5) 6,846 (65.5) 3,230 (62.3)
same age had the same risk of injury during all the
Commercial Location 2,229 (14.3) 1,542 (14.8) 687 (13.3)
events. Nonetheless, the injury disparity between
Road/Street 1,012 (6.50) 648 (6.20) 364 (7.06)
the sexes and absence of it in children aged under
Industrial Place 358 (2.30) 159 (1.52) 199 (3.86)
10 years need further consideration. Ardagh et
School 235 (1.50) 175 (1.67) 60 (1.16)
al. (2016) reported similar age distributions of
Place of Recreation and Sport 196 (1.30) 139 (1.33) 57 (1.11)
injuries during the first 24-hours of response to
Place of Medical Treatment 64 (0.40) 51 (0.49) 13 (0.25)
the February Christchurch earthquake as that of
Farm 15 (0.10) 8 (0.08) 7 (0.14)
our study which considered all reported injuries
Other 1,394 (8.90) 857 (8.20) 537 (10.4)
following the event. In Ardagh et al.’s paper, the
Not Obtained 245 (0.30) 26 (0.25) 219 (4.25) largest proportions of casualties were in the
Total 15,824 (100) 10,451 (66.1) 5,373 (34.0) 40-49 years age group (21%) and 50-59 years
age group (20%). While Johnston et al. (2014)
Discussion reported similar age distributions for casualties of the
This study found a positive association between Darfield earthquake (40-49 years, 24%; 50-59 years,
population exposed to shaking intensity and the total 21%), they reported that injury burden of the February
injury burden of each of the seven earthquakes. Although Christchurch earthquakes was relatively evenly spread
most of the earthquakes considered in this study had across the 10-year age groups (0-59 years; 12.3%-
shallow epicentres, the size of the populations affected 14.7%). This discrepancy may be due to differences in
by different intensities of shaking varied depending on the periods over which the data were assessed in each
proximity of the epicentres to major cities or towns. study. Ardagh et al. (2016) assessed the injury burden
during the first 24 hours of response and Johnston et
The high injury burdens of all Christchurch earthquakes al. (2014) assessed burden (including casualties who
largely reflect daytime shaking. The February incurred injuries during clean-up) in the following five
Christchurch event exposed the largest population months.
to extreme shaking and led to the highest number of
The most likely place to be injured during the earthquakes
injuries, consistent with the findings of the ShakeMap
and aftershocks was at home. Ardagh et al. (2016)
Atlas which demonstrated a strong link between
reported that about 50% of total casualties during the first
population exposed to extreme shaking and injury and
24 hours after the Christchurch earthquake were injured
mortality rates (Allen et al., 2009). However, although it
at home. In the current study, this increased to more
was the highest magnitude earthquake with the second than 60% when looking at all seven earthquakes and
largest population exposed to extreme shaking, the their aftershocks periods together. Two-thirds (6,659) of
night-time Darfield event caused approximately one- the total injury burden from the February Christchurch
third the number of injuries as the February Christchurch earthquake occurred in the first 24 hours (Ardagh et al.,
event and no deaths. The data in this study therefore 2012). Ardagh et al. (2012) found slightly more people
suggest that the time of day at which an earthquake injured in the commercial and services industries during
occurs also impacts injury burden, supporting some this one specific event compared with our study looking
existing evidence (Johnston et al., 2014). Considering across multiple earthquakes; this difference is likely due
this, the Darfield earthquake would likely have resulted to differences in proximity of earthquake epicentres to
in many more injuries if it had occurred during day-light cities.
hours when more people were active. However, some Ardagh et al. (2016) reported that in the first 24 hours
of the credit for the low injury burden from the Darfield of the February 2011 earthquake approximately twice
earthquake can also be attributed to the Canterbury as many females as males were injured at home (2,390
region’s high proportion of flexible timber-framed houses versus 1,002) and close to three times as many females
(Quigley et al., 2010). Research demonstrates a positive as males injured in the commercial/service industries
association between shaking-induced building damage, (1,105 versus 444) and schools (106 vs 34). International
70
trauma.massey.ac.nzAustralasian Journal of Disaster and Trauma Studies Basharati et al.
Volume 24, Number 1
reports of earthquakes causing high mortality and injury 2007; Ellidokuz et al., 2005; He et al., 2011; Hu et al.,
numbers have found that the most important risk factors 2012; Mahue-Giangreco et al., 2001; Mulvey, Awan,
are the degree of damage to buildings and the location Qadri, & Maqsood, 2008; Rathore et al., 2007; Sami et
of individuals within buildings at the time of shaking al., 2009; Xie et al., 2008; Zhang, Li, Carlton, & Ursano,
(Ellidokuz, Ucku, Aydin, & Ellidokuz, 2005; Ramirez & 2009), while males tend to suffer more non-disaster
Peek-Asa, 2005). While our findings support Ardagh related injuries than females (Udry, 1998).
et al.’s conclusion that where people were and what
It is possible that the lower rates of injuries for males
they were doing influenced their risk of injury during
could be due to under-reporting of injuries among
earthquake shaking, as well as an apparent sex disparity
this demographic, an aligned tendency for females to
in reported injuries, Canterbury’s high proportion of
seek treatment more often than males (e.g., general
flexible timber-framed houses likely contributed to the
practice visits in New Zealand: Jatrana & Crampton,
low number of serious injuries and fatalities incurred
2009), or that a general, well-established difference in
during the Darfield and Christchurch events (excluding
average physical size and strength could mean that the
the February event) compared to similar international
same impacts which injured females sufficiently that
earthquakes (Ardagh et al., 2016; Ardagh et al., 2012;
reporting was necessary would not injure males to the
Johnston et al., 2014; Quigley et al., 2010).
same extent (Blue, 1993). Finally, the disparity in our
The high proportion of injuries that occurred at home study could also have been influenced by differences
and in commercial localities may also relate to what in behaviour between the sexes during earthquake
happened during shaking (Johnston et al., 2014). Close shaking. For example, it might be that males are more
to half of the total injuries in the Darfield earthquake likely to undertake protective actions during shaking.
occurred when people rushed about in darkness in their Future research could explore this idea to support more
homes during shaking in the early hours of the morning. education regarding securing objects to walls and other
In contrast, during the February Christchurch midday surfaces, and self-protective actions such as drop, cover,
earthquake, less than 20% of people were injured this and hold (see e.g., getthru.govt.nz). In particular, if there
way. Johnston et al. (2014) found that approximately is a sex difference in use of self-protective actions then
25% of both sexes tripped or fell during shaking and tailoring education campaigns to be more effective
approximately 10% were hit by projectiles. Most of for females may help to lower the injury rate for this
the hospitalised patients who were injured during the demographic in future earthquakes.
February Christchurch earthquake came from the central
business district (Ardagh et al., 2016). Conclusion
If more adult females than males were at home, working This study found a positive association between
in commercial areas, and teaching at schools, this population exposed to shaking intensity and the total
may partly explain the sex disparity. Many reports on injury burden from each of the seven earthquakes.
earthquake injury and mortality data evaluate samples Across the seven earthquakes, the size of the total
of patients treated in hospitals, including field hospitals, injury burdens appeared associated with the severity of
without including the multitude of minorly injured patients shaking experienced, which in turn could relate to the
(Amundson et al., 2010; Bozkurt, Ocguder, Turktas, & proximity of epicentres to major cities or towns as well
Erdem, 2007; Kreiss et al., 2010; Sami et al., 2009). as the time of day at which the earthquake occurred. As
Many reports also focus on subsets of injury types or an extension of this study, current work led by author NH
disease processes (Etienne, Powell, & Faux, 2010; He aims to develop a model that will predict the total injury
et al., 2011; Hu et al., 2012; Mahue-Giangreco, Mack, burden and short- and long-term social impacts of future
Seligson, & Bourque, 2001; Rathore et al., 2007). major earthquakes. The model is being developed by
Consequently, some studies report higher injury and combining data from Statistics New Zealand on baseline
mortality rates for females than males (Armenian, populations with social and health data from the RHISE
Melkonian, Noji, & Hovanesian, 1997; Chan et al., 2003; database. Our findings also align with those of Ardagh
Etienne et al., 2010; Liang et al., 2001; Peek-Asa, Kraus, et al. (2016) and Johnston et al. (2014) whereby more
Bourque, & Vimalachandra, 1998; Peek-Asa, Ramirez, females than males were injured in all events, most
Seligson, & Shoaf, 2003; Tanaka et al., 1998) and some people were injured in the age range 40-59 years, and
report the rate as equal for both sexes (Bozkurt et al., the most likely place to be injured during the earthquakes
71
trauma.massey.ac.nzBasharati et al. Australasian Journal of Disaster and Trauma Studies
Volume 24, Number 1
and aftershocks was at home. Future work specifically COMFORT. Lancet Neurology, 9, 461-463. doi: 10.1016/
educating females on protective action during shaking S1474-4422(10)70091-0
GeoNet. (2014). M 6.2 Eketahuna Mon, Jan 20 2014.
could reduce the proportion of females injured in future Retrieved from www.geonet.org.nz/quakes/region/
events and therefore also meaningfully reduce the wellington/2014p051675
overall injury burden of earthquakes. Gledhill, K., Ristau, J., Reyners, M., Fry, B., & Holden, C.
(2011). The Darfield (Canterbury, New Zealand) Mw 7.1
earthquake of September 2010: A preliminary seismological
Acknowledgements report. Seismological Research Letters, 82, 378-386.
This project was partially supported by QuakeCoRE, a He, Q., Wang, F., Li, G., Chen, X., Liao, C., Zou, Y., . . .
Wang, L. (2011). Crush syndrome and acute kidney injury
New Zealand Tertiary Education Commission-funded in the Wenchuan Earthquake. The Journal of Trauma
Centre. This is QuakeCoRE publication number 0431. and Acute Care Surgery, 70, 1213-1217. doi: 10.1097/
TA.0b013e3182117b57
Horspool, N. A., Chadwick, M., Ristau, J., Salichon,
References J., & Gerstenberger, M. C. (2015). ShakeMapNZ:
Allen, T. I., Wald, D. J., Earle, P. S., Marano, K. D., Hotovec, A. Informing post‐event decision making. In Proceedings
J., Lin, K., & Hearne, M. G. (2009). An Atlas of ShakeMaps of the New Zealand Society for Earthquake Engineering
and population exposure catalog for earthquake loss Conference, 369-376. Retrieved from www.nzsee.org.nz/
modeling. Bulletin of Earthquake Engineering, 7, 701–718. db/2015/Presentations/O-40.pdf
Amundson, D., Dadekian, G., Etienne, M., Gleeson, T., Hicks, Hu, Z., Zeng, X., Fu, P., Luo, Z., Tu, Y., Liang, J., … Qin, W.
T., Killian, D., . . . Miller, E. J. (2010). Practicing internal (2012). Predictive factors for acute renal failure in crush
medicine onboard the USNS COMFORT in the aftermath injuries in the Sichuan earthquake. Injury, 43, 613-618.
of the Haitian earthquake. Annals of Internal Medicine, doi: 10.1016/j.injury.2010.08.025
152, 733-737. doi: 10.7326/0003-4819-152-11-201006010- Johnston, D., Standring, S., Ronan, K., Lindell, M., Wilson,
00215 T., Cousins, J., … Bissell, R. (2014). The 2010/2011
Ardagh, M., Richardson, S., Robinson, V., Than, M., Gee, Canterbury earthquakes: Context and cause of injury.
P., Henderson, S., … Deely, J. (2012). The initial health- Natural Hazards, 73, 627-637. doi: 10.1007/s11069-014-
system response to the earthquake in Christchurch, New 1094-7
Zealand, in February, 2011. The Lancet, 379, 2109-2115. Kaiser, A., Holden, C., Beavan, J., Beetham, D., Benites, R.,
doi: 10.1016/S0140-6736(12)60313-4 Celentano, A., … Zhao, J. (2012). The Mw 6.2 Christchurch
earthquake of February 2011: Preliminary report. New
Ardagh, M., Standring, S., Deely, J., Johnston, D., Robinson,
Zealand Journal of Geology and Geophysics, 55, 67-90.
V., Gulliver, P., … Than, M. (2016). A sex disparity among
doi: 10.1080/00288306.2011.641182
earthquake victims. Disaster Medicine and Public Health
Preparedness, 10, 1-7. doi: 10.1017/dmp.2015.81 Kreiss, Y., Merin, O., Peleg, K., Levy, G., Vinker, S., Sagi, R., …
Ash, N. (2010). Early disaster response in Haiti: The Israeli
Armenian, H. K., Melkonian, A., Noji, E. K., & Hovanesian, field hospital experience. Annals of Internal Medicine, 153,
A. P. (1997). Deaths and injuries due to the earthquake 45-48. doi: 10.7326/0003-4819-153-1-201007060-00253
in Armenia: A cohort approach. International Journal of
Epidemiology, 26, 806-813. doi: 10.1093/ije/26.4.806 Liang, N. J., Shih, Y. T., Shih, F. Y., Wu, H. M., Wang, H. J.,
Shi, S. F., … Wang, B. B. (2001). Disaster epidemiology
Bozkurt, M., Ocguder, A., Turktas, U., & Erdem, M. (2007). The and medical response in the Chi-Chi earthquake in Taiwan.
evaluation of trauma patients in Turkish Red Crescent Field Annals of Emergency Medicine, 38, 549-555. doi: 10.1067/
Hospital following the Pakistan earthquake in 2005. Injury, mem.2001.118999
38, 290-297. doi: 10.1016/j.injury.2006.10.013
Mahue-Giangreco, M., Mack, W., Seligson, H., & Bourque, L. B.
Chan, C. C., Lin, Y. P., Chen, H. H., Chang, T. Y., Cheng, T. (2001). Risk factors associated with moderate and serious
J., & Chen, L. S. (2003). A population-based study on injuries attributable to the 1994 Northridge Earthquake, Los
the immediate and prolonged effects of the 1999 Taiwan Angeles, California. Annals of Epidemiology, 11, 347-357.
earthquake on mortality. Annals of Epidemiology, 13, 502- doi: 10.1016/S1047-2797(01)00220-4
508. doi: 10.1016/S1047-2797(03)00040-1
Mulvey, J. M., Awan, S. U., Qadri, A. A., & Maqsood, M. A.
Dowrick, D. J., & Rhoades, D. A. (2011). Spatial distribution (2008). Profile of injuries arising from the 2005 Kashmir
of ground shaking in characteristic earthquakes on the earthquake: The first 72 h. Injury, 39, 554-560. doi:
Wellington and Alpine Faults, New Zealand, estimated from 10.1016/j.injury.2007.07.025
a distributed source model. Bulletin of the New Zealand
Peek-Asa, C., Kraus, J. F., Bourque, L. B., Vimalachandra,
Society for Earthquake Engineering, 44, 1-18. doi: 10.5459/ D., Yu, J., & Abrams, J. (1998). Fatal and hospitalized
bnzsee.44.1.1-18 injuries resulting from the 1994 Northridge earthquake.
Ellidokuz, H., Ucku, R., Aydin, U. Y., & Ellidokuz, E. (2005). International Journal of Epidemiology, 27, 459-465. doi:
Risk factors for death and injuries in earthquake: Cross- 10.1093/ije/27.3.459
sectional study from Afyon, Turkey. Croatian Medical Peek-Asa, C., Ramirez, M., Seligson, H., & Shoaf, K. (2003).
Journal, 46, 613-618. Seismic, structural, and individual factors associated with
EQC. (2018). Eketahuna claims update. Retrieved from www. earthquake related injury. Injury Prevention, 9, 62-66.
eqc.govt.nz/news/eketahuna-claims-update Quigley, M., Van Dissen, R., Villamor, P., Litchfield, N., Barrell,
Etienne, M., Powell, C., & Faux, B. (2010). Disaster relief in D., Furlong, K., . . . Pedley, K. (2010). Surface rupture of
Haiti: A perspective from the neurologists on the USNS the Greendale fault during the Mw 7.1 Darfield (Canterbury)
72
trauma.massey.ac.nzAustralasian Journal of Disaster and Trauma Studies Basharati et al.
Volume 24, Number 1
earthquake, New Zealand: Initial findings. Bulletin of The
New Zealand Society for Earthquake Engineering, 43, 1-7.
Ramirez, M., & Peek-Asa, C. (2005). Epidemiology of traumatic
injuries from earthquakes. Epidemiologic Reviews, 27, 47-
55. doi: 10.1093/epirev/mxi005
Rathore, M. F., Rashid, P., Butt, A. W., Malik, A. A., Gill, Z. A.,
& Haig, A. J. (2007). Epidemiology of spinal cord injuries in
the 2005 Pakistan earthquake. Spinal Cord, 45, 658-663.
doi: 10.1038/sj.sc.3102023
Sami, F., Ali, F., Zaidi, S. H., Rehman, H., Ahmad, T., &
Siddiqui, M. I. (2009). The October 2005 earthquake in
Northern Pakistan: Patterns of injuries in victims brought
to the Emergency Relief Hospital, Doraha, Mansehra.
Prehospital and Disaster Medicine, 24, 535-539. doi:
10.1017/S1049023X00007470
Schmidt, J., Matcham, I., Reese, S., King, A., Bell, R.,
Henderson, R., … Heron, D. (2011). Quantitative multi-risk
analysis for natural hazards: A framework for multi-risk
modelling. Natural Hazards, 58, 1169-1192. doi: 10.1007/
s11069-011-9721-z
So, E., & Spence, R. (2013). Estimating shaking-induced
casualties and building damage for global earthquake
events: A proposed modelling approach. Bulletin of
Earthquake Engineering, 11, 347–363.
Tanaka, H., Iwai, A., Oda, J., Kuwagata, Y., Matsuoka, T.,
Shimazu, T., & Yoshioka, T. (1998). Overview of evacuation
and transport of patients following the 1995 Hanshin-Awaji
earthquake. Journal of Emergency Medicine, 16, 439-444.
doi: 10.1016/S0736-4679(98)00014-6
USGS. (2016a). M 6.5 - 46km ESE of Blenheim, New Zealand.
Retrieved from http://earthquake.usgs.gov/earthquakes/
eventpage/usb000iivv#general_summary
USGS. (2016b). M6.5 - 29km SE of Blenheim, New Zealand.
Retrieved from http://earthquake.usgs.gov/earthquakes/
eventpage/usb000j4iz#general_summary
Xie, J., Du, L., Xia, T., Wang, M., Diao, X., & Li, Y. (2008).
Analysis of 1856 inpatients and 33 deaths in the West
China Hospital of Sichuan University from the Wenchuan
earthquake. Journal of Evidence-Based Medicine, 1, 20-
26. doi: 10.1111/j.1756-5391.2008.00010.x
Zhang, L., Li, H., Carlton, J. R., & Ursano, R. (2009). The
injury profile after the 2008 earthquakes in China. Injury,
40, 84-86. doi: 10.1016/j.injury.2008.08.045
73
trauma.massey.ac.nzYou can also read