Modelling of strong motion generation areas for a great earthquake in central seismic gap region of Himalayas using the modified semi-empirical ...

Page created by Shawn Tucker
 
CONTINUE READING
Modelling of strong motion generation areas for a great earthquake in central seismic gap region of Himalayas using the modified semi-empirical ...
J. Earth Syst. Sci. (2019) 128:100                                                   
                                                                                             c Indian Academy of Sciences
        https://doi.org/10.1007/s12040-019-1126-5

        Modelling of strong motion generation areas for a great
        earthquake in central seismic gap region of Himalayas
        using the modified semi-empirical approach

        Sandeep1 , A Joshi2 , S K Sah1 , Parveen Kumar3 , *, Sohan Lal2 and Kamal2
        1
          Department of Geophysics, Banaras Hindu University, Varanasi, India.
        2 Department  of Earth Sciences, Indian Institute of Technology Roorkee, Roorkee, India.
        3 Wadia Institute of Himalayan Geology, Dehradun, India.

        *Corresponding author. e-mail: sainiparveen.saini@gmail.com

        MS received 1 February 2018; revised 15 September 2018; accepted 19 September 2018;
        published online 2 April 2019

        Over the past decades, strong motion generation areas (SMGAs) have received significant attention in
        the modelling of high-frequency records. Herein, we propose the source model for a scenario earthquake
        (Mw 8.5) in the central seismic gap region of Himalayas. On the rupture plane, three SMGAs have
        been identified. Further, SMGA parameters are evaluated using available empirical relations. The
        spatiotemporal distribution of aftershocks is utilised to locate these SMGAs on the rupture plane.
        Further, the modified semi-empirical technique (MSET) is used to simulate the strong motion records.
        It has been observed that the study area can expect peak ground acceleration of >100 cm/s2 and its
        distribution is mainly affected by the location of nucleation point in the rupture plane. Furthermore, the
        estimated peak ground acceleration (PGA) values are comparable with the earlier studies in the region.
        This confirms the robustness of generated rupture model with three SMGAs and the reliability of MSET
        to simulate high-frequency records.
        Keywords. Central seismic gap; semi-empirical; SMGA; 1991 Uttarkashi earthquake.

        1. Introduction

        Fifty million years ago, the collision between the        the great 1905 Kangra earthquake and 1934 Bihar
        Eurasian and Indian plates resulted into the rise         earthquake mainshocks (figure 1). They suggested
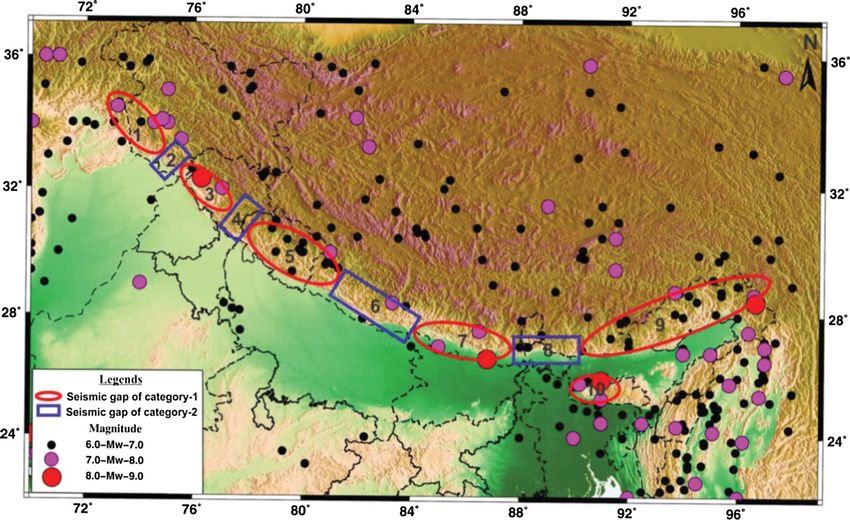
        of Himalayas. Over the past two centuries, four           that the CSG can be a possible zone for two future
        earthquakes of magnitude above 8 have occurred            great earthquakes (Mw ≥ 8). Meanwhile, Bilham
        in the Himalayan belt and no great earthquake             et al. (2001) also predicted a future earthquake
        had occurred since 1950 (Bilham 1995; Khattri             (Mw ≥ 8) based on the strain accumulation study.
        1999). However, the major portion of the converg-         Recently, Srivastava et al. (2015) demonstrated
        ing plate boundary remains unruptured. Therefore,         two different seismic gaps in the Himalayan region
        Khattri and Tyagi (1983) and Khattri (1987) have          by systematically studying the data from differ-
        described three seismic gaps along the Himalayan          ent sources. In seismic gap category 1, earthquake
        belt based on the seismicity pattern of the region.       of magnitude ≥8 has occurred and could reoc-
        The central seismic gap (CSG) is the longest one          cur. In seismic gap category 2, earthquakes with
        that stretches between the epicentral locations of        magnitude
Modelling of strong motion generation areas for a great earthquake in central seismic gap region of Himalayas using the modified semi-empirical ...
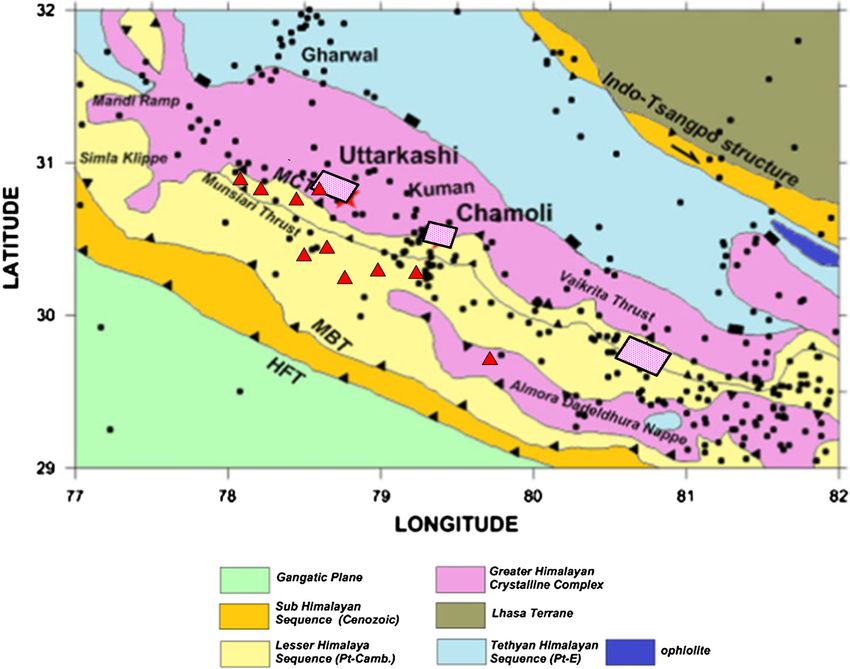
100    Page 2 of 12                                                                J. Earth Syst. Sci. (2019) 128:100

               1905 Kangra                Study Area
                Earthquake
                                           Ce
                                             ntr
                                                al
                                                Se
                                                  ism
                                                     ic G
                                           1916          ap
                                         Earthquake
                                                       M
                                                         CT
                                                      MB
                                                        T

                                                              1934 Bihar Nepal
                                                                 Earthquake

Figure 1. Stretch between the great 1905 Kangra earthquake and the 1934 Bihar earthquake shows the identified CSG
(Khattri 1987). Dotted rectangle shows the study area; solid rectangle represents the possible location of the rupture plane
for Mw 8.5 magnitude earthquake in CSG (Yu et al. 1995). Seismicity shown in figure is for the time periods of 1505–2011
(map modified after Kayal 2014; Srivastava et al. 2015).

as shown in figure 1. The major portion of the                       In this context, the semi-empirical technique
Himalayas in the Uttarakhand region lies in cat-                 (Midorikawa 1993) has been developed as a power-
egory 1 seismic gap and prone to an earthquake                   ful tool that effectively simulates the strong motion
of magnitude >8.0 (figure 1). This region com-                    records. In this technique, aftershock records have
prises many large hydroelectric power plants and                 been successfully replaced with the envelope func-
hence requires detailed examination of the seis-                 tion of time records. Therefore, this paper demon-
mic hazard. For this purpose, the estimation of                  strates the application of modified semi-empirical
earthquake engineering parameters such as peak                   technique (MSET) to model SMGAs in the rupture
ground motion values using simulated records is                  plane of great earthquake in the CSG region.
desirable. Using the specific source patch models,
strong motion records can be successfully mod-
elled. These patches with high slip rate along with              2. Geology and seismotectonics
the rupture plane are termed as strong motion
generation areas (SMGAs) (Miyake et al. 2003).                   The Kumaon and Garhwal regions of Himalayas
Many research groups such as Miyake et al. (1999,                are the two most putative sites of future dev-
2001, 2003), Kamae and Kawabe (2004), Miya-                      astating earthquakes. The high seismicity and
hara and Sasatani (2004), Suzuki and Iwata (2007),               active thrust system demonstrated that the Main
Takiguchi et al. (2011), Kurahashi and Irikura                   Boundary Thrust (MBT) and Main Central Thrust
(2011) and Asano and Iwata (2012) have suc-                      (MCT) are the most significant tectonic features of
cessfully simulated strong motion records using                  the above regions. High-grade metamorphic crys-
empirical Green’s function technique and rupture                 talline rocks occurred in the north of MCT while
model incorporating SMGAs. However, the above                    the brittle fracture characterised MBT (figure 2).
approach is quite reliable but the requirement of                However, several research groups have contradicted
aftershock records is a primary obstacle.                        the above view on seismotectonics of Himalayas.
J. Earth Syst. Sci. (2019) 128:100                                                           Page 3 of 12    100

                              PURO
                                   BARK BHAT
                                    UTTA
                                       GHAN
                                            RUDR
                                     TEHR
                                         SRIN  KARN

                                                          KOSA
                                                                               1916 Indo Nepal
                                                                                 Earthquake

Figure 2. Geological and seismicity map of the Kumaon and Garhwal Himalaya along with 10 recording stations (red
triangle). Three rectangles are the rupture planes (Joshi 2004; Wells and Coppersmith 1994) of the 1916 Indo Nepal
(Mw 7.0), 1991 Uttarkashi (Mw 6.8) and 1999 Chamoli (Mw 6.5) earthquakes in this region. Black dots represent the
epicentre of the earthquakes of Mw > 4. MCT, Main Central Thrust; MBT, Main Boundary Thrust; HFT, Himalayan
Frontal Thrust (map modified after Chopra et al. 2012).

For instance, Ni and Barazangi (1984) proposed            standard (BIS) has subdivided India into four
that the MCT is less active than the MBT and sug-         seismic zones – II, III, IV and V. Seismic zones II
gested other adjacent thrusts in the Himalayan arc.       and V are the lowest and highest earthquake prone
On the other hand, Seeber et al. (1981) postulated        areas, respectively. The Uttarakhand state falls in
that seismicity is mostly concentrated between the        between the seismic zones IV and V, and hence,
MBT and MCT and the earthquakes of interme-               it is referred as high earthquake prone area. More-
diate magnitude are usually occurred on a steeply         over, Global Seismic Hazard Assessment Program
dipping basement thrust of MCT. According to the          (GSHAP) data revealed that the state of Uttarak-
IMD catalogue (2012), 11 earthquakes of magni-            hand falls in a region of high to very-high seismic
tude between 6 and 7 were reported in the western         hazard. However, Joshi and Mohan (2010) reported
part of CSG. This comprises 1916 Indo Nepal               the assessment of seismic hazards for moderate
(Mw 7.0), the 1991 Uttarkashi (Mw 6.8) and the            earthquakes in Himalayas using the deterministic
1999 Chamoli (Mw 6.5) earthquakes. The rupture            approach. Bhatia et al. (1999) identified two source
planes of aforementioned earthquakes have been            zones of M7.5 earthquakes in Himalayas. Further-
shown in figure 2.                                         more, Nath et al. (2008) postulated that the ground
  On the basis of intensity sustained from past           motion of a scenario earthquake (Mw 8.5) has 10%
earthquakes, the IS:1893 (2002) Bureau of Indian          exceedance probability for the next 50 yrs. Over
100    Page 4 of 12                                                        J. Earth Syst. Sci. (2019) 128:100

the past decades, this region has also witnessed          the rupture length and width, respectively. The
enormous seismicity (figure 2).                            correction function F (t) is represented as follows:

                                                              F (t) = δ(t) + [(N − 1)/TR (1 − exp(−1))]
3. Methodology                                                        × exp(−t/TR ),                    (3)

In this paper, the MSET pioneered by Midorikawa           where δ (t) denotes the delta function, N represents
(1993) has been used to simulate strong motion            the total number of subfaults along the rupture
records (Sandeep et al. 2014b). Over the past             length or width and TR is the rise time of the target
decades, many researchers have successfully used          earthquake.
the above-mentioned technique in simulating strong          However, this technique demands appropriate
motions (e.g., Joshi and Patel 1997; Kumar et al.         windowing of the corrected simulated records. In
1997; Joshi et al. 1999, 2001, 2012a, b, 2014,            this regard, Kameda and Sugito (1978) suggested
2015; Joshi 2001, 2004; Joshi and Midorikawa              the functional form of acceleration envelope eij (t),
2004; Sandeep et al. 2014a, b, 2015, Sandeep et al.       which was further modified by Joshi (2004). The
2017a, b, c). In the MSET technique, the rupture          multiplication of corrected simulated acceleration
plane of the target earthquake is subdivided into         recorded with envelope function eij (t) generates the
equal area grids and called as subfaults. The divi-       final acceleration record acij (t) as follows:
sion is governed by self-similarity laws, suggested
by Aki (1967) and later modified by Kanamori                              acij (t) = eij (t) · Aij (t)         (4)
and Anderson (1975). After several years, Boore
(1983) described the acceleration spectra A(f, R)         and the envelope function eij (t) is described as
as follows:                                               follows:

         A (f, R) = CS (f ) D (f ) F (f, R) ,      (1)            eij (t) = Tss (t/Td ) · exp (1 − t/Td ) ,   (5)

                                                          where Td and Tss represent the duration parameter
where C is a constant scaling factor, S(f ) and           and transmission coefficient, respectively.
D(f ) are the source acceleration spectrum (Brune            The summation of all acceleration records acij (t)
1970) and attenuation of high frequencies, respec-        released from different subfaults in different time
tively, and F (f, R) represents the attenuation           periods tij delivers the final simulated acceleration
factor (Boore 1983).                                      records Ac(t) for target earthquake and is given as
   The present technique entails the multiplication       follows:
of theoretical filters proposed by Boore (1983)
                                                                                N 
                                                                                 N
with band limited spectrum and finite duration
white Gaussian noise. The above-mentioned out-                        Ac(t) =             acij (t − tij ).    (6)
                                                                                i=1 j=1
come obtains the acceleration spectra for each
subfault, which correspond to acceleration records
in the time domain. Due to the difference between            In recent years, Sandeep et al. (2014a) modified
the slip duration of the target and small earthquake      the above technique and successfully used to sim-
(subfaults), these acceleration records need to be        ulate the strong motion for the 1991 Uttarkashi
corrected and thus combining the earlier simulated        earthquake in the western part of CSG. In this
records aij (t) with correction function F (t).           paper, the same approach has been exploited to
   The corrected acceleration records Aij (t) are gen-    simulate strong motion results for the scenario
erated by combining the earlier simulated records         earthquake of magnitude 8.5 in the CSG region.
aij (t) with the correction function F (t) (Irikura and
Kamae 1994; Irikura et al. 1997) as follows:              4. Data

                                                          In this work, the dataset from three different
               Aij (t) = F (t) × aij (t),          (2)
                                                          research papers was used to locate the position of
                                                          responsible rupture plane and SMGAs within it.
where Aij (t) is the corrected acceleration record        The 1991 Uttarkashi earthquake prompted Kayal
and i and j show the subfault position along              et al. (1995) to install a temporary microearthquake
J. Earth Syst. Sci. (2019) 128:100                                                                                                        Page 5 of 12      100

Table 1. Details of three different data sets used in the present study.
                                                                        Total                                       Depth
                                                                      recorded                                      range
Network                                               Time period      events                  Magnitude             (km)                        Source
Temporary microearthquake                           2 November to       124                      2.5–6.8              ≤26                  Kayal et al. (1995)
 seismograph network                                 4 December
                                                     1991 (33 days)
USGS seismograph network                            1973–2014             50                     2.2–5.5              ≤30                        USGS
                                                                                                                                         https://www.usgs.gov/
Strong motion station network                       2006–2014           110                      2.5–5.4              ≤31                Kumar et al. (2015a, b)
 seismicity project MoES, GoI.

                                           31.5                                                                      Legend
                                                                                                                         USGS

                                                                                Ut t                                     Kayal

                                                                                    a ra                                 Major Events
                                                                                                                         E.Sc. Events
                                                                                           kh
                                                  Shimla                                        an
                                            31                                                       d
                                                                          1991
                                                                        Uttarkashi
                                                                                                24
                                                                                                  0k
                                                                                                    m
                                           30.5
                                                                                      1999
                           Latitute (0N)

                                                                                     Chamoli             MC
                                                                                                              T
                                            30

                                                                                                                           km
                                                                                     MB

                                                                                                                         80
                                           29.5                                            T

                                            29
                                                                                                                   Nepal

                                           28.5
                                              77                78           79                               80                    81
                                                                      Longitude (0E)

Figure 3. Estimated source model with three SMGAs for the probable great earthquake (Mw 8.5) in CSG. Solid and hollow
circles are the events located by Kayal et al. (1995) and Department of Earth Sciences, Indian Institute of Technology
Roorkee, in this region. Solid and hollow stars show the events from USGS and three major events in the region. Dimension
of the total rupture area is taken after Yu et al. (1995). (Map after Mukhopadhyay et al. 2011.) MCT, Main Central Thrust;
MBT, Main Boundary Thrust; MFT, Main Frontal Thrust.

network in the region. A total of 124 after-                                the period 1973–2014 and were also incorporated
shocks were recorded at this microearthquake                                in the present study (https://www.usgs.gov/). A
network and were used for the present study                                 brief description and spatial distribution of these
(Kayal et al. 1995).                                                        events are represented in table 1 and figure 3,
  Under a seismicity project funded by the                                  respectively.
Ministry of Earth Sciences, Government of India,
a network of 14 stations in the highly moun-
tainous terrain of the Kumaon Himalaya was                                  5. Rupture model for scenario earthquake
installed. These work stations are maintained by                               in CSG
the Department of Earth Sciences, Indian Insti-
tute of Technology Roorkee. A total of 110 events                           Yu et al. (1995) proposed a rupture plane of
were recorded on this network during 2006–2014                              dimensions 240 km × 80 km for a scenario earth-
and were included in this work. In addition, USGS                           quake having a magnitude 8.5 in the CSG region
recorded 50 events in the same region during                                and was used in the present study. However, other
100                           Page 6 of 12                                                                                                          J. Earth Syst. Sci. (2019) 128:100

Table 2. Source parameters of SMGAs identified in the present study.
SMGAs                                                        N                       Strike                      Dip                          Length (km)          Width (km)               M0 dyne cm
References                                    Kanamori and                          Yu et al. (1995) (suggested                               Wells and Coppersmith                        CMT Harvard;
                                               Anderson (1975)                       for great earthquake)                                     (1994)                                         USGS
SMGA1                                                 5                                317◦              6◦                                        48            36                         0.8 × 1026
                                                                                          ◦
SMGA2                                                 4                                317               6◦                                        44            32                         7.77 × 1025
                                                                                          ◦
SMGA3                                                 4                                317               6◦                                        45            32                         8.25 × 1025
N : number of subfaults.

Table 3. Velocity model (Yu et al. 1995) of the region.                                                              different empirical relations. Wyss (1979) postu-
Thickness                                                      Vs                                   Density
                                                                                                                     lated the magnitude–rupture area relation that
(km)                                                         (km/s)                                 (kg/m3 )         successfully predicted the earthquake of magnitude
                                                                                                                     8.43 for the above suggested rupture dimensions.
0.4                                                              2.00                                 1800           The current and past seismicity of the Himalaya
1.0                                                              2.86                                 2400
                                                                                                                     region demonstrated that the rupture plane is
15.0                                                             2.97                                 2600
                                                                                                                     placed in the north of MBT. Therefore, we utilised
30.0                                                             3.43                                 2900
                                                                                                                     a northeast dipping fault at a depth of 18 km with
                                                                                                                     strike of 317◦ and dip of 14◦ for this scenario earth-
                                                                                                                     quake (Yu et al. 1995). Considering the surface
research groups including Araya and Kiureghian                                                                       offsets along a fault and background seismicity of
(1988) and Wells and Coppersmith (1994) esti-                                                                        the region, the high slip rate area on the fault plane
mated 260 km × 80 km rupture dimensions using                                                                        can be determined (Irikura and Miyake 2011). In

    (a)                                                                                 (b)                                                           (c)
                                  BARK                           BHAT                               BARK                          BHAT                             BARK                        BHAT
                        300            PGA=252        1000              PGA=630           300            PGA=266      1000               PGA=520         300            PGA=112      300              PGA=178
                        150                            500                                150                          500                               150                         150
                          0                              0                                  0                            0                                 0                           0
Acceleration (cm/s2)

                       -150                           -500                               -150                         -500                              -150                        -150
                       -300                          -1000                               -300                        -1000                              -300                        -300

                                  GHAN                           KARN                               GHAN                          KARN                             GHAN                        KARN
                        500              PGA=400       300                PGA=197         500              PGA=402      300              PGA=212         500              PGA=240    300              PGA=332
                        250                            150                                250                           150                              250                         150
                          0                              0                                  0                             0                                0                           0
                       -250                           -150                               -250                          -150                             -250                        -150
                       -500                           -300                               -500                          -300                             -500                        -300

                                  KOSA                           PURO                               KOSA                          PURO                             KOSA                        PURO
                        300                            500                                300                           500                             1000                         300
                                       PGA=101                            PGA=439                        PGA=109                          PGA=430                       PGA=350                        PGA=102
                        150                            250                                150                           250                              500                         150
Acceleration (cm/s2)

                          0                              0                                  0                             0                                0                           0
                       -150                           -250                               -150                          -250                             -500                        -150
                       -300                           -500                               -300                          -500                            -1000                        -300

                                  RUDR                           SRIN                               RUDR                          SRIN                             RUDR                        SRIN
                        300                            300                                300                           300                              300                         300
                        150            PGA=210                          PGA=230                            PGA=203                   PGA=219                              PGA=310                 PGA=300
                                                       150                                150                           150                              150                         150
                          0                              0                                  0                             0                                0                           0
                       -150                           -150                               -150                          -150                             -150                        -150
                       -300                           -300                               -300                          -300                             -300                        -300

                                  TEHR                           UTTA                               TEHR                          UTTA                             TEHR                        UTTA
                        500                           1000                PGA=855         500                         1000               PGA=840         300                         300              PGA=197
                                           PGA=516                                                         PGA=535                                                        PGA=233
                        250                            500                                250                          500                               150                         150
                          0                              0                                  0                            0                                 0                           0
                       -250                           -500                               -250                         -500                              -150                        -150
                       -500                          -1000                               -500                        -1000                              -300                        -300
                              0       35       70            0       35       70                0       35      70            0       35       70              0       35      70          0       35      70
                                   Time (s)                       Time (s)                           Time (s)                      Time (s)                         Time (s)                    Time (s)

Figure 4. Simulated acceleration records for the probable great earthquake (Mw 8.5) at BARK, GHAN, KOSA, RUDR,
TEHR, BHAT, KARN, PURO, SRIN and UTTA stations assuming the epicentre of the probable great earthquake as the
location of nucleation point of: (a) SMGA1, (b) SMGA2 and (c) SMGA3.
J. Earth Syst. Sci. (2019) 128:100                                                                                                                            Page 7 of 12               100

the present study, three SMGAs were identified                                                 1000
                                                                                                                      Legend
                                                                                                                      Mainshock in SMGA1
based on three different clusters of 284 earthquake                                                                    Mainshock in SMGA2
                                                                                                                      Mainshock in SMGA3
events in the Himalaya region (figure 3). Each
cluster serves as different source of energy and

                                                           Peak Ground Acceleration (cm/s2)
                                                                                               750
possible location of SMGAs in the rupture plane.
These are modelled as SMGAs and termed as
SMGA1, SMGA2 and SMGA3. During a future
great earthquake, the actual location of SMGAs                                                 500
may alter, which directly influences the acceler-
ation results. However, dense GPS network may
provide better slip rates and absolute locations of
SMGAs. On the basis of self-similarity relations                                               250
(Kanamori and Anderson 1975), the rupture plane
of SMGA1, SMGA2 and SMGA3 was partitioned
into 5 × 5, 4 × 4 and 4 × 4 grids, respectively, as                                                      BARK GHAN KOSA RUDR TEHR BHAT KARN PURO SRIN UTTA NDL                CHD       HDW

shown in figure 3 and table 2. Event of Mw 5.4                                                    0
                                                                                                     0    1       2     3      4     5         6    7     8       9   10 11 12 13 14
was used as a subfault for rupture division of                                                                                           Site Number
SMGA1 and SMGA2, whereas Mw 5.2 was utilised
for SMGA3. The selection of the events was care-          Figure 5. Variation of simulated PGA at every site for three
fully done as these have similar faulting mechanism       different possible locations of mainshock.
and focal depth as that of the target earthquake.                                             1500
   The seismicity of the study area described that                                                                                Legend
                                                                                                                            Present Study
the epicentres of Uttarkashi and Chamoli earth-                                                                             Sharma and Bungum (2006); r=0.893
                                                                                                                            Chopra et al. (2012); r=0.705
quakes are situated in SMGA1 and SMGA2, respec-                                               1250
                                                                                                                            Sharma et al. (2013); r=0.789
                                                           Peak Ground Acceleration (cm/s2)

tively. On the basis of this study, these events (i.e.,
rupture planes and seismic moments) are consid-                                               1000
ered as SMGA1 and SMGA2. On the other hand,
SMGA3 is located in the Kumaon region along the
boundary of India and Nepal. Therefore, the 1980                                               750

Nepal earthquake (Mw 6.5) in the eastern Kumaon
region is considered as SMGA3. The USGS and                                                    500
Global Centroid–Moment–Tensor (CMT) provided
the fault plane mechanism for 1991 Uttarkashi
(φ = 296◦ , δ = 5◦ and λ = 90◦ ), 1999 Chamoli                                                 250

(φ = 282◦ , δ = 9◦ and λ = 95◦ ) and 1980                                                                 BARK GHAN RUDR TEHR                      BHAT   KARN PURO SRIN        UTTA

Nepal China earthquake (φ = 290◦ , δ = 21◦ and                                                   0
λ = 91◦ ), which have been used for SMGAs. The                                                       0        1        2         3         4        5         6       7   8         9         10
high dip (21◦ ) for the 1980 Nepal earthquake than                                                                                         Site Number
the Uttarkashi (∼5◦ ) and Chamoli (∼9◦ ) earth-
quakes suggests that the Main Himalayan Thrust            Figure 6. Comparison of simulated PGA values in the
                                                          present study with other studies in the region. ‘r’ represents
(MHT) is much steeper in the Kumaon region than
                                                          the correlation coefficient values between simulated PGA
in the Garhwal region. In addition, Kumar et al.          and other three studies in the region.
(2015b) reported two different attenuation rela-
tions 96f1.06 and 65f1.07 for Garhwal and Kumaon
                                                          was situated at a depth of 18 km in the fourth layer
regions, respectively, which have been considered
                                                          of this velocity model.
for the strong motion study in this work. These
two aforementioned factors, i.e., steeper dip of fault
plane and different attenuation characteristics of         6. Results and discussion
the Kumaon region explain the different distribu-
tion pattern of predicted PGA values in the case          In the present work, the entire study area
of SMGA3.                                                 (extending between latitude 76−83◦ E and longi-
   Yu et al. (1995) derived a velocity model for this     tude 28–32◦ N) was divided into 0.5◦ × 0.5◦ square
region as described in table 3. The rupture plane         grids. MSET was used to simulate the horizontal
100       Page 8 of 12                                                                                                  J. Earth Syst. Sci. (2019) 128:100

Table 4. PGA values at different locations for three different locations of mainshock in rupture plane.
                                                              PGA (gal)                   PGA (gal)                  PGA (gal)
                                                              mainshock                   mainshock                  mainshock
                                        Station               location in                 location in                location in              Geology of the region
Station                                  code                   SMGA1                       SMGA2                      SMGA3                  (Sharma et al. 2013)

Barkot                                  BARK                         252                               266              112                  Quartzite and phyllites
Ghansali                                GHAN                         400                               402              240                  Quartzite and phyllites
Kosani                                  KOSA                         101                               109              350                  Quartzite, schist
                                                                                                                                              and granite
Rudra Prayag                            RUDR                         210                               203              310                  Quartzite, schist
                                                                                                                                              and granite
Tehri                                   TEHR                         516                               535              273                  Quartzitic phyllite and
                                                                                                                                              schistose phyllite
Bhatwari                                BHAT                         630                               520              178                  Quartzites, schists
                                                                                                                                              and gneisses
Karan Prayag                            KARN                         197                               212              332                  Quartzitic phyllites and
                                                                                                                                              massive quartzites
Purola                                  PURO                         439                               430              102                  Quartzite and phyllites
Sri Nagar                               SRIN                         230                               219              300                  Quartzite
Uttarkashi                              UTTA                         855                               840              197                  Quartzite and phyllites
New Delhi                               NDL                          100                                80              220                  Alluvium
Chandigarh                              CHD                          300                               220              100                  Alluvium
Haridwar                                HDW                          600                               500              250                  Alluvium

                             32
                                        Himachal Pardesh                                                                                          1000 gal
                                                                                                                                                  950
                                                                                                                                                  900
                                                 Shimla                                                                                           850
                             31
                                                                                 Utt                                                              800
                                                                                       a ra
                                                                                              kh                                                  750
                                                                                                   an
                                   Chandigarh                                                           d                                         700
                                                                                                                                                  650
             Latitude (0N)

                                                                                                                                                  600
                                                                 Haridwar
                                                                                                                                                  550
                             30
                                                                                                                                                  500
                                                                                                                               Ne

                                                                                                                                                  450
                                                                                                                                   pa

                                                                                                                                                  400
                                                                                                                                    l

                                                                                                                                                  350
                                       Haryana                                                                                                    300
                             29                                                                                                                   250
                                                                                                                                                  200
                                                          New Delhi
                                                                                 Bareilley                                                        150
                                                                                                                                                  100
                                                                            Uttar Pradesh                                                         50
                             28                                                                                                                   0
                                  76             77             78          79                         80      81         82            83

                                                                                                   0
                                                                            Longitude ( E)

Figure 7. Isoacceleration map of the region assuming the location of the probable earthquake in SMGA1 close to the
mainshock of the 1991 earthquake in the Uttarkashi region.

component of strong motion records at every corner                                                     of the probable earthquake was considered as the
of the grid. Figure 4 shows the simulated records at                                                   nucleation point of SMGA1, SMGA2 and SMGA3
10 real recording sites. In the source model, SMGAs                                                    (the extreme northeast of every SMGA). The
led to the peculiar shapes at different stations                                                        variation of simulated PGA at every site for three
(SRIN, TEHR and UTTA). As a consequence,                                                               different locations of mainshock is described in
three different cases correspond to three different                                                      figure 5 and table 4.
possible locations of nucleation point of the proba-                                                     Moreover, the simulated PGA values are com-
ble earthquake (8.5) were assumed. The epicentre                                                       pared with earlier studies for the same region using
J. Earth Syst. Sci. (2019) 128:100                                                                                                      Page 9 of 12   100
                           32
                                      Himachal Pardesh                                                                                     1000 gal
                                                                                                                                           950
                                                                                                                                           900
                                               Shimla                                                                                      850
                           31                                                   Utt                                                        800
                                                                                   ara
                                                                                         kh                                                750
                                                                                              an
                                 Chandigarh                                                         d                                      700
                                                                                                                                           650
           Latitude (0N)

                                                                                                                                           600
                                                               Haridwar
                           30                                                                                                              550
                                                                                                                                           500

                                                                                                                          Ne
                                                                                                                                           450

                                                                                                                           pa
                                                                                                                                           400

                                                                                                                               l
                                                                                                                                           350
                                     Haryana                                                                                               300
                           29
                                                                                                                                           250
                                                                                                                                           200
                                                        New Delhi
                                                                                Bareilley                                                  150
                                                                                                                                           100
                                                                           Uttar Pradesh                                                   50
                           28                                                                                                              0
                                76             77             78           79                     80        81       82            83
                                                                                              0
                                                                           Longitude ( E)

Figure 8. Isoacceleration map of the region assuming the location of the probable earthquake in SMGA2 close to the
mainshock of the 1999 earthquake in the Chamoli region.

                           32
                                      Himachal Pardesh                                                                                     1000 gal
                                                                                                                                           950
                                                                                                                                           900
                                               Shimla                                                                                      850
                           31                                                    Utt                                                       800
                                                                                    a ra
                                                                                           kh                                              750
                                                                                                an                                         700
                                 Chandigarh                                                          d
                                                                                                                                           650
           Latitude (0N)

                                                                                                                                           600
                                                                Haridwar
                                                                                                                                           550
                           30
                                                                                                                                           500
                                                                                                                                           450
                                                                                                                          Ne
                                                                                                                           pa

                                                                                                                                           400
                                                                                                                               l

                                                                                                                                           350
                                     Haryana                                                                                               300
                           29                                                                                                              250
                                                                                                                                           200
                                                        New Delhi                                                                          150
                                                                                Bareilley
                                                                                                                                           100
                                                                           Uttar Pradesh                                                   50
                           28                                                                                                              0
                                76             77             78           79                       80      81       82            83
                                                                                                0
                                                                            Longitude ( E)

       Figure 9. Isoacceleration map of the region assuming the location of the probable earthquake in SMGA3.

the correlation coefficient (r) as shown in figure 6.                                                  CSG region has been estimated. An attempt is
(Chopra et al. 2012; Sharma et al. 2013; Sharma                                                     made to evaluate the PGA distribution in the
and Bungum 2006). Isoacceleration maps for all                                                      region using MSET. It is observed that PGA val-
the three possible locations of mainshock have been                                                 ues are comparable for the assumed epicentre of
developed using simulated records at every corner                                                   probable earthquake in SMGA1 and SMGA2. The
of the grid (figures 7–9).                                                                           highest PGA is estimated at Uttarkashi station,
                                                                                                    whereas the lowest is obtained at Kosani. How-
                                                                                                    ever, Kosani would experience the highest PGA
7. Conclusions and future scope                                                                     for mainshock location in SMGA3, whereas Purola
                                                                                                    site would observe the lowest. Haridwar, Chandi-
In conclusion, a source model with three SMGAs                                                      garh and New Delhi would observe PGA values
for a future probable earthquake (Mw 8.5) in the                                                    of 600, 300 and 100 gal, respectively, for the
100    Page 10 of 12                                                              J. Earth Syst. Sci. (2019) 128:100

mainshock location in SMGA1 and 500, 220 and                   Bhatia S C, Kumar M R and Gupta H K 1999 A probabilis-
80 gal, respectively, for the mainshock in SMGA2.                 tic seismic hazard map of India and adjoining regions;
From the above analysis, we concluded that PGA                    Annalidi Geofisica 42 1153–1164.
                                                               Boore D M 1983 Stochastic simulation of high frequency
would be higher in Haridwar and Chandigarh than                   ground motion based on seismological models of radiated
New Delhi city for SMGA1 and SMGA2. In con-                       Spectra; Bull. Seismol. Soc. Am. 73 1865–1894.
trast, New Delhi would observe a higher PGA value              Bilham R 1995 Location and magnitude of the Nepal
than Chandigarh for nucleation point located in                   earthquake and its relation to the rupture zones of the
SMGA3. The variation in PGA values with main-                     contiguous great Himalayan earthquakes; Curr. Sci. 69
                                                                  101–128.
shock location can be attributed to the directivity
                                                               Bilham R, Gaur V K and Molnar P 2001 Himalayan seismic
effects of the rupture propagation. Furthermore,                   hazard; Science 293 1442–1444.
the simulated PGA values in the present work are               Brune J N 1970 Tectonic stress and spectra of seismic shear
more or less comparable with previous studies in                  waves from earthquakes; J. Geophys. Res. 75 4997–5009.
the same region.                                               Chopra S, Kumar V, Suthar A and Kumar P 2012 Mod-
                                                                  eling of strong ground motions for 1991 Uttarkashi,
                                                                  1999 Chamoli earthquakes, and a hypothetical great
                                                                  earthquake in Garhwal–Kumaun Himalaya; Nat. Haz-
Acknowledgements                                                  ards 64 1141–1159.
                                                               Irikura K and Kamae K 1994 Estimation of strong ground
The authors are grateful to Dr Preeti for her                     motion in broad-frequency band based on a seismic source
                                                                  scaling model and an Empirical Green’s function tech-
valuable efforts to improve the quality of the
                                                                  nique; Ann. Geofis. XXXVII 6 1721–1743.
paper. The authors sincerely acknowledge the edi-              Irikura K and Miyake H 2011 Recipe for predicting strong
torial board and two anonymous reviewers for their                ground motion from crustal earthquake scenarios; Pure
critical review and constructive suggestions. The                 Appl. Geophys. 168(1–2) 85–104.
authors sincerely thank Kayal et al. (1995), USGS              Irikura K, Kagawa T and Sekiguchi H 1997 Revision of the
(https://www.usgs.gov/), CMT Harvard (http://                     empirical Green’s function method by Irikura, 1986, pro-
                                                                  gramme and abstracts; Zisin 2 B25.
www.globalcmt.org/), Ministry of Earth Sciences                IS:1893 2002 Indian standard criteria for earthquake resis-
(project reference no. MoES/P.O.(Seismo)/1(42)                    tant design of structures; Bureau of Indian Standards,
/2009) for using earthquake data. This work is an                 New Delhi.
outcome of project reference no. ECR/2016/000737               Joshi A 2001 Strong motion modeling of the source of the
supported by the Science and Engineering Research                 Chamoli earthquake of March 29, 1999 in the Garhwal
                                                                  Himalaya, India; J. Seismol. 5 499–518.
Board, DST, India. We gratefully acknowledge the
                                                               Joshi A 2004 A simplified technique for simulating wide
Department of Geophysics, Banaras Hindu Univer-                   band strong ground motion for two recent Himalaya earth-
sity, Varanasi and Department of Earth Sciences,                  quakes; Pure Appl. Geophys. 161 1777–1805.
Indian Institute of Technology, Roorkee, for pro-              Joshi A and Midorikawa S 2004 A simplified method for sim-
viding basic facilities for this research work. The               ulation of strong ground motion using rupture model of
author AS is highly thankful to Prof N P Singh for                the earthquake source; J. Seismol. 8 467–484.
                                                               Joshi A and Mohan K 2010 Expected peak ground accel-
his valuable suggestions to improve the quality of                eration in Uttarakhand Himalaya, India region from a
research work. The author PK sincerely acknowl-                   deterministic hazard model; Nat. Hazards 52 299–317.
edges the Director, Wadia Institute of Himalayan               Joshi A and Patel R C 1997 Modelling of active lin-
Geology, Dehradun.                                                eaments for predicting a possible earthquake scenario
                                                                  around Dehradun, Garhwal Himalaya, India; Tectono-
                                                                  phys. 283 289–310.
                                                               Joshi A, Sandeep A and Kamal 2014 Modeling of strong
                                                                  motion generation areas of the 2011 Tohoku, Japan
References                                                        earthquake using modified semi-empirical technique; Nat.
                                                                  Hazards 71 587–609.
Aki K 1967 Scaling law of seismic spectrum; J. Geophys. Res.   Joshi A, Kumar B, Sinvhal A and Sinvhal H 1999 Generation
  72 1217–1231.                                                   of synthetic accelerograms by modeling of rupture plane;
Araya R and Kiureghian A D 1988 Seismic hazard analysis,          J. Earthq. Tech. 36 43–60.
  improved models, uncertainties and sensitivities; Report     Joshi A, Singh S and Giroti K 2001 The simulation of ground
  No. EERC-90/11, Earthquake Engineering Research Cen-            motions using envelope summations; Pure Appl. Geophys.
  ter, University of California, Berkeley, CA, 155p.              158 877–901.
Asano K and Iwata T 2012 Source model for strong               Joshi A, Kumari P, Sharma M L, Ghosh A K, Agarwal M K
  ground motion generation in the frequency range 0.1–            and Ravikiran A 2012a A strong motion model of the 2004
  10 Hz during the 2011 Tohoku earthquake; Earth Planet.          great Sumatra earthquake: Simulation using a modified
  Space 64(12) 1111–1123.                                         semi-empirical method; J. Earthq. Tsunami 6 1–29.
J. Earth Syst. Sci. (2019) 128:100                                                                Page 11 of 12      100

Joshi A, Kumari P, Singh S and Sharma M L 2012b Near-           Miyake H, Iwate T and Irikura K 2003 Source characteriza-
  field and far-field simulation of accelerograms of Sikkim         tion for broadband ground-motion simulation: Kinematic
  earthquake of September 18, 2011 using modified semi-            heterogeneous source model and strong motion generation
  empirical approach; Nat. Hazards 64 1029–1054.                  area; Bull. Seismol. Soc. Am. 93 2531–2545.
Joshi A, Kuo C H, Dhibar P, Sandeep A, Sharma M L, Wen          Miyahara M and Sasatani T 2004 Estimation of source
  K L and Lin C M 2015 Simulation of the records of the           process of the 1994 SanrikuHaruka-oki earthquake using
  27th March 2013, Nantou Taiwan earthquake using mod-            empirical Green’s function method; Geophys. Bull.
  ified semi-empirical approach; Nat. Hazards 78 995–1020.         Hokkaido Univ. Sapporo. Japan 67 197–212.
Kamae K and Kawabe H 2004 Source model composed of              Mukhopadhyay B, Acharyya A and Dasgupta S 2011
  asperities for the 2003 Tokachi-oki, Japan, earthquake (M       Potential source zones for Himalayan earthquakes: Con-
  JMA = 8.0) estimated by the empirical Green’s function          straints from spatial–temporal clusters; Nat. Hazards 57
  method; Earth Planets Space 56(3) 323–327.                      369–383.
Kameda H and Sugito M 1978 Prediction of strong earth-          Nath S K, Shukla K and Vyas M 2008 Seismic hazard sce-
  quake motions by evolutionary process model; In: Proceed-       nario and attenuation model of the Garhwal Himalaya
  ings of the sixth Japan earthquake engineering symposium,       using near-field synthesis from weak motion seismometry;
  pp. 41–48.                                                      J. Earth Syst. Sci. 117 649–670.
Kanamori H and Anderson D L 1975 Theoretical basis of           Ni J and Barazangi M 1984 Seismotectonics of the
  some empirical relations in seismology; Bull. Seismol. Soc.     Himalayan collision zone: Geometry of the under thrust-
  Am. 65 1073–1095.                                               ing Indian plate beneath the Himalaya; J. Geophys. Res.
Kayal J 2014 Seismotectonics of the great and large earth-        89 1147–1163.
  quakes in Himalaya; Curr. Sci. 106(2) 188–197.                Sandeep, Joshi A, Kamal, Kumar P and Kumar A 2014a
Kayal J R, Ghosh B, Chakraborty P and Reena D 1995                Effect of frequency dependent radiation pattern in sim-
  Aftershock study of Uttarkashi earthquake of October 20,        ulation of high frequency ground motion of Tohoku
  1991 by a temporary micro earthquake network; Memoir            earthquake using modified semi empirical method; Nat.
  Geol. Soc. India 30 25–41.                                      Hazards 73 1499–1521.
Khattri K N 1987 Great earthquakes seismicity gaps and          Sandeep, Joshi A, Kamal, Kumar P and Kumari P
  potential for earthquake disaster along the Himalaya plate      2014b Modeling of strong motion generation area of
  boundary; Tectonophys. 138 79–92.                               the Uttarkashi earthquake using modified semi-empirical
Khattri K N 1999 An evaluation of earthquakes hazard and          approach; Nat. Hazards 73 2041–2066.
  risk in northern India; Him. Geol. 20 1–46.                   Sandeep, Joshi A, Kamal, Kumar P, Kumar A and Dhibar
Khattri K N and Tyagi A K 1983 Seismicity patterns in the         P 2015 Modeling of strong motiongeneration areas of
  Himalayan plate boundary and identification of areas of          the Niigata, Japan, earthquake of 2007 using mod-
  high seismic potential; Tectonophys. 96 281–297.                ified semi empiricaltechnique; Nat. Hazards 77 933–
Kumar D, Teotia S S and Khattari K N 1997 The representa-         957.
  tion of attenuation characteristics of strong ground motion   Sandeep A, Joshi A, Kumari P, Lal S, Vandana, Kumar P
  observed in the 1996 Dharamshala and 1991 Uttarkasshi           and Kamal 2017a Emergence of the semi-empirical tech-
  earthquakes by available Empirical relations; Curr. Sci.        nique of strong ground motion simulation: A review; J.
  73 543–548.                                                     Geol. Soc. India 89 719–722.
Kumar P, Joshi A, Sandeep, Ashvini K and Chadha R K             Sandeep, Joshi A, Sah S K, Kumar P, Lal S, Vandana, Kamal
  2015a Detailed attenuation characteristics of shear waves       and Singh R S 2017b Source model estimation of the 2005
  in Kumaon Himalaya, India using the inversion of strong         Kyushu earthquake, Japan using modified semi empirical
  motion data; Bull. Seismol. Soc. Am. 105 1836–1851.             technique; J. Asian Earth Sci. 147 240–253.
Kumar A, Sinvhal A, Joshi A, Kumar D, Sandeep and               Sandeep, Joshi A, Lal S, Kumar P, Sah S K, Van-
  Kumar P 2015b Coda wave attenuation characteristics             dana and Kamal 2017c Simulation of strong ground
  for Kumaon and Garhwal Himalaya, India; Nat. Haz-               motion of the 2009 Bhutan earthquake using Modified
  ards 75 1057–1074.                                              Semi Empirical Technique. Pure Appl. Geophys. 174
Kurahashi S and Irikura K 2011 Source model for generating        4343–4356.
  strong ground motion during the 2011 off the Pacific coast      Seeber L, Armbruster J G and Quittmeyer R C 1981 Seis-
  of Tohoku earthquake; Earth Planet. Space 63 571–576.           micity and continental subduction in Himalayan arc. In:
Midorikawa S 1993 Semi empirical estimation of peak               Hindu Kush, Himalaya: Geodynamic evolution Geodyn.
  ground acceleration from large earthquakes; Tectonophys.        Ser. 3 (eds) Gupta H K and Delany F M, Am. Geophys.
  218 287–295.                                                    Union, Washington, DC, pp. 215–242.
Miyake H, Iwata T and Irikura K 1999 Strong ground motion       Sharma M L and Bungum H 2006, New strong ground-
  simulation and source modeling of the Kagoshima-ken             motion spectral acceleration relations for the Himalayan
  Hokuseibu earthquakes of March 26 (MJMA 6.5) and                region; In: Proceedings, first European conference on
  May 13 (MJMA 6.3), 1997, using empirical Green’s func-          earthquake engineering and seismology (ECEES), Paper
  tion method; Zisin 51 431–442 (in Japanese with English         1312,8.
  abstract).                                                    Sharma B, Chopra S, Sutar A K and Bansal B K 2013 Esti-
Miyake H, Iwate T and Irikura K 2001 Estimation of rupture        mation of strong ground motion from a great earthquake
  propagation direction and strong motion generation area         mw 8.5 in central seismic gap region, Himalaya (India)
  from azimuth and distance dependence of source ampli-           using empirical Green’s function technique; Pure Appl.
  tude spectra; Geophys. Res. Lett. 28 2727–2730.                 Geophys. 170 2127–2138.
100    Page 12 of 12                                                            J. Earth Syst. Sci. (2019) 128:100

Srivastava H N, Verma M, Bansal B K and Sutar                Wells L D and Coppersmith K J 1994 New empirical relation-
   A K 2015 Discriminatory characteristics of seismic          ships among magnitude, rupture length, rupture width,
   gaps in Himalaya; Geomatics, Nat. Hazards Risk 6(3)         rupture area and surface displacement; Bull. Seismol. Soc.
   224–242.                                                    Am. 84 974–1002.
Suzuki W and Iwata T 2007 Source model of the 2005           Wyss M 1979 Estimating maximum expectable magnitude of
   Miyagi-Oki, Japan, earthquake estimated from broad-         earthquakes from fault dimensions; Geol. Soc. Am. 7(7)
   band strong motions; Earth Planet. Space 59(11)             336–340.
   1155–1171.                                                Yu G, Khattri K N, Anderson J G, Brune J N and
Takiguchi M, Asano K and Iwata T 2011 The comparison           Zeng Y 1995 Strong ground motion from the Uttarkashi,
   of source models of repeating subduction-zone earth-        Himalaya, India, earthquake: Comparison of observations
   quakes estimated using broadband strong motion records-     with synthetics using the composite source model; Bull.
   1982 and 2008 Ibaraki-ken-oki M7 earthquakes; Zisin 63      Seismol. Soc. Am. 85 31–50.
   223–242.
Corresponding editor: Arkoprovo Biswas
You can also read