Region Two: Gazelle, New Business and Resilience Analysis - Part of the Michigan Prosperity Initiative
←
→
Page content transcription
If your browser does not render page correctly, please read the page content below

Region Two:
  Gazelle, New Business
  and Resilience Analysis

Part of the Michigan
Prosperity Initiative

Introduction

     The Michigan Prosperity Initiative
    The Michigan Prosperity Initiative (MPI) is an innovative effort by Michigan State University, in
    partnership with the Michigan Department of Energy, Labor and Economic Growth, the Michigan
    Economic Development Corporation, the Michigan Association of Regions, the Michigan
    Municipal League, the Michigan Townships Association, the Michigan Association of Planning,
    Michigan State’s College of Agriculture and Natural Resources (CANR)
                                                                      (CANR), MAES Research and
    Michigan State University Extension (MSUE) to help return economic prosperity to the state. The
    MSU Land Policy Institute (LPI) is leading this effort. From mid-April to mid-June, one-hundred
    training programs were offered across the state by LPI and MSUE educators. There were three
    separate training programs. New Economy 101 described how Michigan’s present economic
    circumstances developed and emphasized that because Michigan has many assets there is good
    reason to be hopeful about our economic future. The New Economy 201 program focused on
    developing a common vision for prosperity; it described in detail Michigan’s critical assets and
    identified place-based strategies to help us create new prosperity on a regional basis. The New
    Economy 301 program focused on detailed economic analyses that can be performed to help
    inform Regional Strategic Growth Plans and the key strategies necessary to implement those
    plans. Following this statewide educational effort, MSU is assisting each of the fourteen State
    Planning and Development Regions in creating a new Regional Strategic Growth Plan, the results
    of which will be used to create the first-ever State Strategic Growth Plan by the end of 2010.

      Michigan Prosperity Initiative Partners

2
Methodology
Gazelle, New Business and Resilience
This analysis provides a snapshot of the business
community in Region 2, focusing on three
primary measures of health: gazelles, new
business
bus ess fo
formation,
a o ,aandd resiliency.
es e cy These
ese metrics
e cs
are indicators of the ability of the region to both
create opportunity and maintain its economic
output.
The National Establishment Time Series (NETS)
Database was used to compile business
information in Michigan. It includes employment
and sales data on private businesses as well as
NGO’s and public sector establishments based
on rating tracking from Dun and Bradstreet.
Businesses included in the NETS database range
from sole proprietorships to large corporations.
The NETS database is the most comprehensive
accounting of businesses and their performance.
Businesses are categorized within the NAICS
code in which they are primarily engaged.
Gazelle companies are defined in this context as those companies with 20% or greater growth in
sales from 2003 to 2008. While some gazelle companies are in traditional industries, many are in
emerging
i sectors off the
h economy. Quantifying
Q if i these
h establishments
bli h allows
ll for
f deeper
d cluster
l
analysis and also gives an indication of the viability of the clusters to be analyzed in the next step.
New businesses are those that existed in 2008, but not in 2006. Business emergence analysis
evaluates the birth rate of businesses and its impact on the region. New business emergence is a
sign of entrepreneurial activity.
Resilient businesses are those which retained at least 90% of their pre‐recession employment
since 2001 (measured in two increments‐ 2001 to 2005 and 2005 to 2008). As the global economic
downturn has had severe impacts in the U.S. and in Michigan, these resilient businesses may be
part of long‐term strategies for economic health. This measure uses employment rather than
sales, because employment is a lagging indicator of recovery and a leading indicator of recession
or sector difficulty.
difficulty
There are some N/A values for public administration because sales are not always applicable to
government departments. 3
Gazelle Analysis

    Statewide Gazelle Distribution

Gazelle Establishments

4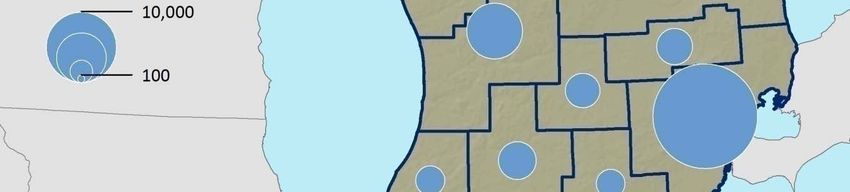
Gazelle Analysis

    Statewide Gazelle Performance
                                                                        Portion of     Gazelle Establishments
                                                        Gazelle
                                                                    Statewide Gazelle as a Portion of the Total
              Planning Region                   No. Establishment
                                                                     Establishments Establishments within
                                                     s 2003 ‐ 2008
                                                                       2003 ‐ 2008           th Region
                                                                                             the R i
Southeast Michigan Council of Governments          1         22,459             44.1%                      7.6%
Region 2 Planning Commission                       2          1,635              3.2%                      9.7%
Southcentral Michigan Planning Council             3          2,907              5.7%                      9.4%
Southwest Michigan Planning Commission             4          1,714              3.4%                      9.2%
Genesee‐Lapeer‐Shiawassee (GLS) Planning and
Development Commission                             5          2,659
                                                              2 659              5.2%
                                                                                 5 2%                     7.9%
                                                                                                          7 9%
Tri‐County Regional Planning Commission            6          2,458              4.8%                     8.7%
East Central Michigan Planning and
Development Commission                             7          4,256              8.4%                     9.0%
West Michigan Regional Planning Commission         8          6,368             12.5%                     9.5%
Northeast Michigan Council of Governments          9            996              2.0%                    10.0%
Northwest Michigan Council of Governments         10          2,190              4.3%                     8.9%
Eastern Upper Peninsula Regional Planning and
Development Commission                            11            323              0.6%                     9.3%
Central Upper Peninsula Planning and
Development Regional Commission                   12          1,021              2.0%                    10.3%
Western Upper Peninsula Planning and
Development Region                                13            493              1.0%                    10.0%
West Michigan Shoreline Regional Development
Commission                                        14          1,469              2.9%                     9.2%

       The map to the left shows gazelle establishments aggregated to the state planning and
       development regions.
       The table above shows how many gazelle establishments are in each region, the
       percentage of the state total in each region, and what percentage of establishments
       within the region are gazelles.

                                                                                                             5
Gazelle Analysis

    Gazelle Establishments in the Region

6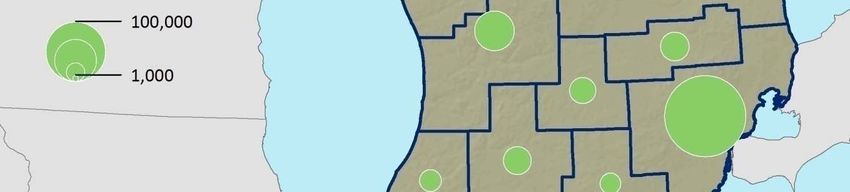
Gazelle Analysis

    Regional Gazelle Performance
                                                        Gazelle                                                Portion of
                                                                    Employment
                    Industry*                       Establishments                       Sales in 2008       Regional 2008
                                                                      in 2008
                                                      2003 ‐ 2008                                                Sales
 Agriculture,
 A   i lt     Forestry,
              F     t Fishing
                        Fi hi and  d Hunting
                                     H ti                        96           326              $45 754 400
                                                                                               $45,754,400          26 02%
                                                                                                                    26.02%
 Mining                                                           7           125              $30,954,400          38.36%
 Utilities                                                       10        1,946            $1,343,425,624          92.11%
 Construction                                                   191         1,230             $146,224,858          22.09%
 Manufacturing                                                  176         8,120           $1,236,686,759          23.37%
 Wholesale Trade                                                 99         1,128             $544,934,478          40.17%
 Retail Trade                                                   221         3 091
                                                                            3,091             $436 088 902
                                                                                              $436,088,902          21 31%
                                                                                                                    21.31%
 Transportation and Warehousing                                  42           594              $58,859,698          24.78%
 Information                                                     19           173              $13,769,264          11.85%
 Finance and Insurance                                           60           890             $341,619,778          41.57%
 Real Estate and Rental and Leasing                              55           530              $41,536,833          21.76%
 Professional, Scientific, and Technical Services                93           671              $84,697,403          23.54%
 Administrative and Support and Waste
Management and Remediation Services                                 73             921        $254,114,319          54.34%
 Educational Services                                               35           2,382        $224,288,401          35.86%
 Health Care and Social Assistance                                 139           4,201        $385,802,754          38.73%
Arts, Entertainment, and Recreation                                 29             386         $99,735,334          61.97%
Accommodation and Food Services                                     82           1,313         $41,970,900          15.96%
Other Services (except Public Administration)                      208           1,152         $54,677,181          15.61%
Total of all Gazelles                                            1,635         29,179       $5,385,141,286         34.33%
   * Industries are NAICS 2‐digit industrial sectors. See the Appendix for a description of each sector.

       The map to the left shows the gazelle distribution within the region, aggregated at the
       minor civil division geography (city or township level).
       The table above shows the gazelles within the region broken out to the 18 National
       Industrial Classification System industries at the two‐digit level. It details the number of
       establishments, their employment in 2008, the total sales in 2008, and what percentage
       of regional total sales in that industry are accounted for by gazelle companies.

                                                                                                                       7
New Business Analysis

    Startup Establishments Statewide

New Establishments

8
New Business Analysis

   Statewide Startup Performance
                                                                            Portion of     New Establishments
                                                               New
                                                                          Statewide New as a Portion of the
              Planning Region                   No.       Establishments
                                                                          Establishments Total Establishments
                                                            2006 ‐ 2008
                                                                            2006 ‐ 2008     within
                                                                                             ithi th
                                                                                                   the R
                                                                                                       Region
                                                                                                          i
Southeast Michigan Council of Governments             1            54,598            54.4%                18.5%
Region 2 Planning Commission                          2             2,256             2.2%                13.4%
Southcentral Michigan Planning Council                3             4,415             4.4%                14.2%
Southwest Michigan Planning Commission                4             2,570             2.6%                13.7%
Genesee‐Lapeer‐Shiawassee (GLS) Planning and
Development Commission                                5            5,416
                                                                   5 416            5.4%
                                                                                    5 4%                 16.1%
                                                                                                         16 1%
Tri‐County Regional Planning Commission               6            4,433            4.4%                 15.7%
East Central Michigan Planning and
Development Commission                             7               6,021            6.0%                 12.7%
West Michigan Regional Planning Commission         8              10,828           10.8%                 16.1%
Northeast Michigan Council of Governments          9               1,188            1.2%                 11.9%
Northwest Michigan Council of Governments         10               3,689            3.7%                 14.9%
Eastern Upper Peninsula Regional Planning and
Development Commission                            11                456             0.5%                 13.1%
Central Upper Peninsula Planning and
Development Regional Commission                   12               1,391            1.4%                 14.0%
Western Upper Peninsula Planning and
Development Region                                13                 697            0.7%                 14.2%
West Michigan Shoreline Regional Development
Commission                                        14               2,472            2.5%                 15.4%

     The map to the left shows new establishments aggregated in the 14 planning and
     development regions.
     The table above shows the number of new businesses, the portion of the statewide total,
     and the percentage of new establishments broken down by region.

                                                                                                              9
New Business Analysis

 Startup Establishments in the Region

         Regional map

10
New Business Analysis
Regional Startup Performance
New Portion of
Employment
Industry Establishments Sales in 2008 Regional 2008
in 2008
2006 ‐ 2008 Sales
Agriculture, Forestry
Agriculture Forestry, Fishing and Hunting 45 69 $4,611,700
$4 611 700 2 62%
2.62%
Mining 4 32 $5,552,200 6.88%
Utilities 5 28 $4,766,000 0.33%
Construction 243 342 $36,662,800 5.54%
Manufacturing 74 777 $1,448,624,600 27.38%
Wholesale Trade 99 282 $57,266,600 4.22%
Retail Trade 253 568 $63,268,100 3.09%
Transportation and Warehousing 69 127 $8,394,200 3.53%
Information 48 94 $5,941,000 5.11%
Finance and Insurance 101 231 $22,565,200 2.75%
Real Estate and Rental and Leasing 110 283 $21,384,284 11.20%
Professional, Scientific, and Technical Services 206 316 $20,741,400 5.76%
Management of Companies and Enterprises 9 17 $1,729,000 10.09%
pp and Waste
Administrative and Support
Management and Remediation Services 371 607 $38,053,600 8.14%
Educational Services 14 29 $915,000 0.15%
Health Care and Social Assistance 229 885 $46,781,688 4.70%
Arts, Entertainment, and Recreation 36 78 $3,012,300 1.87%
Accommodation and Food Services 88 460 $16,766,500 6.37%
Other Services (except Public Administration) 244 357 $18,442,600 5.26%
P blic Administration
Public 8 244 N/A N/A
Total of all Startups 2,256 5,826 $1,825,478,772 11.64%
The map to the left shows the distribution of new establishments within the region
aggregated at the minor civil division scale.
The table above shows the new establishments within the region broken down to the two
digit National Industrial Classification code level. It details the number of new
establishments, their employment in 2008, their 2008 sales, and the percentage of total
regional sales in each NAICS industrial sector accounted for by new establishments.
11Resilience Analysis
Statewide Resilient Establishments
2001-2005
Resilient Establishments
12Resilience Analysis
Statewide Resilient Establishment
Performance 2001-2005
Portion of Resilient Establishments
Resilient
Statewide Resilient as a Portion of the
Planning Region No. Establishments
Establishments Total Establishments
2001 ‐ 2005
2001 ‐ 2005 within the Region
Southeast Michigan Council of Governments 1 119,498 44.3% 47.5%
Region 2 Planning Commission 2 8,475 3.1% 54.3%
Southcentral Michigan Planning Council 3 15,066 5.6% 52.8%
Southwest Michigan Planning Commission 4 9,321 3.5% 55.6%
Genesee‐Lapeer‐Shiawassee
Genesee Lapeer Shiawassee (GLS) Planning and
Development Commission 5 14,892 5.5% 49.4%
Tri‐County Regional Planning Commission 6 12,840 4.8% 49.9%
East Central Michigan Planning and
Development Commission 7 24,276 9.0% 55.4%
West Michigan Regional Planning Commission 8 30,667 11.4% 51.1%
Northeast Michigan
g Council of Governments 9 5,371 2.0% 57.2%
Northwest Michigan Council of Governments 10 11,931 4.4% 53.9%
Eastern Upper Peninsula Regional Planning and
Development Commission 11 1,812 0.7% 56.6%
Central Upper Peninsula Planning and
Development Regional Commission 12 5,240 1.9% 58.2%
Western Upper Peninsula Planning and
Development Region 13 2,611 1.0% 58.0%
West Michigan Shoreline Regional Development
Commission 14 7,818 2.9% 53.9%
The map to the left shows the distribution of resilient establishments (2001
(2001‐2005)
2005) by
planning region.
The table above shows the number of resilient establishments, the percentage of resilient
establishments statewide from 2001‐2005, and the percentage of resilient establishments
as a proportion of total regional establishments.
13Resilience Analysis
Statewide Resilient Establishments
2005-2008
Resilient Establishments
14Resilience Analysis
Statewide Resilient Establishment
Performance 2005-2008
Portion of Resilient Establishments
Resilient
Statewide Resilient as a Portion of the
Planning Region No. Establishments
Establishments Total Establishments
2005 ‐ 2008
2005 ‐ 2008 within the Region
Southeast Michigan Council of Governments 1 186,688 46.3% 63.3%
Region 2 Planning Commission 2 11,997 3.0% 71.1%
Southcentral Michigan Planning Council 3 21,469 5.3% 69.3%
Southwest Michigan Planning Commission 4 12,982 3.2% 69.4%
Genesee‐Lapeer‐Shiawassee
Genesee Lapeer Shiawassee (GLS) Planning and
Development Commission 5 22,483 5.6% 67.0%
Tri‐County Regional Planning Commission 6 19,216 4.8% 68.0%
East Central Michigan Planning and
Development Commission 7 34,285 8.5% 72.4%
West Michigan Regional Planning Commission 8 45,298 11.2% 67.4%
Northeast Michigan Council of Governments 9 7,294 1.8% 73.0%
Northwest Michigan Council of Governments 10 17,002 4.2% 68.7%
Eastern Upper Peninsula Regional Planning and
Development Commission 11 2,511 0.6% 72.1%
Central Upper Peninsula Planning and
Development Regional Commission 12 7,016 1.7% 70.5%
Western Upper Peninsula Planning and
Development Region 13 3,462 0.9% 70.4%
West Michigan Shoreline Regional Development
Commission 14 11,121 2.8% 69.4%
The map to the left shows the distribution of resilient establishments (2005
(2005‐2008)
2008) by
planning region.
The table above shows the number of resilient establishments, the percentage of resilient
establishments statewide from 2005‐2008, and the percentage of resilient establishments
as a proportion of the total regional establishments.
15Resilience Analysis
Resilient Establishments in the Region
2001-2005
Regional map
16Resilience Analysis
Resilient Establishment Performance
in the Region 2001-2005
Resilient Portion of
Employment
Industry Establishments Sales in 2005 Regional 2005
in 2005
2001 ‐ 2005 Sales
Agriculture, Forestry, Fishing and Hunting 768 1,506 $123,135,694 69.26%
Mining 25 315 $68,326,677 89.12%
Utilities 14 467 $249,014,187 19.60%
Construction 877 3,411 $372,911,061 61.56%
Manufacturing 648 19,688 $2,539,481,258 67.73%
Wholesale Trade 321 2,954 $730,084,680 70.80%
Retail Trade 1,128 10,758 $1,452,499,865 71.08%
Transportation and Warehousing 239 1 668
1,668 $134 729 779
$134,729,779 66 11%
66.11%
Information 122 1,035 $73,060,686 72.63%
Finance and Insurance 276 2,426 $578,922,024 74.34%
Real Estate and Rental and Leasing 346 1,404 $131,831,879 70.60%
Professional, Scientific, and Technical Services 546 2,555 $181,151,377 59.57%
Management of Companies and Enterprises 4 108 $6,912,500 69.28%
Administrative and Support and Waste
Management and Remediation Services 340 1,853
1 853 $128 958 293
$128,958,293 25.56%
25 56%
Educational Services 195 7,146 $398,901,155 75.49%
Health Care and Social Assistance 743 10,367 $639,367,159 80.60%
Arts, Entertainment, and Recreation 161 1,161 $41,982,634 29.07%
Accommodation and Food Services 394 5,144 $156,121,029 66.50%
Other Services (except Public Administration) 1,210 4,471 $238,039,230 65.39%
Public Administration 118 4,595 $8,719,100 100.00%
T t l
Total 8 475
8,475 83 032
83,032 $8 254 150 266
$8,254,150,266 62 93%
62.93%
The map to the left shows resilient establishments within the region from 2001‐2005,
aggregated at the minor civil division level.
The table above shows the resilient establishments from 2001‐2005 within the region
broken down to the two‐digit National Industrial Classification code levels. It details the
number of establishments, their 2005 employment, their 2005 sales, and the percentage
of the regional total sales in each NAICS industrial sector from resilient businesses.
17Resilience Analysis
Resilient Establishments in the Region
2005-2008
Regional map
18Resilience Analysis
Resilient Establishment Performance
in the Region 2005-2008
Resilient Portion of
Employment
Industry Establishments Sales in 2008 Regional 2008
in 2008
2005 ‐ 2008 Sales
Agriculture,
A i lt FForestry,
t Fi Fishing
hi andd Hunting
H ti 881 1 855
1,855 $158,812,279
$158 812 279 90 30%
90.30%
Mining 37 385 $75,132,977 93.12%
Utilities 22 2,178 $1,451,794,624 99.54%
Construction 1,409 4,998 $489,717,424 73.97%
Manufacturing 862 23,721 $3,323,907,123 62.83%
Wholesale Trade 464 4,021 $1,056,629,522 77.89%
Retail Trade 1 606
1,606 13 526
13,526 $1 823 276 952
$1,823,276,952 89 12%
89.12%
Transportation and Warehousing 344 2,351 $184,681,017 77.76%
Information 183 1,317 $92,844,270 79.88%
Finance and Insurance 408 3,087 $550,562,427 66.99%
Real Estate and Rental and Leasing 490 1,941 $134,417,085 70.41%
Professional, Scientific, and Technical Services 846 3,643 $295,556,205 82.13%
Management of Companies and Enterprises 9 125 $8,200,000 47.87%
Administrative and Support and Waste
Management and Remediation Services 680 3,149 $387,192,717 82.79%
Educational Services 236 8,383 $553,873,878 88.57%
Health Care and Social Assistance 993 12,306 $854,748,044 85.81%
Arts, Entertainment, and Recreation 230 1,551 $145,612,770 90.47%
Accommodation and Food Services 517 7,059 $217,841,429 82.82%
Other Services (except Public Administration) 1,636 5,996 $
$282,083,791 80.52%
Public Administration 144 5,423 $8,857,100 95.47%
Total 11,997 107,015 $12,095,741,634 77.11%
The mapp to the left shows resilient establishments within the region
g from 2005‐2008,,
aggregated at the minor civil division level.
The table above shows the resilient establishments from 2005‐2008 within the region
broken down to the two‐digit National Industrial Classification code levels. It details the
number of establishments, their 2008 employment, their 2008 sales, and the percentage
of the regional total sales in each NAICS industrial sector from resilient businesses.
19Appendix One: Sector Definitions
The following sector definitions are taken from: http://www.census.gov/epcd/naics02/naicod02.htm
The Agriculture, Forestry, Fishing and Hunting sector comprises establishments primarily engaged in growing crops,
raising animals, harvesting timber, and harvesting fish and other animals from a farm, ranch, or their natural habitats.
The establishments in this sector are often described as farms, ranches, dairies, greenhouses, nurseries, orchards, or
hatcheries. A farm may consist of a single tract of land or a number of separate tracts which may be held under
different tenures. For example, one tract may be owned by the farm operator and another rented. It may be
operated by the operator alone or with the assistance of members of the household or hired employees, or it may be
operated by a partnership, corporation, or other type of organization. When a landowner has one or more tenants,
renters, croppers, or managers, the land operated by each is considered a farm.
The Mining sector comprises establishments that extract naturally occurring mineral solids, such as coal
and ores; liquid minerals, such as crude petroleum; and gases, such as natural gas. The term mining is used
in the broad sense to include quarrying, well operations, beneficiating (e.g., crushing, screening, washing,
and flotation), and other preparation customarily performed at the mine site, or as a part of mining activity.
The Utilities sector comprises establishments engaged in the provision of the following utility services:
electric power, natural gas, steam supply, water supply, and sewage removal. Within this sector, the specific
activities associated with the utility services provided vary by utility: electric power includes generation,
transmission, and distribution; natural gas includes distribution; steam supply includes provision and/or
distribution; water supply includes treatment and distribution; and sewage removal includes collection,
treatment, and disposal of waste through sewer systems and sewage treatment facilities.
The Construction sector comprises establishments primarily engaged in the construction of buildings or engineering
projects (e.g., highways and utility systems). Establishments primarily engaged in the preparation of sites for new
construction and establishments primarily engaged in subdividing land for sale as building sites also are included in
this sector. Construction work done may include new work, additions, alterations, or maintenance and repairs.
Activities of these establishments generally are managed at a fixed place of business, but they usually perform
construction activities at multiple project sites. Production responsibilities for establishments in this sector are usually
specified in (1) contracts with the owners of construction projects (prime contracts) or (2) contracts with other
construction
i establishments
bli h ((subcontracts).
b )
The Manufacturing sector comprises establishments engaged in the mechanical, physical, or chemical transformation
of materials, substances, or components into new products. The assembling of component parts of manufactured
products is considered manufacturing, except in cases where the activity is appropriately classified in Sector 23,
Construction. Establishments in the Manufacturing sector are often described as plants, factories, or mills and
characteristically use power‐driven machines and materials‐handling equipment. However, establishments that
transform materials or substances into new products by hand or in the worker's
worker s home and those engaged in selling to
the general public products made on the same premises from which they are sold, such as bakeries, candy stores, and
custom tailors, may also be included in this sector. Manufacturing establishments may process materials or may
contract with other establishments to process their materials for them. Both types of establishments are included in
manufacturing.
20Appendix One: Sector Definitions
The Wholesale Trade sector comprises establishments engaged in wholesaling merchandise, generally without
transformation and rendering services incidental to the sale of merchandise.
transformation, merchandise The merchandise described in this sector
includes the outputs of agriculture, mining, manufacturing, and certain information industries, such as publishing. The
wholesaling process is an intermediate step in the distribution of merchandise. Wholesalers are organized to sell or
arrange the purchase or sale of (a) goods for resale (i.e., goods sold to other wholesalers or retailers), (b) capital or
durable non‐consumer goods, and (c) raw and intermediate materials and supplies used in production. Wholesalers
sell merchandise to other businesses and normally operate from a warehouse or office. These warehouses and offices
are characterized by having little or no display of merchandise. In addition, neither the design nor the location of the
premises is intended to solicit walk‐in traffic. Wholesalers do not normally use advertising directed to the general
public. Customers are generally reached initially via telephone, in‐person marketing, or by specialized advertising that
may include Internet and other electronic means. Follow‐up orders are either vendor‐initiated or client‐initiated,
generally based on previous sales, and typically exhibit strong ties between sellers and buyers. In fact, transactions are
often conducted between wholesalers and clients that have long‐standing business relationships.
The Retail Trade sector comprises establishments engaged in retailing merchandise, generally without transformation,
and rendering services incidental to the sale of merchandise. The retailing process is the final step in the distribution of
merchandise; retailers are
are, therefore
therefore, organized to sell merchandise in small quantities to the general public.
public This
sector comprises two main types of retailers: store and non‐store retailers.
The Transportation and Warehousing sector includes industries providing transportation of passengers and cargo,
warehousing and storage for goods, scenic and sightseeing transportation, and support activities related to modes of
transportation. Establishments in these industries use transportation equipment or transportation related facilities as a
productive asset. The type of equipment depends on the mode of transportation. The modes of transportation are air,
rail,, water,, road,, and p
pipeline.
p The Transportation
p and Warehousingg sector distinguishes
g three basic types
yp of activities:
subsectors for each mode of transportation, a subsector for warehousing and storage, and a subsector for
establishments providing support activities for transportation. In addition, there are subsectors for establishments that
provide passenger transportation for scenic and sightseeing purposes, postal services, and courier services.
The Information sector comprises establishments engaged in the following processes: (a) producing and distributing
information and cultural products, (b) providing the means to transmit or distribute these products as well as data or
communications, and (c) processing data. The main components of this sector are the publishing industries, including
software
ft publishing,
bli hi and d both
b th traditional
t diti l publishing
bli hi and d publishing
bli hi exclusively
l i l on the
th Internet;
I t t the
th motion
ti picture
i t andd
sound recording industries; the broadcasting industries, including traditional broadcasting and those broadcasting
exclusively over the Internet; the telecommunications industries; the industries known as Internet service providers
and web search portals, data processing industries, and the information services industries. The expressions
''information age'' and ''global information economy'' are used with considerable frequency today. The general idea of
an ''information economy'' includes both the notion of industries primarily producing, processing, and distributing
information, as well as the idea that every industry is using available information and information technology to
g
reorganize and make themselves more p productive.
21Appendix One: Sector Definitions
The Finance and Insurance sector comprises establishments primarily engaged in financial transactions (transactions
involving the creation,
creation liquidation,
liquidation or change in ownership of financial assets) and/or in facilitating financial
transactions. Three principal types of activities are identified:
1. Raising funds by taking deposits and/or issuing securities and, in the process, incurring liabilities. Establishments
engaged in this activity use raised funds to acquire financial assets by making loans and/or purchasing securities.
Putting themselves at risk, they channel funds from lenders to borrowers and transform or repackage the funds with
respect to maturity, scale, and risk. This activity is known as financial intermediation.
2. Pooling of risk by underwriting insurance and annuities. Establishments engaged in this activity collect fees,
insurance premiums, or annuity considerations; build up reserves; invest those reserves; and make contractual
payments. Fees are based on the expected incidence of the insured risk and the expected return on investment.
3. Providing specialized services facilitating or supporting financial intermediation, insurance, and employee benefit
programs.
In addition, monetary authorities charged with monetary control are included in this sector.
The Real Estate and Rental and Leasing sector comprises establishments primarily engaged in renting, leasing, or
otherwise allowing the use of tangible or intangible assets, and establishments providing related services. The major
portion of this sector comprises establishments that rent
rent, lease
lease, or otherwise allow the use of their own assets by
others. The assets may be tangible, as is the case of real estate and equipment, or intangible, as is the case with
patents and trademarks. This sector also includes establishments primarily engaged in managing real estate for others,
selling, renting and/or buying real estate for others, and appraising real estate. These activities are closely related to
this sector's main activity, and it was felt that from a production basis they would best be included here. In addition, a
substantial proportion of property management is self‐performed by lessors. The main components of this sector are
the real estate lessors industries; equipment lessors industries (including motor vehicles, computers, and consumer
goods); and lessors of nonfinancial intangible assets (except copyrighted works).
The Professional, Scientific, and Technical Services sector comprises establishments that specialize in performing
professional, scientific, and technical activities for others. These activities require a high degree of expertise and
training. The establishments in this sector specialize according to expertise and provide these services to clients in a
variety of industries and, in some cases, to households. Activities performed include: legal advice and representation;
accounting, bookkeeping, and payroll services; architectural, engineering, and specialized design services; computer
services; consulting services; research services; advertising services; photographic services; translation and
i t
interpretation
t ti services;
i veterinary
t i services;
i and
d other
th professional,
f i l scientific,
i tifi and d ttechnical
h i l services.
i
The Management of Companies and Enterprises sector comprises (1) establishments that hold the securities of (or
other equity interests in) companies and enterprises for the purpose of owning a controlling interest or influencing
management decisions or (2) establishments (except government establishments) that administer, oversee, and
manage establishments of the company or enterprise and that normally undertake the strategic or organizational
planning and decisionmaking role of the company or enterprise. Establishments that administer, oversee, and manage
mayy hold the securities of the company
p y or enterprise.
p Establishments in this sector perform
p essential activities that are
often undertaken, in‐house, by establishments in many sectors of the economy. By consolidating the performance of
these activities of the enterprise at one establishment, economies of scale are achieved.
22Appendix One: Sector Definitions
The Administrative and Support and Waste Management and Remediation Services sector comprises establishments
performing routine support activities for the day‐to‐day operations of other organizations. These essential activities
are often undertaken in‐house by establishments in many sectors of the economy. The establishments in this sector
specialize in one or more of these support activities and provide these services to clients in a variety of industries and,
in some cases, to households. Activities performed include: office administration, hiring and placing of personnel,
document preparation and similar clerical services, solicitation, collection, security and surveillance services, cleaning,
and waste disposal services. The administrative and management activities performed by establishments in this sector
are typically on a contract or fee basis. These activities may also be performed by establishments that are part of the
company or enterprise. However, establishments involved in administering, overseeing, and managing other
establishments of the company or enterprise
enterprise, are classified in Sector 55
55, Management of Companies and Enterprises
Enterprises.
These establishments normally undertake the strategic and organizational planning and decision making role of the
company or enterprise. Government establishments engaged in administering, overseeing, and managing
governmental programs are classified in Sector 92, Public Administration.
The Educational Services sector comprises establishments that provide instruction and training in a wide variety of
subjects. This instruction and training is provided by specialized establishments, such as schools, colleges, universities,
and trainingg centers. These establishments mayy be privately
p y owned and operated
p for profit
p or not for profit,
p , or theyy
may be publicly owned and operated. They may also offer food and accommodation services to their students.
Educational services are usually delivered by teachers or instructors that explain, tell, demonstrate, supervise, and
direct learning. Instruction is imparted in diverse settings, such as educational institutions, the workplace, or the home
through correspondence, television, or other means. It can be adapted to the particular needs of the students, for
example sign language can replace verbal language for teaching students with hearing impairments. All industries in
the sector share this commonality of process, namely, labor inputs of instructors with the requisite subject matter
expertise and teaching ability.
The Health Care and Social Assistance sector comprises establishments providing health care and social assistance for
individuals. The sector includes both health care and social assistance because it is sometimes difficult to distinguish
between the boundaries of these two activities. The industries in this sector are arranged on a continuum starting with
those establishments providing medical care exclusively, continuing with those providing health care and social
assistance, and finally finishing with those providing only social assistance. The services provided by establishments in
this sector are delivered by trained professionals. All industries in the sector share this commonality of process,
namely,y, labor inputs
p of health p practitioners or social workers with the requisite
q expertise.
p Manyy of the industries in the
sector are defined based on the educational degree held by the practitioners included in the industry.
The Arts, Entertainment, and Recreation sector includes a wide range of establishments that operate facilities or
provide services to meet varied cultural, entertainment, and recreational interests of their patrons. This sector
comprises (1) establishments that are involved in producing, promoting, or participating in live performances, events,
or exhibits intended for public viewing; (2) establishments that preserve and exhibit objects and sites of historical,
cultural, or educational interest; and (3) establishments that operate facilities or provide services that enable patrons
to participate in recreational activities or pursue amusement, hobby, and leisure‐time interests.
23Appendix One: Sector Definitions
The Accommodation and Food Services sector comprises establishments providing customers with lodging and/or
preparing meals, snacks, and beverages for immediate consumption. The sector includes both accommodation and
food services establishments because the two activities are often combined at the same establishment.
establishment
The Other Services (except Public Administration) sector comprises establishments engaged in providing services not
specifically provided for elsewhere in the classification system. Establishments in this sector are primarily engaged in
activities, such as equipment and machinery repairing, promoting or administering religious activities, grantmaking,
advocacy, and providing drycleaning and laundry services, personal care services, death care services, pet care
services, photofinishing services, temporary parking services, and dating services. Private households that engage in
employing workers on or about the premises in activities primarily concerned with the operation of the household are
included in this sector. Private households that engage in employing workers on or about the premises in activities
primarily concerned with the operation of the household are included in this sector.
The Public Administration sector consists of establishments of federal, state, and local government agencies that
administer, oversee, and manage public programs and have executive, legislative, or judicial authority over other
institutions within a given area. These agencies also set policy, create laws, adjudicate civil and criminal legal cases,
provide for public safety and for national defense. In general, government establishments in the Public Administration
sector oversee governmental programs and activities that are not performed by private establishments
establishments.
Establishments in this sector typically are engaged in the organization and financing of the production of public goods
and services, most of which are provided for free or at prices that are not economically significant. Government
establishments also engage in a wide range of productive activities covering not only public goods and services but also
individual goods and services similar to those produced in sectors typically identified with private‐sector
establishments. In general, ownership is not a criterion for classification in NAICS. Therefore, government
establishments engaged in the production of private‐sector‐like goods and services should be classified in the same
industry as private‐sector establishments engaged in similar activities.
24For more information or assistance,
please contact:
Land Policyy Research
310 Manly Miles Building
1405 S Harrison Road
East Lansing, Michigan 48823
Tel: (517) 432-8800
Fax: (517) 432-8769
www.landpolicy.msu.eduYou can also read