Public Transit and Access to Jobs in the Milwaukee Metropolitan Area, 2001-2014
←
→
Page content transcription
If your browser does not render page correctly, please read the page content below
Public Transit and Access to Jobs in the
Milwaukee Metropolitan Area, 2001-2014

                      Prepared by:

         Center for Economic Development
         University of Wisconsin-Milwaukee

                     January 2015

                 For further information contact:

                         Joel Rast, Ph.D.
              UWM Center for Economic Development
                    Telephone: 414-229-6155
                     E-Mail: jrast@uwm.edu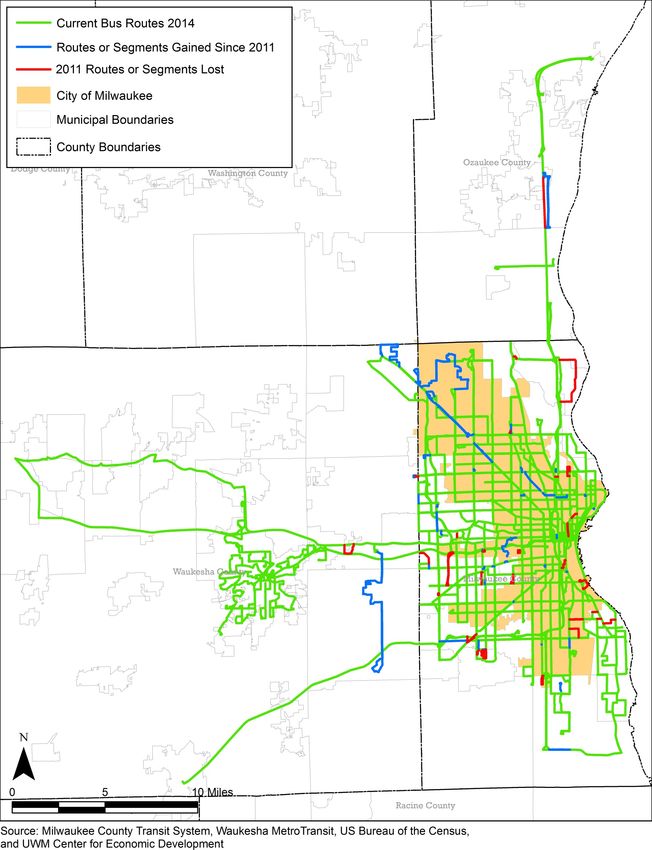
UWM Center for Eco no mic Development

About this Report
       During the past several years, the University of Wisconsin-Milwaukee Center for
Economic Development (CED) has produced a number of studies focusing on transit
service and access to jobs in the Milwaukee region. In 2008, the Center authored a study
that examined the impact of transit service reductions from 2001 to 2007 on access to
employment in the Milwaukee metro area. We followed that report with studies in 2010
and 2011 examining how proposed service reductions for the Milwaukee County Transit
System would affect transit service to regional employers. This study examines the impact
of transit service cuts and service expansions that have occurred between 2001 and 2014
on access to jobs in the Milwaukee Metro area.
       This report was written by Joel Rast, associate professor of political science and
urban studies and director of CED. Maps, tables, and GIS and data analysis were done by
Catherine Madison. Additional data analysis was done by Lisa Heuler Williams. We are
grateful for the assistance of the Milwaukee County and Waukesha Metro Transit Systems
in the preparation of this study.
       CED is a unit of the College of Letters and Science at the University of Wisconsin-
Milwaukee. The College established CED in 1990 to provide university research and
technical assistance to community organizations and units of government working to
improve the Greater Milwaukee economy. The analysis and conclusions presented in this
report are solely those of CED and do not necessarily reflect the views and opinions of UW
-Milwaukee, or any of the organizations providing financial support to the Center.
       CED strongly believes that informed public debate is vital to the development of
good public policy. The Center publishes briefing papers, detailed analyses of economic
trends and policies, and “technical assistance” reports on issues of applied economic
development. In these ways, as well as in conferences and public lectures sponsored by
the Center, we hope to contribute to public discussion on economic development policy in
Southeastern Wisconsin.
       Further information about the Center and its reports and activities is available at
our web site: www.ced.uwm.edu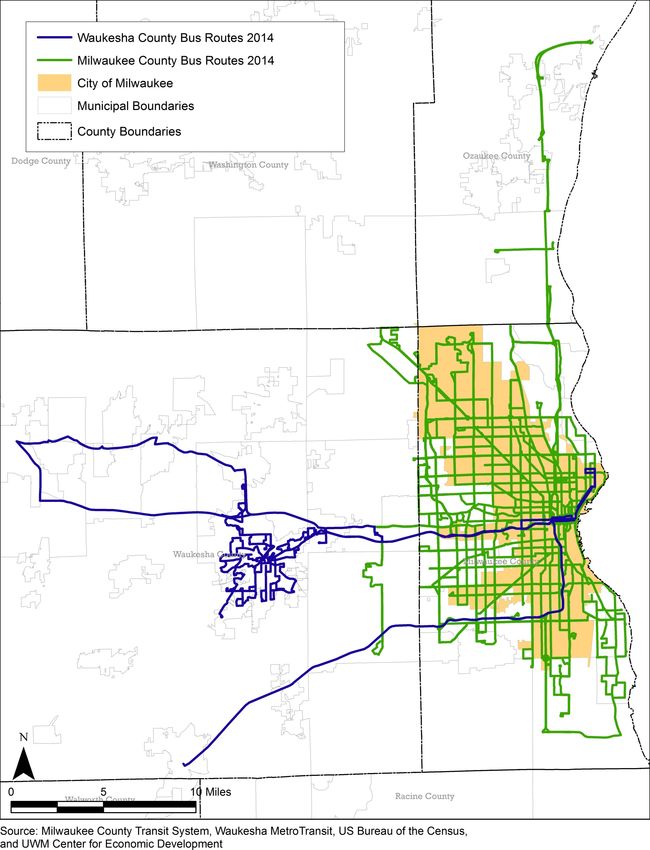
UWM Center for Eco no mic Development

    Introduction
    Public transit in the Milwaukee metro area is undergoing changes. After a decade of
    painful service reductions and fare increases, resulting in a 22 percent decline in bus
    route miles by Milwaukee County Transit Service alone, the bleeding seems to have
    stopped—at least for now. Since 2011 service has for the most part stabilized, and during
    the past year several new bus routes have been added. In recent years the UWM Center
    for Economic Development has done several studies examining the impact of transit
    service reductions on access to jobs in the four-county Milwaukee metro area.1 The
    recent increases in bus service make this an appropriate time to revisit this issue. In
    particular, to what extent have these service expansions begun to offset the reductions
    carried out during the past decade.

             Our concern in this report is chiefly with how a compromised transit system
    affects the ability of transit-dependent populations to access job opportunities in the
    Milwaukee region. Many kinds of people use public transit, including those who have
    other mobility options. Indeed, a healthy transit system requires a diverse ridership base.
    However, we focus here on those whose mobility options are more limited because
    deficiencies with public transit for such individuals are not simply an inconvenience, but
    directly impact their ability to earn a livelihood. Transit-dependent populations are for
    the most part low- and moderate-income.

             We begin with a long-term perspective, examining the net effect of the
    combination of service reductions and service expansions on access to jobs from 2001 to
    the present. Given the mix of reductions and expansions that have occurred during the
    past 13 years, how well are employers served by transit, compared with service in 2001.
    Next, we break this down by economic sector, looking in particular at four sectors in
    which low- and moderate-income populations are heavily represented: manufacturing,

1
 Center for Economic Development, Out of Service: The Impact of Transit Cuts on Access to Jobs in Metro-
politan Milwaukee (2008); An Analysis of the Impact of Proposed 2012 Milwaukee County Service Reductions
on Access to Employment (2011). For additional analysis of public transit and access to jobs see Public Policy
Forum, Getting to Work: Opportunities and Obstacles to Improving Transit Service to Suburban Milwaukee
Job Hubs (2013).

                                                                                                           Page 1
UWM Center for Eco no mic Development
retail, health care, and accommodation and food service. Our purpose here is to determine
whether some of these sectors have been impacted more heavily than others by the net
loss of transit service. We conclude by examining the more recent period between 2011
and 2014 where bus service experienced a net increase, comparing access to jobs in 2011
to access in 2014 in order to isolate and quantify the impact of these service expansions.
Our key findings are as follows:
1,324 fewer employers are served by transit today than would be the case if the
transit system of 2001 were currently in place. These establishments employ an
estimated 30,923 workers.
Nearly one-fourth of the jobs that would be served by transit if the 2001 bus
system were still in place today are in manufacturing. Employers in the retail,
accommodation and food service, and health care and social assistance
sectors—sectors which, along with manufacturing, are major employers of low-
and moderate-income workers and job seekers—are underrepresented among
employers affected by service reductions.
The number of employers served by transit rose by 443 from 2011-2014. We
estimate that these establishments employ a total of 15,839 workers.
The Mismatch Between Jobs and Transit-Dependent
Workers
There are three principal public transit providers in the Milwaukee region:
Milwaukee County Transit Service (MCTS), Waukesha Metro Transit, and Waukesha
County Transit. Other regional transit providers such as the Washington County Commuter
Express are not feasible options for central city residents seeking to reach suburban job
destinations and are not considered in this analysis. MCTS operates bus service in
Milwaukee County and provides limited service to Ozaukee and Waukesha Counties.
Waukesha Metro Transit serves the city of Waukesha and administers service by
Waukesha County Transit to other areas of central and western Waukesha County. Route
Page 2UWM Center for Eco no mic Development
Map 1. Bus Routes, Milwaukee Metro Area
Page 3UWM Center for Eco no mic Development
10 operated by MCTS provides a link between the MCTS and Waukesha transit systems at
Brookfield Square, allowing MCTS passengers to reach destinations in Waukesha County,
and vice-versa. Map 1 shows the configuration of current bus routes for the MCTS and
Waukesha transit systems, combined.
As Map 1 shows, large portions of the four-county region have no transit service
whatsoever, particularly Washington and Ozaukee Counties, where bus service is virtually
non-existent. Even in Milwaukee County, where bus lines are most heavily concentrated,
service to suburban communities such as Franklin and Oak Creek in the southern portion
of the county is minimal in comparison to service within the city of Milwaukee proper. For
persons dependent on transit to reach job destinations what this means is that their
prospects for reaching a wide range of employment destinations located in the city of
Milwaukee are far greater than those of accessing jobs in suburban areas.
Where do transit-dependent populations live? People who rely on public
transportation because the costs of purchasing and maintaining an automobile are
prohibitively expensive or because they do not possess valid driver’s licenses are far more
likely to live in the city of Milwaukee and other portions of Milwaukee County than in the
exurban Washington, Ozaukee, and Waukesha (WOW) counties.2 The poverty rate for the
city of Milwaukee in 2013 was 29 percent, compared with a rate of 6 percent for
Washington County, 5 percent for Ozaukee County, and 5 percent for Waukesha County.3
Not surprisingly, there is a strong racial dimension to this disparity in poverty rates, with
the regional poverty rate for African Americans at 38 percent, and that for non-Hispanic
whites at 7.6 percent.4 Recent data show that 91 percent of the region’s African-American
population lives in the city of Milwaukee, while less than 3 percent of blacks live in the
2
A 2005 study by the UW-Milwaukee Employment and Training Institute found that only 47 percent of Afri-
can-American adults and 43 percent of Hispanic adults in Milwaukee County had a valid driver’s license. See
John Pawasarat, The Driver License Status of the Voting Age Population in Wisconsin (Milwaukee: UWM Em-
ployment and Training Institute, 2005).
3
U.S. Census Bureau, American Community Survey 2013, 5 year estimates.
4
Ibid.
Page 4UWM Center for Eco no mic Development
WOW counties combined.5 What this means is that the typical transit-dependent job
holder or job seeker is a low-income person of color, living in the city of Milwaukee.
Unfortunately for such individuals, regional job growth patterns in recent decades
indicate that it is the suburbs, rather than the central city, where employment
opportunities are likely to be the greatest. For decades, all the net job growth in the
Milwaukee region has occurred in suburban areas, particularly those communities located
outside Milwaukee County where transit service is least extensive. From 1994 to 2009 the
city of Milwaukee lost 27,858 jobs, while employment in Washington, Ozaukee, and
Waukesha Counties increased by 56,271.6 In 1970, 56 percent of the region’s workers were
employed in the city of Milwaukee, while only 18 percent worked in the WOW counties. By
2011, Milwaukee and the WOW counties were even, with 34 percent of regional workers
each.7
The pattern of transit cuts during the past decade has exacerbated this mismatch
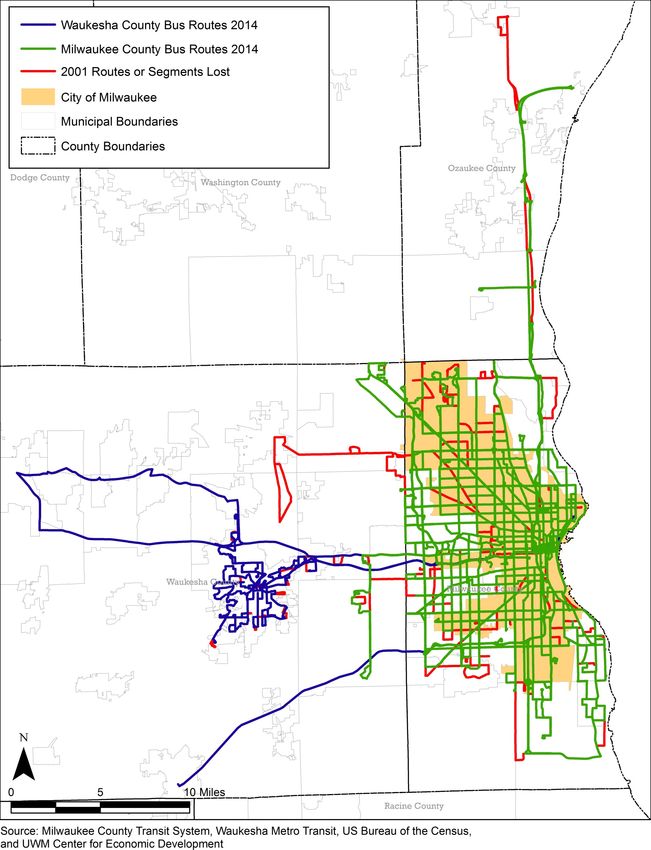
between the transit system and transit-dependent workers and job seekers. Map 2 shows
the location of bus routes and route segments that have been eliminated since 2001. As
Map 2 reveals, a substantial portion of those service cuts has reduced service in suburban
locations. Why have service cuts disproportionately affected suburban areas? Simply put,
because MCTS makes decisions about which bus routes to shorten or eliminate based
primarily on ridership numbers. Suburban areas, often less densely populated and
developed than central city locations, are where ridership numbers are likely to be the
lowest. As a financially strapped transit provider, MCTS must pay careful attention to
ridership in prioritizing bus routes, including decisions about which routes to keep or
eliminate.8 However, it is also true that MCTS’s efforts to maximize efficiency in this way
5
Marc V. Levine, Perspectives on the Current State of the Milwaukee Economy (Milwaukee: UWM Center for
Economic Development, 2013), 13.
6
Ibid.
7
Ibid, 16.
8
Farebox revenue represents roughly one-third of MCTS operating revenue. See Public Policy Forum, Mil-
waukee County’s Transit Crisis: How Did We Get Here and What Do We Do Now? (2008), 5.
Page 5UWM Center for Eco no mic Development Map 2. Bus Routes and Route Segments Eliminated Since 2001 Page 6
UWM Center for Eco no mic Development

have made a substantial number of suburban job locations inaccessible to transit-
dependent workers and job seekers.

Job Locations Served by Transit, 2001 and 2014

       In this section we examine how the net change in transit service (i.e., the
combination of service reductions and expansions) from 2001 to the present has affected
access to job locations in the four-county region. Our method relies principally on
determining whether or not individual employers are located within walking distance of a
bus stop, and it should be acknowledged that there are certain shortcomings to this
approach. First, it does not capture scheduling changes such as reduced hours of service
that may make employment at certain establishments impractical or impossible for transit
-dependent workers. Second, it does not take into account the length of trips by transit
users. Clearly, there is a limit to the amount of time an individual can be expected to
spend commuting to work, making some destinations served by transit inaccessible
because it would take too long to get there. Given these considerations, our measure of
accessibility based simply on transit service to individual employers is a generous one.

       To do our analysis, we first created GIS maps of all bus routes operated by the
three main transit providers in the region—MCTS, Waukesha Metro Transit, and
Waukesha County Transit—for the years 2001 and 2014. For MCTS, routes also include
those introduced in January 2015. We then identified the locations of all employers in the
region for both years, 2001 and 2014, using SNAP data from the Wisconsin Department of
Workforce Development. The SNAP database contains the addresses of all Wisconsin
employers covered under the state’s unemployment insurance laws. This includes private
business establishments, nonprofit organizations, educational institutions, and
government agencies.

       Next, we determined which employers were located within walking distance of a
bus stop in 2001, and which were within walking distance in 2014. The general guideline
for transit planning is that most people will walk ¼ mile to get to a bus stop. While some

                                                                                             Page 7
UWM Center for Eco no mic Development
people are willing to walk further than this, transit use declines significantly as distances
exceed ¼ mile. In this study, we follow standard industry practice and use ¼ mile as our
measure of accessibility.9 Using GIS analysis, we drew ¼ mile buffers (or circles) around
each bus stop in the regional transit system. All job locations within the buffers were
designated as accessible by transit, while those located outside of the buffers were
designated as inaccessible.
Because some locations lost transit service while others gained service during this
time period, determining the net change in service was not a simple matter of counting the
employers located in areas that were served by transit in 2001 but no longer served in
2014. To calculate the net change in service we subtracted the number of employers which
had gained service during this time from the number which had lost service. We found that
1,610 employers were located in areas served by transit in 2001 but no longer served in
2014. Another 286 employers were located in areas that did not have service in 2001 but
were served in 2014. Consequently, 1,324 fewer employers are served by transit today
than would be the case if the bus route structure of 2001 were still in place.
How many workers do these 1,324 establishments employ? Here again, due to the
combination of service reductions and increases, this figure cannot be calculated simply by
counting the number of employees for establishments located in areas formerly served by
transit. To calculate the net change in jobs served by transit, the total number of jobs in
areas that gained service from 2001 to the present must be subtracted from the number of
jobs in areas that lost service during this time.
Our task here is further complicated by the fact that SNAP employer data does not
provide precise information on the number of employees at individual workplaces. Rather,
it provides a range (1-4 workers, 5-9 workers, etc.) for each establishment. Table 1
9
See Sean O’Sullivan and John Morrall, “Walking Distances to and from Light-Rail Transit Stations.” Transpor-
tation Research Record 1538. Transportation Research Board, Washington, DC (1995): 19-26; and Fang Zhao,
Lee-Fang Chow, Min-Tang Li, Albert Gan, and Ike Ubaka, “Forecasting Transit Walk Accessibility: A Regression
Model Alternative to the Buffer Method.” Paper presented at the annual meeting of the Transportation Re-
search Board, Washington, DC (2003).
Page 8UWM Center for Eco no mic Development
provides employment numbers for all establishments located in areas that lost service
from 2001 to 2014 less the number of employers which gained service during this time. For
example, there are 530 employers with between 1-4 workers located in areas that lost
service from 2001 to 2014, and another 92 employers of this size that gained service. The
net change represents a loss of service to 438 firms of this size, shown in column 2 of Table
1. Moving over to columns 3 and 4, we see that these firms employ a minimum of 438
workers and a maximum of 1,752 workers. By repeating this exercise for each size category
of employer, we find that the net change in transit service to employers has resulted in the
loss of service to a minimum of 20,018 jobs, and a maximum of 41,828 jobs.
Table 1. Net Reduction in Transit Service to Employers, 2001-2014
Employees Number of Minimum Total Maximum Total Average Total
Employers Workers Workers Workers
1-4 438 438 1,752 1,095
5-9 282 1,410 2,538 1,974
10-19 272 2,720 5,168 3,944
20-49 220 4,400 10,780 7,590
50-99 67 3,350 6,633 4,992
100-249 32 3,200 7,968 5,584
250-499 12 3,000 5,988 4,494
500-999 +1 +500 +999 +750
1,000+ 2 2,000 2,000 2,000
Total 1,324 20,018 41,828 30,923
This range is of course too wide to be a useful measure of access to jobs. We could
simply use the minimum total workers affected, a measure we have used in previous
studies of job access. However, this figure, while highly reliable, no doubt vastly
understates the net reduction in access to jobs. For this number to be valid, every
Page 9UWM Center for Eco no mic Development
establishment in each employment size category would have to employ the minimum
number of workers in that category. For example, of the 272 establishments employing
between 10 and 19 workers, all 272 would be presumed to employ exactly 10 workers.
This is an unrealistic assumption.
We believe a more accurate estimate of the impact on access to employment can
be derived by averaging the minimum and maximum number of workers for each
category, shown in column 5 of Table 1. Using this method, we find that approximately
30,923 fewer jobs are served by transit today than would be the case if the transit system
of 2001 were still in place. While this number is less reliable than the minimum total
workers affected, we believe it is far closer to the correct number and thus more
appropriate as an estimated figure of the number of jobs that would be accessible by
transit if the 2001 system of bus lines were currently in place.
Sector-Specific Analysis
In addition to examining the net change in transit service to employers from 2001
to the present, we wanted to look at specific economic sectors to see how transit service
to establishments within these sectors has been affected during this period. We examine
four sectors: manufacturing, retail, health care, and accommodation and food service.
These sectors were chosen because they are major employers of low- and moderate-
income workers and job seekers. For each of these sectors we repeat the exercise in the
previous section. That is, we quantify the net loss in transit service to employers and
provide estimates for the total number of jobs affected.
Table 2 summarizes results for manufacturing (NAICS code 31-33). As column 2 shows, the
net change in service to manufacturing establishments is a loss of service to 199
establishments, which we estimate employ a total of 7,667 workers. Comparing these
results with those for all employers provided in Table 1, we find that the loss of transit
service to manufacturing establishments accounts for 15 percent of the loss of service to
all employers. However, because these businesses employ on average more workers than
other sectors, the number of jobs affected accounts for nearly 25 percent of the total. Put
Page 10UWM Center for Eco no mic Development
Table 2. Net Reduction in Transit Service to Employers, Manufacturing
Employees Number of Minimum Total Maximum Total Average Total
1-4 30 30 120 75
5-9 38 190 342 266
10-19 49 490 931 711
20-49 53 1,060 2,597 1,829
50-99 15 750 1,485 1,118
100-249 6 600 1,494 1,047
250-499 9 2,250 4,491 3,371
500-999 +1 +500 +999 +750
1,000+ 0 0 0 0
Total 199 4,870 10,461 7,667
another way, almost one-fourth of the jobs that would be served by transit if the 2001
transit system were still in place today are in manufacturing.
This figure is not particularly surprising, given the decentralization of manufacturing
that has been occurring in the Milwaukee region. From 1997 to 2009, the percentage of
regional manufacturing jobs located in the city of Milwaukee fell from 28 percent to 19
percent. In 1997, 46,467 workers in the city of Milwaukee were employed in
manufacturing; by 2009, the number had fallen to 27,253.10 The steady increase in the
proportion of regional manufacturing jobs located in the suburbs, where transit service is
generally less extensive than in the city of Milwaukee, explains why manufacturing jobs are
so well represented among jobs no longer accessible by transit. For transit-dependent
populations, this trend is a significant concern since manufacturing is still one of the main
sectors offering opportunities for workers with limited formal education to earn a living
wage. Efforts to reduce poverty and joblessness in Milwaukee will be negatively impacted
10
Levine, Perspectives on the Current State of the Milwaukee Economy, 8.
Page 11UWM Center for Eco no mic Development
to the extent that the proportion of the region’s manufacturing jobs accessible by transit
continues to shrink.
Results for the other sectors we examine are not as striking. Table 3 summarizes
the results for the retail sector (NAICS 44-45). There are 96 fewer retail establishments
served by transit than would be the case if the transit system from 2001 were still in place
today. We estimate these 96 establishments employ a total of approximately 1,787
workers, which represents 6 percent of the overall net loss of jobs accessible by transit
since 2001. Given that roughly 14 percent of the region’s workforce is employed in the
retail sector, this means that retail jobs are underrepresented among jobs that have lost
transit service since 2001.11 This may be because many retail jobs are located in the city of
Milwaukee, where transit service is still generally good, and because even with the service
cuts of the past decade, service to suburban shopping malls and other retail
concentrations where ridership numbers are relatively solid has not been eliminated.
Table 3. Net Reduction in Transit Service to Employers, Retail Sector
Employees Number of Minimum Total Maximum Total Average Total
Employers Workers Workers Workers
1-4 35 35 140 87.5
5-9 22 110 198 154
10-19 18 180 342 261
20-49 12 240 588 414
50-99 7 350 693 521.5
100-249 2 200 498 349
250-499 0 0 0 0
500-999 0 0 0 0
1,000+ 0 0 0 0
Total 96 1,115 2,459 1,787
11
U.S. Economic Census, 2007.
Page 12UWM Center for Eco no mic Development
Table 4 provides results for the accommodation and food service sector (NAICS 72).
The results here are similar to what we found for the retail sector, with disproportionately
few employers and jobs affected. There are 86 fewer employers in the accommodation
and food service sector with transit service today than would be the case if the transit
system of 2001 were currently in place. These 86 establishments employ an estimated
total of 1,190 workers which represents just under 4 percent of the overall net loss of jobs
served by transit. Since regional employment in accommodation and food service is
around 10 percent of total employment, this sector is, like retail, underrepresented in the
total number of jobs affected.12 Here again, this could be because many jobs in this sector
are located in retail corridors and locations like the downtown areas of Milwaukee and
Waukesha where ridership numbers are sufficiently strong to make service cuts an
unattractive option for transit service providers.
Table 4. Net Reduction in Transit Service to Employers, Accommodation and
Food Service Sector
Employees Number of Minimum Total Maximum Total Average Total
Employers Workers Workers Workers
1-4 20 20 80 50
5-9 13 65 117 91
10-19 26 260 494 377
20-49 26 520 1,274 897
50-99 2 100 198 149
100-249 0 0 0 0
250-499 +1 +250 +499 +374.5
500-999 0 0 0 0
1,000+ 0 0 0 0
Total 86 715 1,664 1,190
12
Ibid.
Page 13UWM Center for Eco no mic Development
Finally, Table 5 summarizes results for the health care and social assistance sector
(NAICS 62). Transit service reductions from 2001 to the present have resulted in a loss of
service to 131 establishments, which we estimate employ a total of 3,517 workers. This
represents roughly 10 percent of the net reduction in both jobs and employers served by
transit. Like the retail and accommodation and food service sectors, health care jobs—
which account for roughly 20 percent of regional employment—are underrepresented in
the total number of jobs affected by service cuts. This is partly explained by the high
percentage of health care jobs located in the city of Milwaukee, where transit service to
employers continues to be relatively good and where fewer route reductions and
eliminations have been made. Forty-two percent of regional health care jobs are located in
the city of Milwaukee. By comparison, only 19 percent of regional manufacturing jobs are
located in the city of Milwaukee.13
Table 5. Net Reduction in Transit Service to Employers, Health Care and
Social Assistance Sector
Employees Number of Minimum Total Maximum Total Average Total
Employers Workers Workers Workers
1-4 44 44 176 110
5-9 34 170 306 238
10-19 22 220 418 319
20-49 14 280 686 483
50-99 8 400 792 596
100-249 8 800 1,992 1,396
250-499 1 250 499 374.5
500-999 0 0 0 0
1,000+ 0 0 0 0
Total 131 2,164 4,869 3,517
13
Levine, Perspectives on the Current State of the Milwaukee Economy, 8; U.S. Economic Census, 2007.
Page 14UWM Center for Eco no mic Development
To summarize, a total of 512 fewer employers in these four sectors combined are
served by transit today than would be the case if the transit system of 2001 were still in
place. Firms in these sectors employ an estimated 14,161 workers, of which more than
half work in the manufacturing sector. To the extent that manufacturing employment
continues to decentralize, access to manufacturing jobs will in all likelihood continue to
represent one of the key challenges in connecting transit-dependent workers and job
seekers to regional employment opportunities. While employers in the retail,
accommodation and food service, and health care and social assistance sectors are
underrepresented among employers experiencing loss of service, the impact on these
sectors is significant as well. For transit-dependent populations, jobs in several hundred
establishments in these sectors that would have bus service today if the 2001 transit
system were still in place are instead out of reach.
Impact of Service Changes, 2011-2014
The year 2010 marked something of a turning point for public transit in the
Milwaukee region. Following a decade of steady bus route eliminations and route
reductions, both MCTS and Waukesha Metro and County Transit found ways to curtail
further loss of service. Hours and frequency of service continued to experience
reductions, but the elimination of entire routes and route segments was for the most part
avoided. Beginning in 2012, MCTS sought to improve service with the introduction of the
GreenLine, RedLine, and BlueLine express buses, funded through the federal Congestion
Mitigation and Air Quality Improvement (CMAQ) program. Additional express buses
funded by the same program began operation in January 2015. These routes are chiefly
intended to introduce limited stop express service along heavily used existing bus
corridors rather than expand service to new locations. However, their implementation
suggests a new commitment on the part of county officials to avoid major service cuts
and take small steps toward undoing some of the damage that was done during the
previous decade.
More recently, MCTS has added several bus routes and route segments in areas
Page 15UWM Center for Eco no mic Development
where service did not previously exist. In June 2014, Route 55 was extended from
Southridge Shopping Center to 108th and Layton. Also in 2014, MCTS began operating
Route 6 (New Berlin Industrial Express) and Route 279 (Menomonee Falls Industrial
Express), both of which provide connections between central Milwaukee and suburban
manufacturing areas. Route 6 provides service during shift changes at FedEx in the New
Berlin industrial park and BuySeasons in the Westridge industrial park. It also serves
Brookfield Square and Mayfair Mall. Route 279 travels mainly along Fond du Lac Avenue
and provides service during shift changes at the Park Place and Menomonee Falls business
parks. In addition, Route 61 (Appleton-Keefe), introduced in January 2015, provides regular
fixed route service along Keefe and Appleton Avenues northwest into Menomonee Falls
and Germantown, also connecting central city residents to suburban job locations.
Routes 6, 279, and 61 are being funded through a $13.5 million legal settlement
between the Wisconsin Department of Transportation and two organizations representing
inner-city residents of Milwaukee, the Black Health Coalition of Wisconsin and the
Milwaukee Inner-City Congregations Allied for Hope (MICAH). In 2012, the two
organizations filed a lawsuit against WisDOT seeking to block reconstruction of the Zoo
Interchange. The plaintiffs argued that the $1.7 billion freeway project discriminated
against low-income and minority populations by failing to include a public transit
component. Under the settlement, reached in May 2014, the State of Wisconsin agreed to
spend $11.5 million over a four-year period to fund new bus lines connecting inner-city
residents with suburban job opportunities. An additional $2 million was committed for
public outreach, engagement, and marketing.14
Given these changes to the regional public transit system during the past several
years, we wanted to determine the extent to which access to jobs by transit-dependent
populations has increased. Map 3 shows changes to the configuration of bus lines in the
transit system from 2011 to the present. The blue lines represent areas with new bus
14
See Milwaukee Journal-Sentinel, “State to Spend $13.5 Million on Transit to Settle Zoo Interchange Suit,”
May 19, 2014; and Milwaukee Journal-Sentinel, “New Bus Route Will Take City Residents to Suburban Job
Sites,” May 20, 2014.
Page 16UWM Center for Eco no mic Development
Map 3. Changes to Bus Routes, 2011-2014
Page 17UWM Center for Eco no mic Development
service, while the red lines represent areas that lost service during this time. The only
major areas to lose service were the North Shore communities of Bayside and Fox Point,
where the elimination of Route 68 cut off service to residential areas along Lake Drive and
Brown Deer Road. On balance, service to employers expanded during this time. Table 6
shows the net increase in transit service to employers from 2011-2014.
Table 6. Net Increase in Transit Service to Employers, 2011-2014
Employees Number of Minimum Total Maximum Total Average Total
Employers Workers Workers Workers
1-4 88 88 352 220
5-9 86 430 774 602
10-19 76 760 1,444 1,102
20-49 101 2,020 4,949 3,484.5
50-99 60 3,000 5,940 4,470
100-249 27 2,700 6,723 4,711.5
250-499 4 1,000 1,996 1,498
500-999 1 500 999 749.5
1,000+ -1 -1,000 -1,000 -1,000
Total 443 9,499 22,178 15,839
As Table 6 indicates, even after taking into account the loss of service caused by the
elimination of Route 68 and the reconfiguration of several other bus lines, the number of
employers served by transit rose by 443 during this period. We estimate that these
establishments employ a total of approximately 15,839 workers. This is a significant
increase, suggesting that new bus lines have been configured in ways to maximize their
access to suburban employment centers. The problem, of course, is that support for most
of these routes comes from a legal settlement that provides funding for a limited time
only. Should these bus routes prove effective in connecting transit-dependent populations
Page 18UWM Center for Eco no mic Development
with job opportunities, new funding sources will need to be tapped in order to sustain
them beyond the four-year period for which funding is currently in place.
Conclusion
One might be tempted to conclude from this analysis that following years of
devastating cuts to public transit in the Milwaukee region, a new period of rebuilding has
begun. Certainly, the improved job access resulting from the addition of bus lines by
MCTS during the past year is both significant and welcome. Noteworthy, however, is the
fact that these service expansions came for the most part not through creative efforts by
public officials to secure additional resources for transit, but through legal action against
the state Department of Transportation. Absent this legal challenge by public transit
stakeholders, access to jobs in the Milwaukee metro area today would be largely
unchanged from where it stood four years ago.
For the past several years, county officials have worked hard to maintain existing
levels of transit service and avoid further reductions, and for this they should be
commended. At the same time, a new complacency about public transit seems to be
replacing the previous slash and burn mentality among decision makers. Drastic service
cuts are avoided, but meaningful steps to begin to restore service to levels of the late
1990s have not been taken. Seemingly forgotten is the fact that the transit system of
today is a shell of its former self, and that jobs continue to decentralize at a rapid pace. It
is not enough to simply hold the line on service cuts. Serious rebuilding efforts supported
by secure and long-term sources of funding will need to be undertaken to avoid further
isolating transit-dependent job holders and job seekers from the region’s job growth
centers.
The problem will not be solved as long as the local share of transit funding relies,
as it does in Milwaukee and Waukesha Counties, on a property tax levy. This unusual and
ineffective funding mechanism has been identified for years as a key obstacle to the
provision of adequate public transit in the Milwaukee region, yet state and local
Page 19UWM Center for Eco no mic Development politicians have been unable to reach a consensus around an alternative set of arrangements. Until this happens, county officials are unlikely to have the resources to do anything more than maintain the status quo with public transit, and even that may become impossible without a property tax increase. Proposals for a Regional Transit Authority and a dedicated sales tax for transit have been unsuccessful in the past. Both, however, have merit, and deserve careful consideration going forward. Meaningful civic discussions about the institutional arrangements and funding mechanisms through which transit is governed and supported are needed if the recent expansion of service is to represent more than a fleeting interlude in a longer-term pattern of decline. Page 20
You can also read