Developing Seismic Risk Maps for Mérida State, Venezuela
←
→
Page content transcription
If your browser does not render page correctly, please read the page content below
Developing Seismic Risk Maps
for Mérida State, Venezuela

A. Bendito
Faculty of Engineering, Universidad de Los Andes, Venezuela.

J. Rozelle & D. Bausch
FEMA, Mitigation Division, Region VIII, USA.

SUMMARY:
Until recently, the focus of FEMA’s Hazus earthquake model has been US centric, largely due to a lack of
standardized building/infrastructure data formats applicable elsewhere. In a combined effort between FEMA
Region 8 and the Universidad de Los Andes, Venezuela, the Hazus earthquake model was adapted to conduct
earthquake loss estimations for Venezuela. The required population totals and demographic distributions were
developed using Oak Ridge National Labs Landscan 2008 population data and the census 2001 data from the
country. The accuracy of the model was further enhanced for Mérida State by the inclusion of geologic data
maps and risk assessment data from other investigations. To identify possible scenarios we used a USGS
ShakeMap scenario, representing the historical earthquake that occurred in Mérida in 1674 with an estimated
magnitude Ms7.5. Countless minor seismic tremors are continually registered but there is an increasing
probability of a damaging earthquake.

Keywords: Risk Management, Hazus, Andean Region, Scenario, Earthquake.

1. INTRODUCTION

Earthquakes disasters result in severe devastation and cause deaths of a large number of people every
year. Deaths and destruction due to earthquakes can be reduced with the application of basic
principles and targeted investments. Managing risk will become a more urgent and demanding task in
the coming years, mainly because vulnerabilities are rapidly increasing. Therefore, mechanisms of
response to risk need to be more agile and effective at all levels and scales of government, as well as
in people’s daily lives.
Another catastrophic earthquake is a potential reality in Mérida State at any time; however the day
this may occur cannot be predicted. An important objective of this study is to highlight that it will
have a more severe impact than the last large earthquake due to the fact that the total population has
grown from 4,500 since the last earthquake in 1894 to about 800,000 (as per 2011 Census of
Venezuela); now 88.19% of the actual population lives in urban areas, and the city may be ill
prepared. In order to be prepared for such a natural hazard, we must be able to estimate and predict
the seismic risk associated with the potential losses and thus be in a better position to plan for the long
term. The seismic risk maps are and can be used in a number of ways such as increasing general
public awareness of earthquake hazard, urban planning, selecting sites for important facilities (e.g.
hospitals, schools), providing a basis for whether site-specific hazard evaluations should be
performed, aiding emergency preparedness and response, and loss estimation. (Wong 2010). We
believe this study is important to engineers, building architects, policymakers at all levels-local, state
and federal, insurance companies and business owners.
To identify possible scenarios we considered the ShakeMap provided by United States Geological
Survey (USGS), developed for one of the most documented historical earthquakes that occurred in
Mérida in 1674. (Laffaille et al. 2010). This study used Hazus to estimate earthquake damage and
losses. Hazus is a comprehensive GIS-based technology developed by the Federal Emergency
Management Agency (FEMA) in partnership with the National Institute of Building Sciences (NIBS).
By including detailed data on the building inventory, demography, soil condition, region’s geology,
and history of earthquakes in the region we can identify and map the areas of greater vulnerability and
structures with the highest risk.

2. THE STATE AND ITS EARTHQUAKE POTENTIAL
Venezuela is a country that contains many geographical features, from deserts to jungle, and from
extended plains to steep slope mountain ranges. Mérida is settled over an elongated plateau inside a
valley, within the Andean Region in western Venezuela. This plateau is oriented SW-NE surrounded
by two mountain chains: the Sierra Nevada (SE) and the Sierra de la Culata (NW). Two rivers flow
through the tableland: the Chama and the Albarregas rivers. (Castillo 2006).
In the western region of Venezuela, large earthquakes have occurred. One of the most destructive
occurred on March 26, 1812, with an estimate magnitude Ms 7.3; is one of the most controversial
seismic events in Venezuela’s history because it affected the whole country and also had destructive
effects in Saint Vincent and Jamaica. Caracas, a city of 32,000 inhabitants and the capital of
Venezuela, was reduced to ruins, and most of the churches were completely destroyed. La Guaira,
Maiquetia, Mérida and San Felipe suffered the same fate. (Laffaille et al. 2009). The last ruinous
earthquake occurred on April 28, 1894 in the central longitudinal valley between Mérida and
Bailadores, with a magnitude Ms 7.1; 345 people were killed.
Mérida has not experienced a damaging local earthquake during the last few hundred years, which has
contributed to a false feeling of stability in society. However the city has experienced slight ground
shaking numerous times during the recent past due to local low-magnitude earthquakes.
The seismic zone map of the Venezuelan standard for seismic regulations (COVENIN1756:2001)
divides the country into seven zones; the hazard in these zones can be described as very high, high,
intermediate and low. Design peak ground acceleration varies from 0.40g in the zone 7 to 0.10 g in
zone 1 at rock sites, associated to a probability of exceedance of 10% in 50 years. Mérida State is
placed in seismic zone 5 as a high seismic zone that is consistent with the global hazard map
developed by the Global Seismic Hazard Assessment Program (GSHAP).
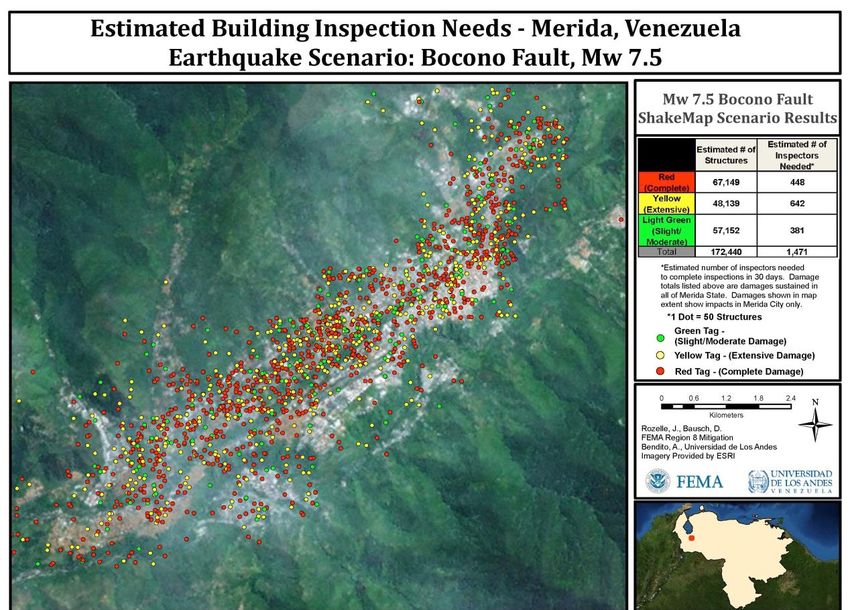
Mérida State is located on the western region of Venezuela, with the fault systems of Boconó, Oca-
Ancón, Perijá and the Nido of Bucaramanga being the principal tectonic features, which have
historically been the cause of important earthquakes. Fig. 1 shows the active quaternary faults of the
western Venezuela.
Figure 1. Neotectonic map of western Venezuela, showing active
quaternary faults. (Bendito et al. 2001).
3. SELECTION OF SCENARIO EARTHQUAKES

The scenario earthquake in the Hazus earthquake model, may be a deterministic event, a probabilistic
analysis of seismic hazard or given by a user-supplied map of ground motion. The user-supplied map,
with the ShakeMap, will be used for this study.

3.1 ShakeMap scenario earthquake

A ShakeMap is a representation of ground shaking produced by an earthquake. The information it
presents is different from the earthquake magnitude and epicenter that are released after an earthquake
because ShakeMap focuses on the ground-shaking produced by the earthquake, rather than the
parameters describing the earthquake source. So, although an earthquake has one magnitude and one
epicenter, it produces a range of ground shaking levels at sites throughout the region depending on
distance from the earthquake, the rock and soil conditions at sites, and variations in the propagation of
seismic waves from the earthquake due to complexities in the structure of the Earth's crust. ShakeMap
generates separate maps of the spatial distribution of peak ground-motions (acceleration, velocity, and
spectral response) as well as a map of instrumentally derived seismic intensities. These maps provide
a rapid portrayal of the extent of potentially damaging shaking following an earthquake and can be
used for emergency response, loss estimation, and for public information through the media. For
potentially damaging earthquakes, ShakeMap produces response spectral acceleration values at three
periods (0.3,1.0, and 3 s) for use not only in loss estimation, but also for earthquake engineering
analyses. Response spectra for a given location are useful for portraying the potential effects of
shaking on particular types of buildings and structures. Following a damaging earthquake, ShakeMaps
of spectral response will be key for prioritizing and focusing post-earthquake occupancy and damage
inspection by civil engineers. For the Hazus program, the ShakeMap system produces a hazus.zip file
containing the GIS layers that Hazus requires, including PGA, PGV and spectral accelerations at 0.3
and 1.0 seconds. In addition, ShakeMap modeling incorporates available strong ground motions
wither recorded on strong motion instrumentation or through the Did You Feel It? internet intensity
information http://pubs.usgs.gov/tm/2005/12A01/.
We used a USGS ShakeMap scenario, representing the historical earthquake that occurred in Mérida
in 1674 with an estimated magnitude Ms 7.5. We used Chiou & Youngs 2008 (an NGA relations) for
the peak ground and spectral values, Trevor Allen's (TA09) intensity prediction equation and Wald et
al. 1999 equations to relate ground motion to intensity (GMICE).

4. METHODOLOGY

This study used Hazus to estimate earthquake damage and losses. Hazus is a GIS-based desktop
application used for comprehensive seismic risk assessment modeling. This tool allows an
engineering approach to modeling of infrastructure and helps in quantifying consequences to
interdependent systems and sectors. The technology was developed by the Federal Emergency
Management Agency (FEMA) in partnership with the National Institute of Building Sciences (NIBS).
The first version of Hazus was made only for earthquake loss estimation. The recent version Hazus
(2.0 was used) is extended to multi hazard loss estimation and also includes, hurricane and flood loss
estimation. Government agencies and researchers use Hazus for mitigation, emergency preparedness,
and disaster response. The software was adopted successfully in several states in the USA (e.g.
Kircher et al. 2006; Tantala et al. 2008) and recently it was even tested and adopted in several
countries overseas. Istanbul (Turkey), Newcastle (Australia), Taiwan, Bhuj (India), Israel (Levi et al.
2010) and Bangkok (Thailand).
A conceptual view of how Hazus methodology works is shown in Fig. 2. The advantage of this
modular methodology is that it enables users to limit their studies to selected losses. For this study, for
example, we concentrated our efforts on the direct physical damage to building stock estimate direct
losses.

Figure 2. Modules of HAZUS methodology.

The building stock is classified both in terms of their use, or occupancy class, and in terms of their
structural system, or model building type. Twenty-eight occupancy classes define residential,
commercial, industrial, or other building occupancies and 36 model-building types define structural
systems of wood, steel, concrete, masonry materials, and mobile homes.
The building damage functions distinguish among buildings that are designed to different seismic
standards, or are otherwise expected to perform differently during an earthquake. Damage functions
are provided for three “code” seismic designs levels, categorized as High-Code (H), Moderate-Code
(M), and Low-Code (L), and an additional design category for Pre-Code buildings. The Pre-Code
design category includes buildings built before seismic codes were required for building design.
(Kircher et al. 2006). The Hazus building damage functions have two basic components: capacity
curves and fragility curves. The capacity curves are based on engineering parameters of structural
strength that characterize the non-linear pushover structural behavior of the 36 types of model
buildings. The fragility curves, describe the probability of reaching or exceeding discrete states of
damage for the structure and nonstructural systems. The states of the damage are: None (N), Slight
(S), Moderate (M), Extensive (E) and Complete Damage (C). Descriptions of these damage states are
found in the Hazus Technical Manual (NIBS 2012).
The methodology for determining injuries and casualties is based on the strong correlation between
building damage (both structural and non-structural) and the number and severity of casualties.

5. DATA COLLECTION AND PREPARATION

To generate more accurate estimates, this study collected and incorporated region and specific
inventories including soil maps, liquefaction susceptibility, landslide susceptibility, demographic data,
building inventory.

5.1 Soil condition

The Venezuelan Code, COVENIN1756:2001, divides the soil into three classes S1 (hard and dense
soil) to S3 (soft and loose soil). Hazus divides the soil into five classes, from hard rock (A) to soft
rock (E). In the Table 1 we can see the equivalence done between the soil types using Hazus format
and Venezuelan code.
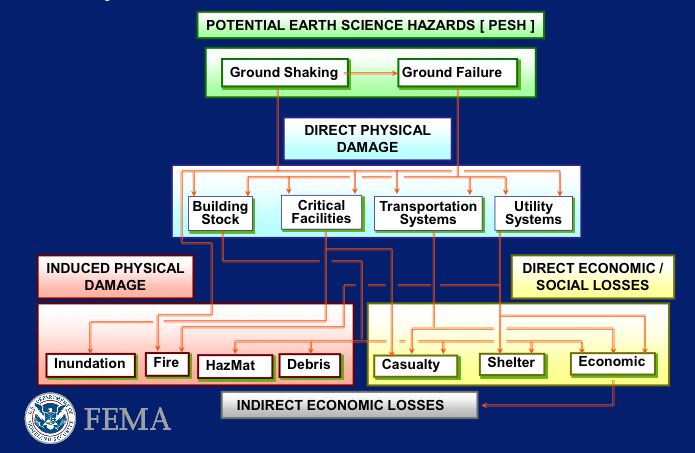
Table 1. Equivalence between soil types for Hazus format and Venezuelan code

5.2 Other induced effects

Other induced local effects, such as liquefaction and landslide were aggregated into Hazus, using the
information and results maps provided by Castillo (2006).

5.3 Demographic data

The required population totals and demographic distributions were derived using Oak Ridge National
Labs Landscan 2008 population data and census data obtained from the website pages referenced in
the references below, and assigned to each census tract by following the procedure suggested by
Hansen et al. 2010.
Our study provides estimated impacts for both a daytime and nighttime scenario.
The geographical size of the detailed Mérida study region is 5,711 square miles and contains 2,448
census tracts. For the urban area the census tracts have one square kilometer and for the rural area ten
square kilometer.

5.4 Building inventory

Past earthquakes have shown that economic and social losses are primarily a function of damage to
buildings. This is true for two very basic reasons: (1) buildings are the predominant kind of facility in
the built environment; and (2) buildings are vulnerable to earthquake damage. Buildings provide
shelter for people, whether at home or at work, house commercial and industrial operations, and serve
as essential facilities, such as schools and hospitals. Accurate prediction of building damage and loss
is at the heart of the reliable estimates of earthquake impacts. (Kircher et al. 2006).
The building inventory data for Mérida State are based on census data, field data from different
studies conducted at the Universidad de Los Andes, personal knowledge and experience from expert
professionals. The building inventory includes residential, commercial, industrial, agricultural,
religious, government, and educational buildings.
The building stock in the region used in this work consists of about 172,900 buildings. The stock was
classified according to the following types of occupancy: residential, 81% of the total number of
buildings; commercial and industrial (18%); religious, governmental and educational (1%).
The buildings were further aggregated into Hazus by the year built, estimated floor area, the number
of stories and the seismic design level. We also collected detailed information for some buildings for
example the University hospital (Hospital type IV), key government buildings, theaters, and airports
were aggregated and included into Hazus.
The damage state probability of the general building stock is computed at the centroid of the census
tract.
Since there are no specific damage functions available for Mérida State, the present study used the
default functions provided by Hazus that best fit the Mérida building types and design levels. The 36
model building types were reduced to six groups (Table 2) that best fit the Mérida building types.
Table 2. The main building types for Mérida State. (For more details see Table 3.1 in the technical manual of
Hazus)

6. RESULTS AND DISCUSSION

Obviously an accurate performance of a particular edification depends on many variables, these
include, the presence or absence of irregularities in height, the level of structural redundancy,
differences in the height between adjacent buildings, the disposition of non-structural elements, the
accuracy of the structural calculus, the relative fulfillment of structural detail, the level of inspection
and the control of construction and even the degree of existing maintenance. But we believe that with
the variables that we are using, we can present the major aspects of seismic risk for Mérida State.

6.1 Building damage

Hazus estimates that about 144,951 buildings will be at least moderately damaged (damage is
expressed as the probability that a given building will develop at least moderate damage). This
corresponds to over 48% of the buildings in the region. There are an estimated 67,148 buildings that
will be damaged beyond repair. Table 3 below summarizes the expected building damage by general
occupancy and by general building type in Mérida State.

Table 3. Expected Building Damage by Occupancy and by Building Type for some of the states of damage

The majority of damage will occur in residential structures, which are predominately unreinforced
masonry. In this sense, it is appropriate to start a mitigation plan for the residential housing in order to
reduce their vulnerability.
Figure 3. Estimated Building Inspection Needs

This map depicts building damages and estimated building inspection needs. Buildings marked as
yellow or “extensive” require greater inspection time. Slight/moderate damaged buildings can be
indentified for re-entry much faster due to their level of damage, and completely damaged buildings
are quickly identified for no reentry. Extensively damaged buildings need further inspection to verify
their safety.

6.2 Casualties

The casualties (people that will be injured or killed by the earthquake) are broken down into four (4)
severity levels that describe the extent of the injuries. The levels are described as follows:
Severity Level 1: Injuries will require medical attention but hospitalization is not needed.
Severity Level 2: Injuries will require hospitalization but are not considered life threatening.
Severity Level 3: Injuries will require hospitalization and can become life threatening if not promptly
treated.
Severity Level 4: Victims are killed by the earthquake.

Table 4 below provides a summary of the casualties for each scenario at different times of the day; 2
am (when people are asleep and at home) and 2 pm (when people are at work).

Table 4. Casualty Estimates
By far, this event at 2 am would result in more injuries and deaths. This time represents when the
residential occupancy load is at maximum. Therefore we need to start mitigation plans especially
focused on residential housing in order to reduce its vulnerability to future earthquake events.

                             Figure 4. Life Threatening Injuries Assessment

This map depicts life threatening injuries (Hazus level 3 injuries) for this event. Total numbers of
collapsed buildings were also calculated based on number of completely damaged buildings for each
structure type, and the collapse rates for completely damaged structures by type. This total can
greatly assist in identifying the number of USAR (Urban Search and Rescue) teams required for live
saving efforts

7. CONCLUSIONS

While we have shown that Hazus is a useful loss estimation methodology there are several necessary
steps required to improve the existing Hazus database (e.g. developing capacity and fragility curves
for the Mérida State, in accordance with the Hazus platform demands).
In this paper we have implemented a GIS tool to obtain seismic risk scenarios in urban and rural areas
and we have analyzed the case of Mérida State (Venezuela). This has been possible because of the
great amount of information available about the seismic hazard of the city and the typology, age and
other characteristics of almost the complete stock of buildings of the city. This project can be
improved by collecting and inputting the data of the essential facilities such as hospitals, schools,
electric power stations, pumping stations, water, gas, electricity, communications, data of hazard-
material facilities, etc.
These methods should be extended to a multi-hazard assessment, including floods, liquefaction, and
land sliding.
Mérida currently has high seismic risk because of its tremendous assets, concentration of buildings,
and the fragility of their structures. The residential buildings would be the most severely affected.
Without doubt, Venezuela has seismic design code, but the damage clearly demonstrated that
improvement is needed in pre- earthquake mitigation.
People need to be given sufficient information to enable them to make their own, sensible, personal
safety risk assessments. In the medium and longer terms, more education for the general public about
seismic risk, what happens during an earthquake and the simple rules for construction that can help
mitigate the risk of building collapse will go a long way. Once people understand the hazard better
they will be in a stronger position to make better decisions. We believe these results will enable the
State and City Governments to prepare and thus reduce the potential impact of a future seismic
disaster.
ACKNOWLEDGEMENT
To the mayor of Mérida city, Dr. Lester Rodriguez, for recognizing Mérida city seismic vulnerability and
supporting this university-local government collaborative effort. We thank the professors: Jaime Laffaille,
Arnaldo Guitierrez and Angel Rangel for many discussions and their valuable comments to help with this
project. We also thank USGS specially Dr. David Wald for generating the ShakeMap scenario earthquake. The
authors greatly appreciate information provided by Instituto de Protección Civil y Administración de Desastres
del estado Mérida (INPRADEM) and Fundación Venezolana de Investigaciones Sismológicas (FUNVISIS).
REFERENCES
Bendito, A., Rivero, P. and Lobo-Quintero, W. (2001). Curvas de Isoaceleración para Estados de Desempeño
Estructural en el Occidente de Venezuela. Boletín Técnico del Instituto de Materiales y Modelos
Estructurales (IMME), Venezuela. 39: 2,1-18.
Castillo, A. (2006). Seismic risk scenarios for buildings in Mérida, Venezuela. Detailed vulnerability assessment
for non-engineered housing. Doctoral Dissertation, Technical University of Catalonia, Barcelona.
Hansen, R., Bausch, D., Rozelle, J. and McNabb, S. (2010). An Updated GIS-Based Methodology for
Exporting the Hazus Earthquake Model for Global Applications: HAZ EM (Extended
Mediterramean) Loss Estimation. Available via
www.unesco.org/science/doc/earthquake/RELEMR2010_Short_Description_Agenda.pdf.
Kircher, C.A., Whitman, R.V., and Holmes, W.T. (2006). HAZUS Earthquake Loss Estimation Methods.
Natural Hazards Rev. 7: 2, 45-59.
Laffaille, J., Ferrer, C. and Laffaille, K. (2009) Venezuela: The Construction of Vulnerability and Its Relation to
the High Seismic Risk. Developments in Earth Surface Processes. 13(C), 99-114.
Laffaille, J., Audemard, F., Alvarado, M. (2010). San Antonio de Mucuño, Mérida Andes, Venezuela:
Relocation of a doctrine town following the 1674 earthquake. The Geological Society of America
Special Paper 471.
Levi, T., Tavron, B., Katz, O., Amit, R., Segal, D., Hamiel, Y., Bar-Lavi, Y., Romach, S., Salamon, A.
(2010). Earthquake loss estimation in Israel using the new HAZUS-MH software: preliminary
implementation. Geological Survey of Israel, Report GSI /11
National Institute of Building Science NIBS. (2012). HAZUSMH technical manual, developed by the
Federal Emergency Management Agency, FEMA, Washington, DC.
http://www.fema.gov/plan/prevent/hazus/.
Tantala, M., Nordenson, G., Deodatis, G and Jacob, K. (2008). Earthquake loss estimation for the New York
City Metropolitan Region. Soil Dynamics and Earthquake Engineering, 28, 812–835.
Wald, D.J., Quitoriano, V., Heaton, T.H., and Kanamori, H. (1999). Relationship between Peak Ground
Acceleration, Peak Ground Velocity, and Modified Mercalli Intensity in California. Earthquake
Spectra. 15,3, 557-564.
Wong, Ivan (2010). Development of Urban Earthquake Hazard Maps in the United States. China/USA
Symposium for the Advancement of Earthquake Sciences and Hazard Mitigation Practices.
Web pages:
Censo 2001, de las Proyecciones de Poblacion 1950-2050, y de los Anuarios Estadisticos anuales:
http://www.ine.gov.ve/
http://www.google.co.ve/
Fuentes: Prof. Dinorah Castro"Estudio sobre heterogenidad genetica y direccion del flujo genico en la poblacion
venezolana". Laboratorio de Genetica Humana, IVIC/ www.simonbolivar.org. Revista
Interciencia, enero 2001, vol.26, no. 001.You can also read