Effects of Explosion Shock Waves on Lung Injuries in Rabbits
←
→
Page content transcription
If your browser does not render page correctly, please read the page content below
Hindawi
Shock and Vibration
Volume 2021, Article ID 6676244, 10 pages
https://doi.org/10.1155/2021/6676244

Research Article
Effects of Explosion Shock Waves on Lung Injuries in Rabbits

          Yanlong Sun ,1 Xinming Qian ,1 Chi-Min Shu ,2 Ziyuan Li ,1 Mengqi Yuan ,1
          Qi Zhang ,1 and Yanteng Li 3
          1
            State Key Laboratory of Explosion Science and Technology, Beijing Institute of Technology, Beijing, China
          2
            Department of Safety, Health, and Environmental Engineering, National Yunlin University of Science and Technology, Douliu,
            Yunlin, Taiwan
          3
            Department of Neurosurgery, Navy General Hospital of PLA, Beijing, China

          Correspondence should be addressed to Mengqi Yuan; myuan@bit.edu.cn

          Received 15 November 2020; Revised 29 December 2020; Accepted 31 January 2021; Published 10 February 2021

          Academic Editor: Isabelle Sochet

          Copyright © 2021 Yanlong Sun et al. This is an open access article distributed under the Creative Commons Attribution License,
          which permits unrestricted use, distribution, and reproduction in any medium, provided the original work is properly cited.
          The purpose of this study was to explore the damage effects and injury mechanism of free-field explosion shock waves on rabbit
          lungs. Six free-field explosion experiments, each with 500 g trinitrotoluene (TNT), were conducted as the shock wave overpressure
          acting on the rabbits was measured. The peak overpressure of the shock wave was 533, 390, 249, 102, and 69 kPa at the respective
          test points. Damage to the rabbit lungs caused by shock wave overpressure was investigated through observation, anatomical
          analysis, and hematoxylin-eosin (HE) staining processing. The shock wave overpressure of 69–102 kPa caused mild-to-moderate
          injury; the shock wave overpressure of 102–249 kPa caused moderate injury; the shock wave overpressure of 249–390 kPa resulted
          in moderate-to-severe injury; and the shock wave overpressure of 390–533 kPa caused severe injury to the rabbit. Mild, moderate,
          and severe injuries destroyed some, most, or all alveolar structures, correspondingly, as well as producing partial cell apoptosis.
          The overpressure damage mechanism primarily involves the collapse and rupture of pulmonary alveolus in the lung tissue. As a
          novel attempt, the investigation provided here may serve to improve the current shock wave injury mechanism.

1. Introduction                                                             Form literature, previous researchers had explored lung
                                                                        injury effects and explosion shock wave mechanisms. Re-
Explosive weapons may severely injure civilians as well as              search showed that the functional and morphological
state officials during military conflicts and terrorist attacks            damage to animals is most severe in combined injury
[1–7]. Injury to the lung as induced by the weapons is one of           groups. A high velocity fragment striking the extremity
the most dangerous, and even fatal, results of an explosion.            aggravates blast injury to the lungs. The most commonly
The lung, as a gas-containing organ, is highly vulnerable to            injured organ in an explosion is indeed the lungs, which may
explosive overpressure and particularly susceptible to bar-             be unaccompanied by any aggravation to the heart or ab-
otrauma [8–10]. The incidence of primary blast lung injury              dominal organs [14]. Explosive experiments conducted on
(PBLI) in immediate fatalities may be as high as 47% [11]. In           sheep have shown that the lung is most sensitive to trini-
a study on explosive injury victims who survived to emer-               trotoluene (TNT) explosions, whereas the upper respiratory
gency admission, PBLI was present in 11.2% of 648, 16.2% of             tract is most sensitive to muzzle explosion waves. The injury
mounted injuries, and 17.1% of dismounted injuries in the               thresholds of overpressure were 29.0, 29.5, and 41.2 kPa for
same sample developed for PBLI, which is significantly                   the upper respiratory tract, lungs, and gastrointestinal tract,
associated with increased mortality [12, 13]. The main                  respectively, at a single exposure. Repeated exposure (up to
physiological characteristics of PBLI are pulmonary hem-                60 explosions) also reduced the injury threshold of the
orrhage, edema, and microcirculation dysfunction, alveolar              internal organs. Existing safety limits protect 90% of the
rupture, pulmonary bullae, and atelectasis; any or all of these         exposed population against internal organ injuries due to
may be present at varying extent of severity.                           weak explosion shock waves [15].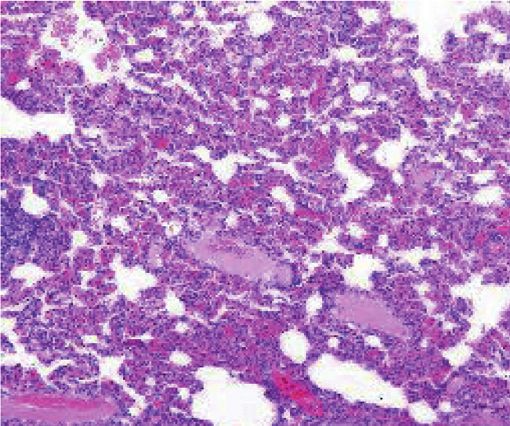
2                                                                                                           Shock and Vibration

    Lung injury severity increases as the peak pressure and       2.3. Experimental Setup. Tests were conducted at the East
duration of an explosion increases. This relationship can be      Garden Experimental Base of Beijing Institute of Technol-
expressed with linear regression equations; the physical          ogy, which was designed specifically for explosion experi-
parameters of the underpressure can be used to indicate the       ments. The layout of the experimental site is shown in
severity of the injury to the lungs, as well [8]. Previous        Figure 1 and Supplementary Figure 1.
researchers had determined the threshold range of damage              The explosion test system primarily consists of cylin-
to animals under the action of two types of complex waves         drical TNT explosives, electric detonators, an initiator,
generated by TNT explosions [16]. The damage effects of            trigger lines, pressure sensors, a multichannel transient
blast overpressure and underpressure on the lungs of rats         recorder, and a high-speed camera. The connections among
and rabbits were investigated with a self-made shock wave         test parts are shown in Supplementary Figure 2. The dis-
segmented simulator, for example, to reveal the mechanism         tances between rabbits and the explosion center were 1.0,
of overtension effects in blast injuries [17].                     1.2, 1.5, 2.0, and 2.5 m, individually. The TNT, pressure
    There is a wealth of extant research on the biological        sensors, and rabbits were all placed 1.5 m above the ground.
effects of overpressure on the lungs [18–20]. However, the         Free-field pressure sensors were used to measure the
precise mechanism of injury is not known yet. In this study,      overpressure of each explosion shock wave. The TNT ex-
we examined the damage effects and injury mechanisms of            plosives were detonated by electric detonators as experi-
TNT explosion shock waves on the lungs of rabbits to ex-          mental data were gleaned and recorded by the multichannel
plore the relationship between the physical parameters of the     transient recorder. The free-field explosion experiments
waves and internal organ injury. This analysis may serve to       were carried out in six replications each with 500 g TNT. The
define effective safety limits for weak blast waves as well as      peak overpressures at the test points in all six explosions
safety limits on battle training for military personnel; our      were determined by analyzing these data.
results may also be used to design weak blast wave protection         Prior to the test, the rabbits were anesthetized and fixed on
devices.                                                          brackets with ligaments so that their chests and abdomens
                                                                  faced the explosion center. Pressure sensors were properly fixed
2. Materials and Methods                                          beside the rabbits. Sensors from the inside to the outside of the
                                                                  explosion center were, respectively, labeled as channels (ch) 1,
2.1. Animals. A total of 32 adult male rabbits, each weighing     ch 2, ch 3, ch 4, and ch 5, as shown in Figure 1. The high-speed
2.0–2.5 kg, were used in the experiment. Thirty of them were      camera was initiated at the moment the TNT was detonated to
anesthetized using 1.5% pentobarbital sodium in a dose of         record the explosion process. The rabbits were removed from
30 mg/kg per body weight and morphine (5 mg/kg) was used to       the brackets just after the experiment was completed. Injury to
relieve their pain. We divided them into six groups of five        their lungs was judged by preliminary observation; then the
rabbits each. The remaining two (without anesthesia) were used    rabbits were dissected to further observe the injuries. The lungs
as a control group. Procedures involving animals and their care   were then removed from the thorax, examined, photographed,
were conducted in conformity with NIH guidelines (NIH Pub.        and immersed in 10% formalin. The fixed lungs were sectioned,
No. 85–23, revised 1996) and were approved by Institutional       embedded with paraffin, and examined microscopically to
Animal Care and Use Committee of the Navy General Hospital        observe histopathological changes. The animal’s anatomy and
of PLA (People’s Liberation Army), China.                         naked eye observation in the explosion field and the subsequent
                                                                  section production and treatment were all completed by
                                                                  medical chairs doctors of the Navy PLA at China’s General
2.2. Overpressure Calculation. As planned, we estimated the       Hospital, Beijing.
peak overpressure of shock wave in a 500 g TNT explosion at
different locations based on the empirical formula estab-
lished by Sadovskyi. The calculated values were used to           2.4. Statistical Analysis. The explosion experiment was re-
determine the distances of the rabbits from the center of the     peated 6 times. SPSS 24.0 software (IBM Corp., Armonk,
explosion. The target shock wave overpressure range was set       NY, USA) was used for statistical analysis of experimental
to 75–550 kPa. Location distances were selected as 1.0, 1.2,      data. Comparisons of means among and within groups were
1.5, 2.0, and 2.5 metres (m), accordingly.                        performed using one-way repeated-measures analysis of
    Sadovskyi’s empirical formula [21] is expressed as in the     variance (ANOVA). Differences in count data were tested
two following equations:                                          for statistical significance with the Chi-square test. A P value
                1.07                                              < 0.05 was considered statistically significant.
        Δp1 �        − 0.1 ,   r ≪ 1.0 ,                   (1)
                 r3
                                                                  3. Results
               0.076 0.255 0.65
        Δp1 �         + 2 + 3 , 1.0 ≪ r ≪ 15 ,            (2)     3.1. Computational Simulation. A simulation model in
                  r       r      r
             √��                                                  ANSYS LS-DYNA was built to determine the relation be-
where r � r/ 3 w is the “contrast distance,” w is the TNT         tween the TNT equivalent and distance from the explosion
equivalence, r is the distance from the center of the ex-         center based on the experimental scenario (Figure 2). The
plosion to the test point, and Δp1 is the peak overpressure of    shock wave overpressures at the test points were calculated
the blast shock wave. Units are kg, m, and MPa, respectively.     to glean the results discussed below.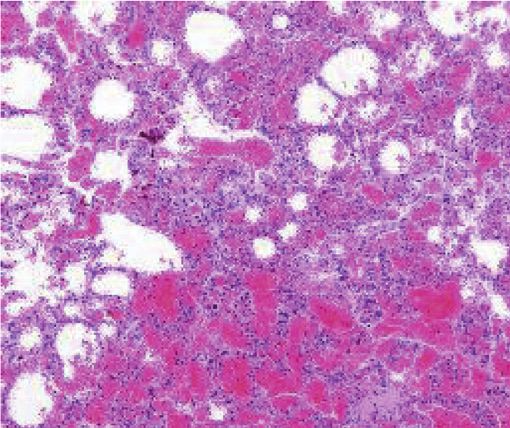
Shock and Vibration                                                                                                             3

                                                                                                     Top view

                                                             ch 3                            ch 4

                                                 ch 2

                                                                                                         ch 5

                                                          ch 1

                                                            1.0 m
                       0.5m       0.5m
                                            0.3m 0.2m

                                                                         High-speed camera

                                                                    Ground
                      Rabbits, sensors, and TNT were
                         1.5m above the ground

                      TNT blast source

                      Pressure sensor

                      Rabbit

                                         Figure 1: Schematic diagram of experimental site layout.

    The peak overpressures of the blast shock wave at dif-             Supplementary Figure 3. The interval between P1 and P2 was
ferent test points were obtained according to the empirical            1 ms; the interval between P2 and P3 was 9 ms. The interval
calculations and LS-DYNA numerical simulations as listed               between the photos shown below was 10 ms. The relations
in Table 1. The empirical calculations and numerical sim-              between the shock wave overpressure and time at different
ulation values are in close agreement. The formulas we used            positions are delineated in Figure 3.
thus provided an accurate reference for the selection of                   Figures 3(a)–3(e) are overpressure-time curves of the
experimental TNT equivalents and explosion distances.                  shock waves at distances of 1.0, 1.2, 1.5, 2.0, and 2.5 m,
                                                                       respectively. The curves measured by corresponding ex-
                                                                       periments were not as smooth as the curves obtained by
3.2. Experimental Data on Shock Wave Overpressure. As                  numerical simulation. The experimental curves also had
discussed above, explosion experiments were carried out in             multiple peaks; the first peak was the target value of the
six replications. The explosion process (from P1 to P9) was            experiment. The peak appeared earlier when it was closer to
recorded by the high-speed camera as illustrated in                    the explosion center, while subsequent peaks were formed by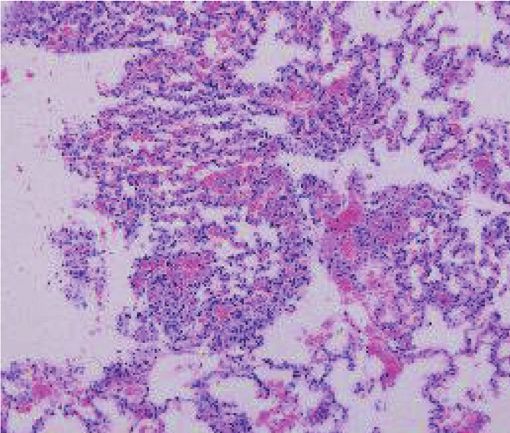
4 Shock and Vibration
600
500g TNT
500
400
Pressure (kPa)
300
200
100
0
0 1 2 3 4 5 6 7
Time (ms)
1.0m from the explosion 2.0 m from the explosion
center center
1.2m from the explosion 2.5m from the explosion
center center
1.5m from the explosion
center
Figure 2: Overpressure-time curve of 500 g TNT (LS-DYNA).
Table 1: Peak overpressures at varying distance from 500 g TNT blast.
√�� Peak overpressure (kPa)
TNT quality (w/g) Distance (r/m) Contrast distance r � r/ 3 w
LS-DYNA M. A. Sadovskyi’s empirical formula
1.0 1.26 559 546
1.2 1.51 379 350
500 1.5 1.89 226 208
2.0 2.52 114 111
2.5 3.15 78 71
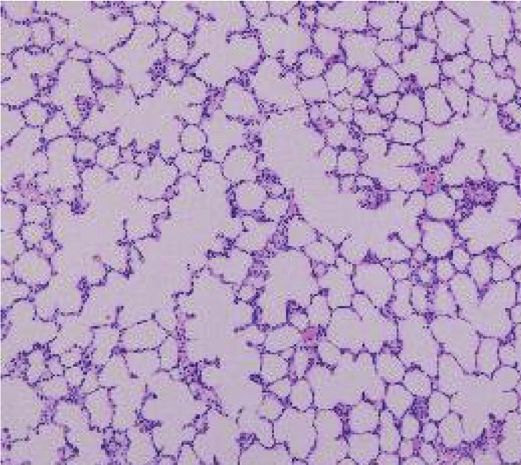
shock wave reflection and other interference factors. The normal lung tissue are illustrated in Figure 5 and those of
shapes of the overpressure-time curves are different at dif- blast-injured tissue are demonstrated in Figure 6.
ferent locations, which reflects the complexity of the inter- The normal lung tissue is clear: The cell membrane was
ference factors in shock wave overpressure measurement. well connected and the space tissue was intact. There was
The peak overpressure of the blast wave at different neither obvious hyperemia or edema nor inflammatory cell
propagation distances was obtained according to the in- infiltration or fibrosis. No obvious exudate was observed in
formation shown in Figure 3. The average values of the six the alveolar space. The alveolar structure was normal and
repeated tests were taken as the final measured values, as without any obvious rupture.
reported in Table 2. The alveolar structure was destroyed and inflammatory cell
For comparison among the measured, estimated, and infiltration occurred in all blast groups regardless of distance to
simulated values of blast wave peak overpressure, three the explosion. A large number of inflammatory cells exuded
curves are plotted based on Tables 1 and 2, as also shown in (black arrows) and filled the surrounding alveoli. The alveolar
Figure 4. In the beginning and the ending part of the structure broke, expanded, and fused to form bullae of lung
curves, the experimental value was smaller than the em- (red arrows) with marked bleeding and localized atelectasis.
pirical formula or numerical simulation values. In the Injury to the lung was more severe, however, when nearer the
middle part, the experimental value exceeded the other explosive center. The 10X microscopy showed near-complete
two. Generally speaking, the three curves were close destruction of the alveoli structure at 1.0 and 1.2 m with only a
enough to indicate sound agreement among the three sets few normal structural alveoli. The cells were compressed and
of data. there was considerable bleeding in this sample as well. An
abundance of inflammatory cells were present in the 40X
microscopy with some apoptotic cells at the 1.0 m distance.
3.3. Injury Situation of the Rabbits. The apparent medical Alveolar damage and the extent of hemorrhaging decreased as
damage to the rabbits’ lung anatomies was evaluated after distance to the blast increased. The 10X microscopy showed
each explosion. The damage was observed with the naked normal partial alveolar structures at 1.5, 2.0, and 2.5 m, with
eyes initially and later by HE staining to determine injury relatively little bleeding. The 40X microscopy showed fewer
to the lung tissue at the cellular level under a scanning inflammatory cells and no apoptotic cells at greater distance
electron microscope (SEM). The HE staining images of from the explosion center.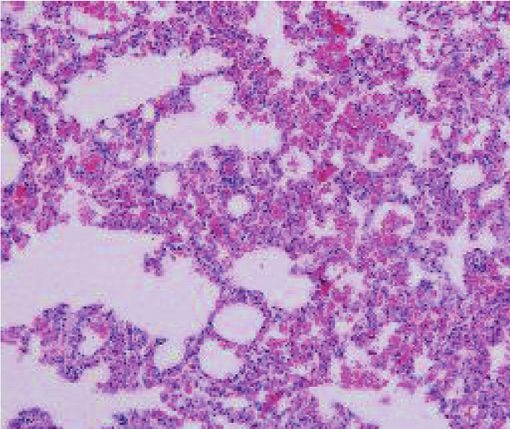
Shock and Vibration                                                                                                                                                                                   5

                      600                                                                                                          400

                      500
                                                                                                                                   300
                      400
    Pressure (kPa)

                                                                                                                 Pressure (kPa)
                                                                                                                                   200
                      300

                      200
                                                                                                                                   100

                      100
                                                                                                                                     0
                        0

                     –100                                                                                                         –100
                            99    100      101     102                     103      104     105      106                                 99     100      101       102        103   104   105   106
                                                    Time (ms)                                                                                                          Time (ms)

                                 ch1: p = 533kPa                                                                                              ch2: p = 390kPa

                                                    (a)                                                                                                                (b)
                      300                                                                                                          200

                      250                                                                                                          150

                      200
                                                                                                                                   100
    Pressure (kPa)

                                                                                                                 Pressure (kPa)

                      150
                                                                                                                                    50
                      100
                                                                                                                                     0
                       50
                                                                                                                                   –50
                        0

                                                                                                                                  –100
                      –50
                            99    100      101     102                     103      104     105      106                             100        101      102       103        104   105   106   107
                                                    Time (ms)                                                                                                          Time (ms)

                                 ch3: p = 249kPa                                                                                               ch4: p = 102kPa

                                                    (c)                                                                                                                (d)
                                                                            80

                                                                            60
                                                          Pressure (kPa)

                                                                            40

                                                                            20

                                                                             0

                                                                           –20
                                                                              101     102     103      104                         105        106      107       108
                                                                                                           Time (ms)

                                                                                    ch5: p = 69kPa

                                                                                                           (e)

 Figure 3: Overpressure-time curve with different locations to explosion center. (a) 1.0 m; (b) 1.2 m; (c) 1.5 m; (d) 2.0 m; (e) 2.5 m.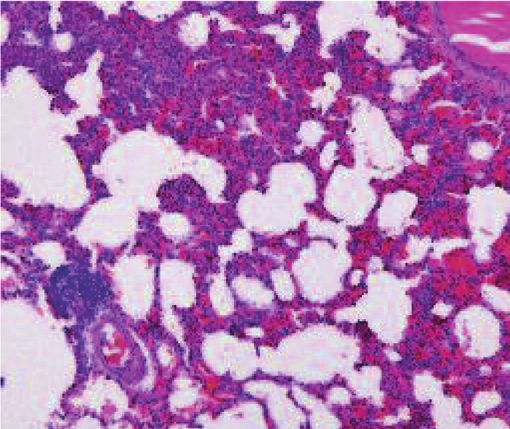
6                                                                                                                        Shock and Vibration

                                         Table 2: Peak overpressures of 500 g TNT blast.
                                                                                       √��
TNT quality (w/g)                Distance (r/m)                Contrast distance r � r/ 3 w                            Peak overpressure (kPa)
                                       1.0                                 1.26                                                 533
                                       1.2                                 1.51                                                 390
500                                    1.5                                 1.89                                                 249
                                       2.0                                 2.52                                                 102
                                       2.5                                 3.15                                                  69

                                                   600

                                                   500

                                                   400
                                  Pressure (kPa)

                                                   300

                                                   200

                                                   100

                                                     0
                                                           1.0         1.5           2.0        2.5          3.0
                                                                             Distance (m)

                                                           M.A. Sadovskyi’s empirical formula
                                                           Experimental data
                                                           LS-DYNA
                                             Figure 4: Comparison of experimental and estimated data.

                     A0: 10X microscopy                                               A1: 40X microscopy

                                                    (a)                                                (b)

                                                   Figure 5: HE-stained lung tissue cells (control group).

4. Discussion                                                                     interruption signals which affected the accuracy in the actual
                                                                                  test process. Blast shock wave tests are usually carried out
4.1. Comparative Analysis of Shock Wave Overpressure.                             with multifragmentation, strong vibration shock, transient
As shown in Figures 2 and 3, the overpressure-time curves                         high temperature, and other parameters. The test process is
obtained by the experiments are not as smooth as the typical                      typically influenced by several factors. For example, the
shock wave overpressure-time curves; there were numerous                          signal produces a spike in interference when the ballistic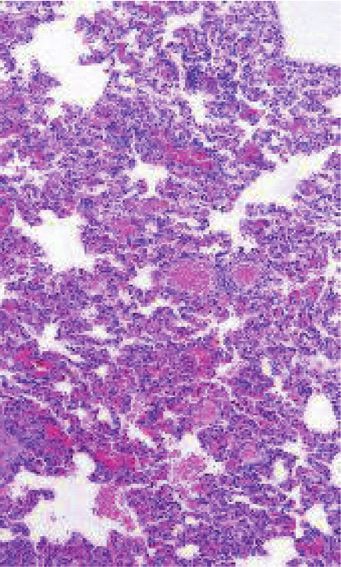
Shock and Vibration                                                                                                                     7

                        B0: 10X microscopy                                  B1: 40X microscopy

                                                            1.0 m                                              1.0 m

                        C0: 10X microscopy                                 C1: 40X microscopy

                                                            1.2 m                                              1.2 m

                        D0: 10X microscopy                                 D1: 40X microscopy

                                                            1.5 m                                              1.5 m

                        E0: 10X microscopy                                  E1: 40X microscopy

                                                            2.0 m                                              2.0 m

                        F0: 10X microscopy                                  F1: 40X microscopy

                                                            2.5 m                                              2.5 m

                                          (a)                                                (b)

Figure 6: HE-stained photos of blast-injured lung tissue cells with varying distance to the explosion center. (a) 10X magnification and (b)
40X magnification. B, 1.0 m from explosion center; C, 1.2 m; D, 1.5 m; E, 2.0 m; F, 2.5 m.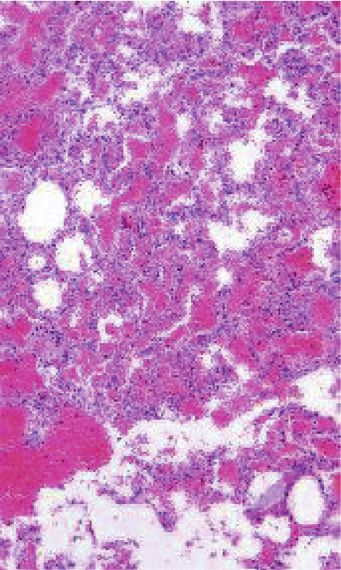
8                                                                                                                    Shock and Vibration

                                           Table 3: Injury of rabbits by blast shock wave.
No.     Distance (r/m)      Peak overpressure (kPa)    Injury level                              Injury situation
1             1.0                    533                  Severe
                                                                        Alveolar structure completely destroyed; partial cell apoptosis
2             1.2                    390                  Severe
3             1.5                    249                Moderate
                                                                                        Most alveolar structures destroyed
4             2.0                    102                Moderate
5             2.5                     69                   Mild                A small number of alveolar structures destroyed

                    Table 4: Traditional damage criteria of shock wave overpressure to human bodies (unit: kPa).
                                                                                         Injury level
Data sources
                                                    Mild                    Moderate                      Severe                   Fatal
American scholar                                     15.7                      23.5                        53.9                   186.34
Former soviet scholar                             19.6–39.2                     —                       39.2–98.0                  235.4
Case statistics of explosion accident             10.8–27.5                 27.5–49.0                   49.0–127.5                 127.5

wave produced by the fragment passes through the sensor               in moderate-to-severe injury; and the shock wave overpres-
surface. The explosive test is usually accompanied by strong          sure in 390–533 kPa caused severe injury to the rabbit. The
mechanical shocks, such as seismic waves or the mechanical            mild, moderate, and severe injuries, respectively, represented
impact of the sensor mounting plate. In addition, high-               a small number of alveolar structures destroyed, most alveolar
temperature effects cause the measured overpressure shock              structures destroyed, and the alveolar structure completely
curve to drift. The explosion also produced high-speed                destroyed accompanied by partial cell apoptosis.
charged ions which form electromagnetic waves acting on                   Table 4 presents the traditional damage criteria of shock
sensors and connecting cables to produce interference sig-            wave overpressure to the human body. The relationship
nals in the pressure test channels. There was also drift on the       between the shock wave overpressure and injury to rabbit
test signal due to the low detection frequency of the test            lungs was far different from the data given by the traditional
system. In short, the entire test system was multiple-input           damage criterion, which was related to the posture of the
and single-output. The signals of shock wave overpressure             rabbit in the experiment [22–24]. The rabbit’s chest and
were mixed with plenty of complex interference signals.               abdomen faced the explosion center in our experiment and
Accordingly, it was essential to filter the shock wave to              the lung was the target organ of the explosion shock wave.
secure accurate results.                                              Therefore, the injury to our rabbits was rather severe. It was
    As shown in Figure 4, the measured peak overpressure of           crucial to rely on not only extant blast wave damage criteria
the blast shock wave diverged from the empirical and                  but also experimental data as a primary evaluation criterion
simulated values; however, the differences were fairly slight.         when evaluating the effects of shock wave overpressure. In
In effect, previously published empirical formulas did have            addition, the characteristics of the experimental scene and
reference significance for estimating explosion shock wave             experimental conditions must also be properly considered.
overpressure. The numerical simulation method we used                 The existing shock wave damage criteria did not account for
was also applicable in the early stages of prediction. Dif-           any experimental conditions and were not supported by
ferences between the measured and estimated values were               clear-cut test parameters or methodology. Objectives and
attributable to the disturbances in the testing process.              comprehensive evaluations should be defined according to
Further, the estimated value can only be used as a reference;         the specific situation (e.g., target object and target scene were
the actual value must be based on a physical experiment. The          explosion mode) to accurately assess the damage effects of
working condition of the empirical formula was the ex-                blast shock waves. The damage criteria of shock wave should
plosion of TNT spherical charges in an infinite air medium,            not be referenced unilaterally; impulse criteria of shock
which was not fully replicable in an actual experiment.               waves should also be considered.
Generally speaking, however, the overpressure test results
were in line with the calculations.
                                                                      4.3. Mechanism of Lung Injury in Rabbits. As shown in
                                                                      Table 3, the rabbits suffered varying degrees of damage under
4.2. Analysis between Damage Criterion and Experimental               the action of different blast shock wave overpressures. The
Results. We divided the level of injury across our sample             mechanism of lung injury related to hemodynamics theory
into four levels according to the degree of destruction of the        and to the pressure difference between the fluid and gas
alveolar structure: mild, moderate, severe, and fatal                 phases in the lung. When the air blast wave acted directly on
(Table 3).                                                            the chest wall, the volume of gas in the thoracic cavity
    As shown in Table 3, the shock wave overpressure in               decreased sharply and swiftly spiked the local pressure in the
69–102 kPa caused mild-to-moderate injury to the rabbit; the          thoracic cavity (tens-fold or even hundreds-fold). The
shock wave overpressure in 102–249 kPa caused moderate                negative pressure led to a prompt expansion on the com-
injury; the shock wave overpressure in 249–390 kPa resulted           pressed air bubbles in the lung, which teared the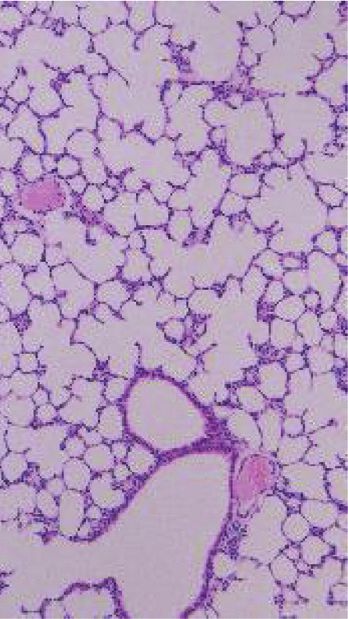
Shock and Vibration                                                                                                               9

surrounding capillaries and venules, causing bleeding and       Conflicts of Interest
allowing blood to enter the trachea. The mixture of edema
fluid and blood formed a pulmonary edema. Injuries to            The authors declare that there are no conflicts of interest
rabbits, from mild to fatal, were characterized by the amount   regarding the publication of this paper.
of bleeding and severity of arterial air embolism.
                                                                Acknowledgments
4.4. Injury Effects of Shock Wave Overpressure on Rabbits.       This work was financially supported by the National Key
The shock wave can be divided into three stages according to    Research and Development Program of China (Grant no.
the damage caused. The first damage effect originated in the      2017YFC0804700).
peak overpressure of the blast shock wave. The second
damage effect involved driving penetration or non-               Supplementary Materials
penetration of rock fragments and other explosion frag-
ments. The third damage effect was caused by the entire          Supplementary Figure 1: experimental site layout. Supple-
displacement of the target due to the shock wave and            mentary Figure 2: schematic diagram of test equipment
pneumatic pressure. The influence of all three factors must      connection. Supplementary Figure 3: pictures (P1 to P9) on
be considered when evaluating the damage effects of blast        explosion of 500 g TNT. (Supplementary Materials)
waves on rabbits as opposed to simply the overpressure; the
duration of the positive pressure zone also merited careful     References
consideration, as well as the specific impulse of the shock
wave.                                                            [1] J. G. Owens, “Physical therapy of the patient with foot and
                                                                     ankle injuries sustained in combat,” Foot and Ankle Clinics,
                                                                     vol. 15, no. 1, pp. 175–186, 2010.
5. Conclusions                                                   [2] H. R. Champion, J. B. Holcomb, and L. A. Young, “Injuries
                                                                     from explosions: physics, biophysics, pathology, and required
Six repeated experiments were conducted in this study to             research focus,” The Journal of Trauma: Injury, Infection, and
delve into the effects of blast shock waves on rabbit lungs.          Critical Care, vol. 66, no. 5, pp. 1468–1477, 2009.
We compared theoretical calculations and experimental data       [3] A. J. H. Korver, “Injuries of the lower limbs caused by an-
including preliminary observations of injuries, medical              tipersonnel mines: the experience of the International
anatomy assessment, and postprocessing of HE staining. The           Committee of the Red Cross,” Injury, vol. 27, no. 7,
conclusions can be summarized as follows:                            pp. 477–479, 1996.
                                                                 [4] J. Ning, L. Mo, H. Zhao et al., “Sodium hydrosulphide alle-
   (1) The blast shock wave overpressures estimated by               viates remote lung injury following limb traumatic injury in
       numerical simulation and empirical formula were               rats,” PLoS One, vol. 8, no. 3, Article ID e59100, 2013.
       deemed accurate by comparison against the over-           [5] T. Josey, Investigation of Blast Load Characteristics On Lung
       pressure determined in the experiment.                        Injury, University of Waterloo, Waterloo, Canada, 2010.
                                                                 [6] P. Singer, C. JD, and M. Stein, “Conventional terrorism and
   (2) The shock wave created complex injuries in the                critical care,” Critical Care Medicine, vol. 33, no. 1 Suppl,
       rabbits characterized by interactions among multiple          p. S61, 2005.
       factors (e.g., dominant overpressure, fragments, and      [7] Q. Zhang, X. M. Qian, Y. Y. Chen, and M. Yuan, “Deflagration
       posture). The shock wave overpressure defined in               shock wave dynamics of DME/LPG blended clean fuel under
       this study was 69–533 kPa, which caused mild-to-              the coupling effect of initial pressure and equivalence ratio in
       severe injury to the rabbits. Mild, moderate, and             elongated closed space,” Journal of Cleaner Production,
       severe injuries were defined, respectively, by a               vol. 250, Article ID 119572, 2019.
       minute number of alveolar structures destroyed,           [8] J. K. Zhang, Z. G. Wang, H. G. Leng, and Z. Yang, “Studies on
       most alveolar structures destroyed, and alveolar              lung injuries caused by blast underpressure,” The Journal of
       structure completely destroyed accompanied by                 Trauma and Acute Care Surgery, vol. 40, no. 3 Suppl,
                                                                     pp. 77–80, 1996.
       partial cell apoptosis. Our results diverged consid-
                                                                 [9] A. Barnett-Vanes, A. Sharrock, T. Eftaxiopoulou et al.,
       erably from those in the extant criteria for shock            “CD43Lo classical monocytes participate in the cellular im-
       wave overpressure. To this effect, the results may be          mune response to isolated primary blast lung injury,” Journal
       used to modify, complement, and perfect the criteria          of Trauma and Acute Care Surgery, vol. 81, no. 3, pp. 500–511,
       to enhance their precision and efficacy.                        2016.
   (3) The mechanism of lung injury was highly compli-          [10] A. E. Ritenour and T. W. Baskin, “Primary blast injury: update
       cated and not yet exceptionally clear. Our results            on diagnosis and treatment,” Critical Care Medicine, vol. 36,
                                                                     no. 7 Suppl, pp. 311–317, 2008.
       indicated that lung injury in rabbits was caused by
                                                                [11] E. R. Frykberg and J. J. Tepas, “Terrorist bombings. lessons
       pulmonary hemorrhage and pulmonary edema.                     learned from belfast to beirut,” Annals of Surgery, vol. 208,
                                                                     no. 5, pp. 569–576, 1988.
Data Availability                                               [12] M. Aboudara, P. F. Mahoney, B. Hicks, and D. Cuadrado,
                                                                     “Primary blast lung injury at a NATO role 3 hospital,” Journal
The data used to support the findings of this study are in-           of the Royal Army Medical Corps, vol. 160, no. 2, pp. 161–166,
cluded within the article.                                           2014.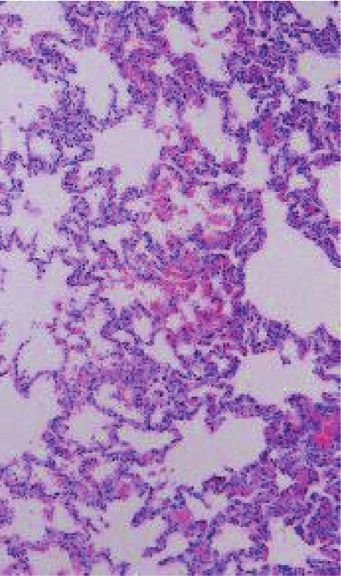
10                                                                       Shock and Vibration

[13] M. Aboudara, B. Hicks, D. Cuadrado, P. F. Mahoney, and
     J. Docekal, “Impact of primary blast lung injury during
     combat operations in Afghanistan,” Journal of the Royal Army
     Medical Corps, vol. 162, no. 1, p. 75, 2016.
[14] J. Z. Huang, Z. Yang, Z. Wang, and H. Leng, “Study on
     characteristics of blast-fragment combined injury in dogs,”
     The Journal of Trauma and Acute Care Surgery, vol. 40, no. 3
     Suppl, pp. 63–67, 1996.
[15] Z. H. Yang, Z. G. Wang, C. G. Tang, and Y. Ying, “Biological
     effects of weak blast waves and safety limits for internal organ
     injury in the human body,” The Journal of Trauma and Acute
     Care Surgery, vol. 40, no. 3 Suppl, pp. 81–84, 1996.
[16] J. Q. Fan, H. X. Dong, Y. H. Gao et al., “Experimental in-
     vestigation on damage effects on animals under the action of
     blast wave in a chamber,” Journal of Vibration and Shock,
     vol. 32, no. 9, pp. 35–39, 2013.
[17] H. B. Chen, Z. G. Wang, Z. H. Yang et al., “Injury of animal
     lungs in the experiments to simulate the three phases of shock
     wave propagation,” Explosion and Shock Waves, vol. 20, no. 3,
     pp. 264–269, 2000.
[18] Z. H. Yang, X. Y. Li, X. Ning et al., “A comparative study on
     viscera injuries caused by underwater blast wave and air blast
     wave,” Chinese Journal of Nautical Medicine and Hyperbaric
     Medicine, vol. 13, no. 2, pp. 65–68, 2006.
[19] T. Josey, D. Cronin, C. P. Salisbury, and K. V. Williams, “The
     effect of blast load conditions on lung injury,” Journal of
     Biomechanics, vol. 39, no. 39, p. S163, 2006.
[20] E. R. Frykberg, Explosions and Blast Injury, Essentials of Terror
     Medicine, Springer, New York, NY, USA, 2009.
[21] J. Henrych, The Dynamics of Explosion and Its Use, Elsevier/
     North Holland, New York, NY, USA, 1979.
[22] P. F. Acosta, “Overview of UFC 3-340-02 structures to resist
     the effects of accidental explosions,” in Proceedings of the
     Structures Congress, pp. 1454–1469, Las Vegas, NV, USA,
     April 2011.
[23] F. X. Cao, Study on Multi-Damage Effect of Explosion, Nanjing
     University of Science and Technology, Nanjing, China, 2008.
[24] Z. Li, “Safety distance for persons under blast air shock,”
     Explosion and Shock Waves, vol. 10, no. 2, pp. 135–144, 1990.
You can also read