CHARGING FORWARD INVESTOR PRESENTATION - MARCH 2021 - BORGWARNER
←
→
Page content transcription
If your browser does not render page correctly, please read the page content below
Charging Forward
Investor Presentation

March 2021
                        1
Forward-Looking Statements
This presentation may contain forward-looking statements as contemplated by the 1995 Private Securities Litigation Reform Act that are based on management’s
current outlook, expectations, estimates and projections. Words such as “anticipates,” “believes,” “continues,” “could,” “designed,” “effect,” “estimates,”
“evaluates,” “expects,” “forecasts,” “goal,” “guidance,” “initiative,” “intends,” “may,” “outlook,” “plans,” “potential,” “predicts,” “project,” “pursue,” “seek,” “should,”
“target,” “when,” “will,” “would,” and variations of such words and similar expressions are intended to identify such forward-looking statements. Further, all
statements, other than statements of historical fact contained or incorporated by reference in this presentation that we expect or anticipate will or may occur in the
future regarding our financial position, business strategy and measures to implement that strategy, including changes to operations, competitive strengths, goals,
expansion and growth of our business and operations, plans, references to future success and other such matters, are forward-looking statements. Accounting
estimates, such as those described under the heading “Critical Accounting Policies and Estimates” in Item 7 of our Annual Report on Form 10-K for the year
ended December 31, 2020 (“Form 10-K”), are inherently forward-looking. All forward-looking statements are based on assumptions and analyses made by us in
light of our experience and our perception of historical trends, current conditions and expected future developments, as well as other factors we believe are
appropriate in the circumstances. Forward-looking statements are not guarantees of performance, and the Company’s actual results may differ materially from
those expressed, projected or implied in or by the forward-looking statements.
You should not place undue reliance on these forward-looking statements, which speak only as of the date of this presentation. Forward-looking statements are
subject to risks and uncertainties, many of which are difficult to predict and generally beyond our control, that could cause actual results to differ materially from
those expressed, projected or implied in or by the forward-looking statements. These risks and uncertainties, among others, include: the difficulty in forecasting
margin performance and free cash flow through 2025 in light of the variables that can impact those results over that period of time; the difficulty in forecasting
demand for electric vehicles and our EV revenue growth to 2030; the ability to identify targets and consummate acquisitions on acceptable terms; failure to realize
the expected benefits of acquisitions; the ability to identify appropriate combustion portfolio businesses for disposition and consummate planned dispositions on
acceptable terms; competitive challenges from existing and new competitors including OEM customers; the challenges associated with rapidly-changing
technologies, particularly as relates to electric vehicles, and our ability to innovate in response; uncertainties regarding the extent and duration of impacts of
matters associated with COVID-19, including additional production disruptions; the failure to realize the expected benefits of the acquisition of Delphi
Technologies PLC that the Company completed on October 1, 2020; the failure to promptly and effectively integrate acquired businesses; the potential for
unknown or inestimable liabilities relating to the acquired businesses; the possibility that the proposed transaction between the Company and AKASOL AG will
not be consummated; failure to obtain necessary regulatory approvals or to satisfy any of the other conditions to the proposed transaction; our dependence on
automotive and truck production, both of which are highly cyclical and subject to disruptions; our reliance on major OEM customers; commodities availability and
pricing; supply disruptions; fluctuations in interest rates and foreign currency exchange rates; availability of credit; our dependence on key management; our
dependence on information systems; the uncertainty of the global economic environment; the outcome of existing or any future legal proceedings; future changes
in laws and regulations, including, by way of example, tariffs, in the countries in which we operate; impacts from any potential future acquisition or divestiture
transactions; and the other risks noted in reports that we file with the Securities and Exchange Commission, including Item 1A, “Risk Factors” in our most
recently-filed Form 10-K. We do not undertake any obligation to update or announce publicly any updates to or revisions to any of the forward-looking statements
in this presentation to reflect any change in our expectations or any change in events, conditions, circumstances, or assumptions underlying the statements.

                                                                                                                                                                               2
Non-GAAP Financial Measures
This presentation contains information about BorgWarner’s financial results that is not presented in accordance with accounting principles generally accepted in
the United States (“GAAP”). Such non-GAAP financial measures are reconciled to their closest GAAP financial measures in the Appendix. The provision of these
comparable GAAP financial measures for 2021 and later is not intended to indicate that BorgWarner is explicitly or implicitly providing projections on those GAAP
financial measures, and actual results for such measures are likely to vary from those presented. The reconciliations include all information reasonably available
to the company at the date of this presentation and the adjustments that management can reasonably predict.

Management believes that these non-GAAP financial measures are useful to management, investors, and banking institutions in their analysis of the Company's
business and operating performance. Management also uses this information for operational planning and decision-making purposes.

Non-GAAP financial measures are not and should not be considered a substitute for any GAAP measure. Additionally, because not all companies use identical
calculations, the non-GAAP financial measures as presented by BorgWarner may not be comparable to similarly titled measures reported by other companies.

                                                                                                                                                                     3
Intentional Growth for a Sustainable Future
                                                                      Revenue from EVs

• Our accelerated electrification
  strategy is a product of our vision
  and long-term focus
BorgWarner Is Evolving Its Mission

                                         Today and Tomorrow

Our mission was
focused on balance:
                              We’re accelerating
Propulsion System Leader
                             toward electrification
for Combustion, Hybrid and
Electric Vehicles             We deliver innovative and sustainable
                              mobility solutions for the vehicle market

                                                                          5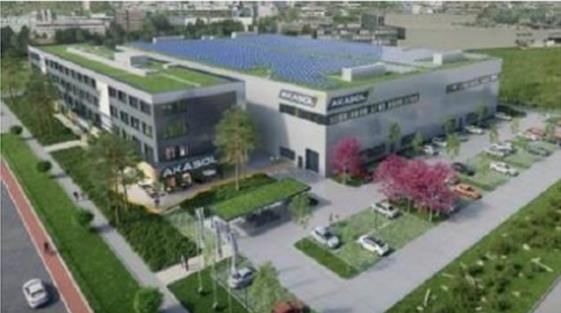
This Evolution Is Consistent with
Our Commitment to Sustainability
             GHG: 50% Reduction by 2030

 tCO2e / $M sales
                                                                      Committed to being
 50
       40.9 Baseline
 40
 30
                   32.0 Progress as of 2019          Goal
                                                     20.5
                                                                      CARBON NEUTRAL
 20
   2015         2018    2021      2024        2027    2030                by 2035
          Energy: 37% Reduction by 2030
                                                                         Our sustainability objectives go hand in hand
   MWh / $M sales                                                        with our strategy to generate financial results
120    109.0 Baseline
100                                                  Goal
 80                                                  69.0
                   89.5 Progress as of 2019
 60                                                          Includes Scope 1 & 2 emissions
      2015       2018     2021     2024       2027    2030

                                                                                                                           6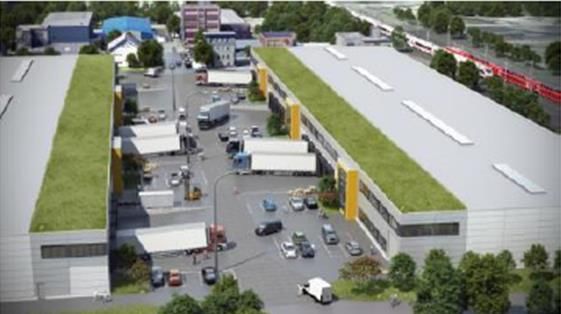
Local
                            Accountability                                                                 Global
                                                                                                           Strength

                   Gender Diversity                                                                               Gender Pay
                              Overall                          New Hires                                          Parity1
                                                                                               33.2%
                               25.6%

                                                                                                                   98.7%
                                                               Leadership                                14.6%

WeEmpower
We  Empower  Our
           Our
Diverse
DiverseTeams
        Teams      Minorities (USA)                        Overall
                                                            21.2%
                                                                                   New Hires
                                                                                     24.7%
                                                                                                            Leadership
                                                                                                                             13.9%

                   1 This
                        study was facilitated by Mercer on behalf of BorgWarner. Baseline data: Regions studied: US and Canada, China,
                   Germany, W. Europe, E. Europe, Latin America, Asia | 6,210 salaried employees Grades 10-19 | Measured pay against gender
                                                                                                                                              7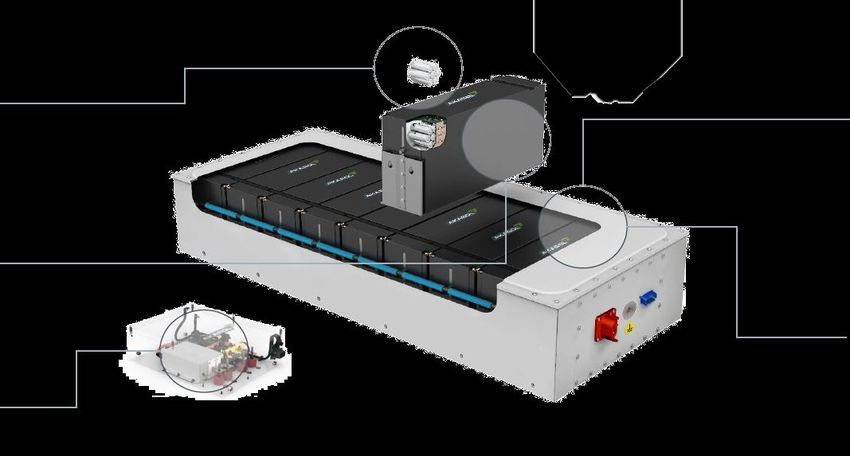
Rising Temperatures Drive Demand for Clean, Efficient Vehicles

External Factors                                               Global Surface Temperature Anomalies – 5-year average

                                                                1

Are Accelerating

                                            Degrees Celsius
                                                              0.4

Demand for Cleaner,                                           -0.2

More Efficient                                                -0.8
                                                                  1880   1900      1920      1940        1960        1980        2000           2020
                                                  NASA figure adapted from Goddard Institute for Space Studies Surface Temperature Analysis

Vehicles                                                        CO2 Emissions Regulatory Standards Normalized to NEDC
                                                               200

                                                               180                                         China            Europe              U.S.
Now is the optimal time to accelerate                          160
BorgWarner’s shift toward electrification                      140

                                              g/km
                                                               120

                                                               100

                                                                80

                                                                60

                                                                40
                                                                 2010           2015           2020                2025                  2030
                                                  NEDC figures adapted from The International Council on Clean Transportation Analysis
                                                                                                                                                   8
We’ve Grown Our Electrification Portfolio
Deliberately over Time
                   Rotating electric      Est. 2025 Content Opportunity per eLV
2015
                    (i.e., motors)
                                                  $2,640
2016
                  Industrial-focused
                  power electronics
2017
                 Electronics for start-            $1,614            Delphi/Sevcon Acquisitions
                  up EV customers                                    — Power Electronics
2018
                  Battery packs and
2019              modules (60/40 JV)
                                                    $509             Remy Acquisition — Motors
                  Power electronics
2020                                                $118             Organic Product Development
                    and software
                                                    $399             2014 Portfolio
                  Battery packs and
2021
                  modules (pending)         2020 Product Portfolio

                                                                                                  9
Electric Vehicles
(% Sales)                                           ~45%

                                             >25%
eLV Market eLV Addressable Market
Expected to ~$76B
eHeater/Other1
15%
Experience CAGR
Profound Growth Power
35% Electronics2
Over Next Decade CAGR ~$38B
BorgWarner has positioned itself to ~$11B Motor+Gear3
capitalize on this growth
2021 2025 2030
EV Market
Penetration 5% 15% 30%
1 Includes high-voltage air heater and high-voltage coolant heater for light vehicle EVs only
2 Includes inverter, DCDC, OBC, CIDD, HV Box and BMS for light vehicle EVs only
3 Includes motors and eGearDrives® for light vehicle EVs only
Source: BorgWarner estimate 11We’re Well Positioned to Seize eLV Market Opportunity
Est. 2025 BorgWarner Combustion Based Electric
Content Opportunity Per
~2.9X Combustion $$
Light Vehicle Summary
Hybrid
$2,640
Combustion
$1,875
$907
Addressable Market $100B $38B
Sources: BorgWarner TAM; IHS Markit, KGP. Excludes: Romeo Power Battery JV opportunities, Service & Aftermarket
12Electric Component Vehicle Sourcing
Electric Drive Motor Gearbox
42% 34%
2025 Addressable 2025 Addressable
outsourced market: outsourced market:
58% $4.2B in 2025 66% $1.9B in 2025
OEM In-House Suppliers OEM In-House Suppliers
On-Board Charger, DC-DC Converter &
Inverter Battery Pack Controller
18% 17%
2025 Addressable 2025 Addressable
outsourced market: outsourced market:
$8.8B in 2025 $9.7B in 2025
82% 83%
OEM In-House Suppliers OEM In-House Suppliers
132025 EV Addressable Market Breakdown
Outsourced $ in billions
Other Power
▪ Power Electronics outsourcing strong Electronics
$9.7
increasing trend Other
(eHeating and
Other Electronics)
▪ Motor outsourcing relatively flat $2.7
through 2025
Outsourced
Inverter
▪ Sub-components insourced market $8.8
represent additional opportunity
Outsourced Insourced
More 70% of Electric Vehicle Addressable Gearbox Market
Market Expected to be Outsourced $1.9 $10.7
Outsourced
Motors
$4.2
14Recent Awards Across EV Product Portfolio
800-volt Electric Motor 400-Volt Inverter High Voltage Coolant Heater
▪ with large global commercial ▪ with a major European OEM ▪ with major European premium
vehicle EV customer launching on next-generation BEVs OEM launching in 2023
in 2024 expected to launch in 2022
Integrated Drive Module (iDM) Electric Drive Modules (eDM) 800-Volt Inverter
▪ for Ford’s new all-electric ▪ for electric JMC-Ford and two ▪ with premium European OEM
Mustang Mach-E SUV other NEV manufacturers in on next-generation BEVs
China expected to launch in 2024
15We’re Prepared to Profitably Scale eLV and
Accelerate Expansion
Estimated BorgWarner eLV Revenue
~$8B Our Objectives
Growth with
End Markets • Deliver on organic growth initiatives
• Leverage next-generation products
Charging ~$3.5B and technologies
Forward
Initiatives • Proactively pursue inorganic growth
opportunities to strengthen
~$250M e-propulsion capabilities and scale
20211 2025 2030
Organic M&A through 2025
1 Estimate at the midpoint of FY21 guidance. Source: BorgWarner estimate.
16eCV Market Also eCV Addressable Market
Poised for 13% ~$29B Forklift
Significant CAGR
Chargers
Acceleration Rest of
World
19% ~$16B Battery1
CAGR
EU & North
~$8B America
BorgWarner enhancing its focus in this
area to participate in rapid growth Inverter2
Motor+Gear2
2021 2025 2030
EV Market
Penetration 6% 8% 14%
1Includes batteries for trucks and buses, material handling, rail, marine, construction & mining
2Includes inverters, motors, and eGearDrives® for global on-road EV trucks and buses as well as off-road estimates
Source: BorgWarner estimate
17…With Significant Potential for Growth
Estimated BorgWarner eCV Revenue
>$2B Our Objectives
Growth with
End Markets • Execute organic growth plan
• Explore potential partnerships or
Charging >$1B collaborations for stronger move
Forward into eCV market
Initiatives
• Complement existing portfolio
through acquisitions
~$100M
2021 1 2025 2030
Organic AKASOL Other M&A through 2025
1 Estimate at the midpoint of FY21 guidance. Source: BorgWarner estimate.
18A More Focused Combustion Business
Areas of Focus Combustion Portfolio Profile
• Support our customers as they bridge Leading market positions
to electrification Growing through 2025+
Strong margins and cash flow
• Focus on technologies that interconnect with
EVs and future mobility needs
• Deliver strong margins, cash flow and
scale benefits Potential Dispositions
• Dispose $3B to $4B in annual revenue Not a product leader
by 2025 Low growth through 2025
More challenged margin profile
19Clear Roadmap to Driving Sustainable Growth
Through 2030
Estimated Organic Growth and Portfolio Realignment… …Sets Up Second Half of Decade
$22B+
$2B to $3B
~$4B Growth attributable
~$18B to market mix
$15B1 $(3B) to $(4B)
~45%
of total
>25%
of total
2021 Organic Growth Acquisitions Dispositions 2025 2030
eLV eCV Combustion Based Aftermarket & Other
1 Estimate at the midpoint of FY21 guidance. Source: BorgWarner estimate.
20Profitability on EV $700 Estimated EV Profitability Characteristics
27.0%
Portfolio Expected $500
+
to Improve as 17.0%
Programs Launch $300
7.0%
$100
Current profitability already reflects
elevated R&D spending for EVs
-3.0%
$(100)
Growth in R&D spending not Breakeven
commensurate with sales trajectory
-13.0%
$(300)
Improving gross margin reflects
expected incremental margins on –
increasing sales $(500) -23.0%
2021 2022 2023 2024 2025
Gross Profit $ R&D $ Operating Margin
Source: BorgWarner estimate 21Committed to Top-Quartile Margin Profile
Adj. Operating Margin Performance
Strong margins are part of the
BorgWarner culture
>11.0%
• Sales growth and proactive cost
Double-digit margin management sustain margin profile
even with revenue mix shift
10.3% • R&D for rapidly growing EV portfolio
is overhang in medium term until
corresponding revenue materializes
− Maintaining ROIC discipline on EV
programs expected to deliver
comparable, long-term margin profile
9.0%
2021 2023 2030
Source: BorgWarner estimate at the midpoint of FY21 guidance and estimated FY23 outlook
22Significant Capital 2021-2025 Estimated Capital Flows
Available to Accelerate >$7B
Positioning in EV ~$1.5B
Dispositions1
~$5.5B
• Strong cash flow and investment- >$1.0B Available
grade balance sheet support M&A Available Leverage2
for M&A
• Dispositions provide additional
source of capital
~$4.5B
• Discipline of returning capital to Free Cash Flow
shareholders remains intact $0.8B
Share Repurchases
– Dividends sustainable through downturns $0.8B
Dividends
– Share repurchase timing subject to M&A
execution Sources of Capital Uses of Capital
1 Est.
disposition proceeds net of loss of FCF through 2025 associated with dispositions
2 Est.
incremental debt that could be issued while maintaining 1.8x gross-debt-to-EBITDA ratio
$5.0B+
BorgWarner estimate
23• We have both the strategies
and execution capabilities to
lead the industry
• Sustainability is core with a
commitment to carbon
neutrality by 2035
• Our actions through 2025 are
expected to achieve ~45% of
revenue from EV by 2030, with
potential for more to come
24Appendix
25Acquisition of Leading Battery Systems Provider
BorgWarner’s acquisition of AKASOL will strengthen its electric propulsion systems leadership
• Battery Systems is a key element of BorgWarner’s e-growth strategy
• AKASOL is a leader in high-performance battery system solutions for electric vehicles
• AKASOL has highly flexible battery technology across multiple cell architectures
• AKASOL has proven technologies and products with established manufacturing facilities already
in serial production today
• AKASOL has a strong order backlog of approximately $2.4B1 primarily from leading OEMs
• AKASOL products serve CV and Off-highway applications, which aligns with BorgWarner’s goal
to increase its electrification portfolio across both LV and CV markets
1. Backlog based on latest AKASOL public disclosure of €2.0B as of Q2 2020 using $1.20 USD to Euro exchange rate.
26Global Footprint with Production-Ready Capacity
State-of-the-art manufacturing facilities
Langen Darmstadt Hazel Park
Completed capacity expansion New HQ with 1 GWh of New US facility to support
to support future growth installed capacity North American customers
1.0 GWH 4.7 GWH
2020 2022
Production Output Production Output
27Flexible Battery Technology Across Cell Types
Integrated battery solutions for any kind of commercial vehicle
Cell Architectures
Pouch Cell / POC Prismatic Cell / PRC Cylindrical Cell / CYC
Cell System
Highly selective process allows AKASOL
to use only the top-tier quality cells Reliable and robust system design with
various industry compliances
Module
Highly functional and scalable module
design with liquid cooling Smart BMS
AKASOL’s BMS offers a complete
Accessories solution for monitoring and controlling
Development and supply of various complex battery systems
accessories
28Technology Leading Position in Energy Density
Ultra-High-Energy System in Gravimetric and Volumetric Energy Density
Gen X
(in development)
Gravimetric energy density (Wh/kg)
Gen 3 (Format Agnostic)
(SOP: Q4 2021)
Competitor #2
Competitor #4
Competitor #3
Competitor #2 Competitor #4
Competitor #3
Competitor #1 Gen 1 & 2 Track-records
Competitor #2 6,800 Produced 544,000,000 Km
Gen 2 Serial Systems Electric Range Sold
(SOP: 2020)
Latest model Previous models Volumetric energy density (Wh/l)
Note(s): Company information as of November 2020. Gravimetric represents amount of energy stored in given mass. Volumetric represents
amount of energy stored in given volume.
29Adjusted Operating Income and Margin
Reconciliation to US GAAP
The Company defines adjusted operating income as operating income adjusted to eliminate the impact of restructuring expense, merger, acquisition and divestiture expense, other net expenses, discontinued
operations, and other gains and losses not reflective of the Company’s ongoing operations. The company defines adjusted operating margin as adjusted operating income divided by net sales
1
Year Ended December 31, Full Year 2021 Guidance Full Year 2023 Estimate
$ in millions 2016 2017 2018 2019 2020 Low High Low High
Sales $9,071 $9,799 $10,530 $10,168 $10,165 $14,700 $15,300 $15,500 $17,500
Operating income $973 $1,072 $1,190 $1,303 $618 $1,260 $1,450 >$1,605 >$1,825
Operating margin % 10.7% 10.9% 11.3% 12.8% 6.1% 8.6% 9.5% >10.4% >10.4%
Non-comparable items:
Restructuring expense 27 59 67 72 203 200 150 100 100
Merger, acquisition and divestiture expense 24 10 6 11 96 10 10 - -
Intangible asset accelerated amortization - - - - 38 - - - -
Amortization of inventory step-up - - - - 27 - - - -
Asset impairment and loss on divestiture 127 71 25 7 17 - - - -
Net gain on insurance recovery for property damage - - - - (9) - - - -
Unfavorable arbitration loss - - - 14 - - - - -
Officer stock awards modification - - 8 2 - - - - -
Asbestos related charge (49) - 23 - - - - - -
Gain on sale of building - - (19) - - - - -
Gain on derecognition of subsidiary - - - (177) - - - - -
Other 12 7 (4) - - - - - -
Adjusted operating income $1,114 $1,219 $1,296 $1,232 $990 $1,470 $1,610 >$1,705 >$1,925
Adjusted operating margin 12.3% 12.4% 12.3% 12.1% 9.7% 10.0% 10.5% >11.0% >11.0%
1
Significant variability in low and high sales expectations relates to potential variability in acquisitions and dispositionsFree Cash Flow Reconciliation to US GAAP
The Company defines free cash flow as net cash provided by operating activities minus capital expenditures, including tooling outlays. The measure is useful to both management and investors in evaluating the
Company’s ability to service and repay its debt.
Total Years
Year Ended Ended
December 31, Year Ended December 31, December 31,
1
$ in millions 2016 2017 2018 2019 2020 2021 2025 Est. 2021-2025 Est.
Net cash provided by operating activities $1,036 $1,180 $1,126 $1,008 $1,184 $1,525 >$2,000 $8,800
Derecognition of subsidiary - - - 172 - - - -
Capital expenditures, including tooling outlays (501) (560) (546) (481) (441) (675) (1,000) (4,300)
Free cash flow $535 $620 $580 $699 $743 $850 >$1,000 $4,500
1
Estimate at the midpoint of FY21 guidance
Source: BorgWarner estimate excluding the impact of any new acquisitions and dispositionsROIC Reconciliation to US GAAP
Year Ended December 31, Guidance1
$ in millions 2017 2018 2019 2020 2021
A. Adj. operating income $1,222 $1,350 $1,232 $990 ~$1,540
B. Adjustment to align operating earnings to the performance target's foreign exchange basis - - 17 - -
C. Less taxes ((A. plus B.) times tax rate) 391 391 325 317 ~490
D. After-tax net adj. operating earnings (A. plus B. minus C.) 831 958 924 673 ~1,050
E. Short-term and long-term debt 2,188 2,113 1,960 2,908 3,787
F. Stockholders' equity 4,208 4,345 4,844 5,317 6,723
G. Adjustment to align stockholders' equity to the performance target's foreign exchange basis - - 55 - -
H. Cash 731 739 832 1,669 1,650
I. Capital invested (E. plus F. plus G. minus H.) 5,665 5,719 6,027 6,556 8,860
J. Return on invested capital (D. divided by I.) 14.7% 16.8% 15.3% 10.3% ~12%
2017 to 2019 derived from proxy statements; 2020 calculated from FY financials using average of quarter ends for capital balances
1
Estimate at the midpoint of FY21 guidance for adj. operating income; year-end 2020 figures utilized for 2021 capital invested balancesYou can also read