Investor Presentation - Q4-FY2021 - Dollarama
←
→
Page content transcription
If your browser does not render page correctly, please read the page content below

Investor
Presentation
Q4-FY2021
Cautionary statement
This presentation does not constitute an offer to buy or sell or a solicitation of an offer to buy or sell any securities of Dollarama Inc. and does not constitute or
form part of, and under no circumstances is to be construed as, an offering document, such as an offering memorandum, or an advertisement for an offer to buy
or sell any securities of Dollarama Inc.

Forward-Looking Information
This presentation contains forward-looking information about results, levels of activity, performance, goals or achievements of Dollarama and Dollarcity or other
future events or developments that may affect Dollarama and Dollarcity which are based on information currently available to management and estimates and
assumptions that management believes are appropriate and reasonable in the circumstances. However, there can be no assurance that such estimates and
assumptions will prove to be correct. Many factors could cause actual results, levels of activity, performance, goals or achievements or other future events or
developments to differ materially from those expressed or implied by the forward-looking information contained herein including, without limitation, the risk
factors described in Dollarama’s Annual Management Discussion and Analysis (MD&A) dated March 31, 2021 filed with Canadian securities regulators and
available on SEDAR at www.sedar.com. The forward-looking information contained in this presentation represents management’s expectations as at March 31,
2021, and, accordingly, is subject to change after such date. Except as may be required by law, management has no intention and undertakes no obligation to
update or revise any forward-looking information.

COVID-19
On March 11, 2020, the World Health Organization declared the rapidly spreading coronavirus disease (COVID-19) outbreak a pandemic. Subsequently, all of
the jurisdictions in which Dollarama operates imposed strict measures in an attempt to slow down the transmission of the virus in its first wave in the spring of
2020 and then again starting in December 2020 as Canada experienced a resurgence in COVID-19 infections brought on by a second wave and as fears of
new variants of the disease being more transmissible grew. These measures included travel restrictions, self-isolation measures, temporary closures of non-
essential services and businesses, temporary bans on the sale of non-essential items, curfews, in-store capacity limits and other physical distancing
requirements. Similar measures have been taken in the countries of operation of Dollarcity. Dollarama has been recognized as an essential business in
Canada, and Dollarcity received the same recognition in El Salvador, Guatemala and Colombia.
•
From the outset of the COVID-19 outbreak, Dollarama implemented mitigation strategies, contingency plans and several preventative measures to protect the
health and safety of its employees and customers. Also, Dollarama is continuously monitoring the impact of the pandemic on its local and global supply chains
and its operations in Canada and Latin America. Measures adopted by Dollarama in response to COVID-19 as well as measures implemented by different
levels of governments, which continue to evolve to this date, and their impact on operations, operating costs, customer traffic and labour productivity and
availability could materially adversely affect financial results.
•
It remains difficult to reliably estimate the duration, severity and extent of public health and economic impacts of the COVID-19 pandemic on the operations and
financial results of Dollarama, both in the short term and in the long term. Another resurgence of COVID-19 infections across Canada could force governments
to reverse reopening plans.

                                                                                                                                                               2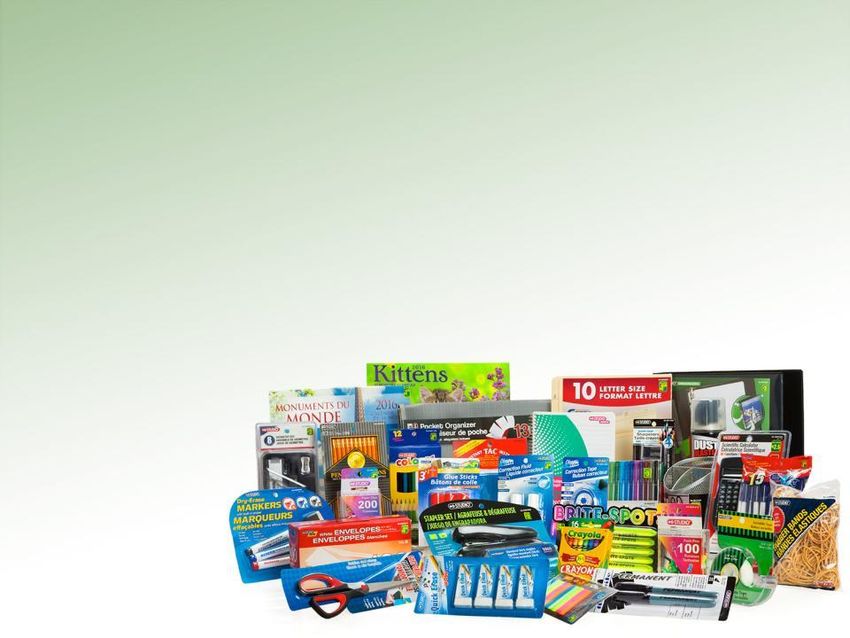
Cautionary statement
Presentation of Financial Information
All amounts are expressed in Canadian dollars, unless otherwise indicated. Certain values used in this presentation are for illustration purposes only and
are based on various factors that may or may not materialize, including past performance metrics that may not be indicative of future performance.

Credit Ratings
A rating is not a recommendation to buy, sell or hold investments, and may be subject to revision or withdrawal at any time by the relevant rating agency.

Market and Industry Data
This presentation contains market and industry data sourced from a combination of internal company surveys, third party information, including third party
websites, and estimates of management. While those sources are believed to be reliable, they have not been independently verified, and management
has no assurance that the information contained in third party websites is current and up-to-date. While management is not aware of any misstatements
regarding the market and industry data presented herein, such data involves risks and uncertainties and is subject to change based on various factors.
Unless otherwise indicated, the data contained in this presentation is stated as at March 31, 2021.

Non-GAAP Measures
This presentation refers to certain non-GAAP measures. These measures do not have a standardized meaning prescribed by GAAP and are therefore
unlikely to be comparable to similar measures presented by other issuers. Consequently, they should not be considered in isolation or as a substitute for
financial performance measures calculated in accordance with GAAP. Refer to the section entitled “Selected Consolidated Financial Information” of
Dollarama’s MD&A dated March 31, 2021 for a reconciliation of those non-GAAP measures to the most directly comparable GAAP measures.

                                                                                                                                                         3
Dollarama
Overview

Dollarama through the years

                        Initial public              Introduction
                        offering                    of $2.50 and                                                  Recognition    New long-term
                        (TSX: DOL)                  $3.00 price                                                   as essential   store target
Dollarama                                           points                   Opening of Introduction Launch of business          of 2,000
founded as single-      585 Dollarama                                        1000th     of $3.50 and online store amid           across
price point retail      stores in                   Launch of                Dollarama $4.00 price for bulk       COVID-19       Canada by
chain                   ten provinces               first NCIB               store      points       sales        pandemic       2031

      1992           2004       2009           2011        2012          2013       2015       2016        2019          2020         2021

        Investment by Introduction Sale by Bain                  Beginning of          Neil Rossy    Acquisition of
        Bain Capital  of multi-    Capital of                    partnership           appointed     50.1% of
                      price point remaining equity               with Latin            President     Dollarcity
                      strategy     stake                         American              and CEO                    2017
                                                                 value retailer                      Target of 600
                                         Declaration of          Dollarcity                          Dollarcity stores
                                         first dividend                                              by 2029

                                                                                                                                       5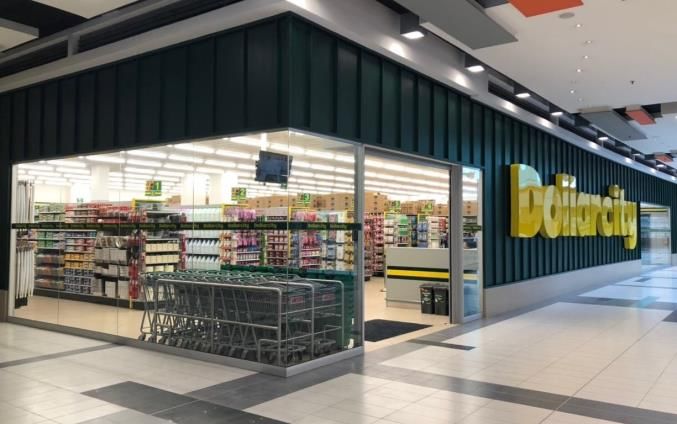
Dollarama today

•     Largest and only national dollar store chain in Canada
      • 1,356 corporate-operated stores
      • Avg. of 10,325 sq. ft. per store
      • Avg. store annual sales of $3.0 million

•     Strong value proposition at select fixed
      price points up to $4
      • Broad assortment of everyday goods
      • ~50% of merchandise sourced directly
      • ~75% of sales from products priced above $1.25

•     Robust financial performance(1)
      • LTM sales: $4.03B
      • LTM(2) EBITDA: $1,131M (28.1% of sales)
(1) For the last twelve months ended January 31, 2021
(2) Inclusive of direct costs related to COVID-19 measures implemented from the outset of the pandemic through to the
    end of the fourth quarter ended January 31, 2021 (approximately $84.0 million)                                      6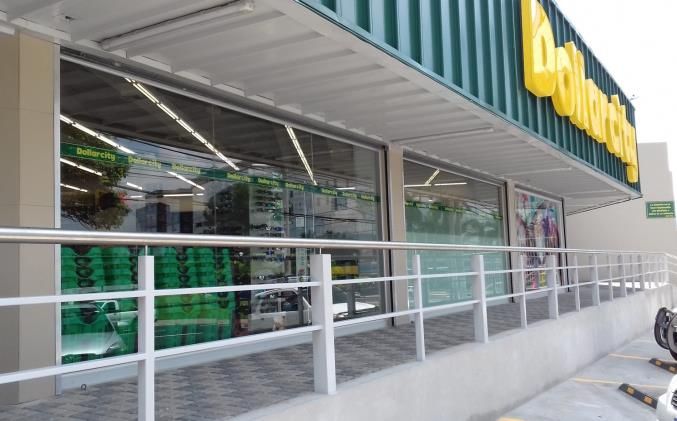
A simple, growth-oriented
business model

      We build          We focus        We solidify
     on our growing     on delivering      our brand
      store network      compelling     reputation and
         and our        value to our    deliver superior
     low-cost direct     customers          financial
    sourcing platform                        results

                 Backed by seasoned team
                 and disciplined execution
                                                           7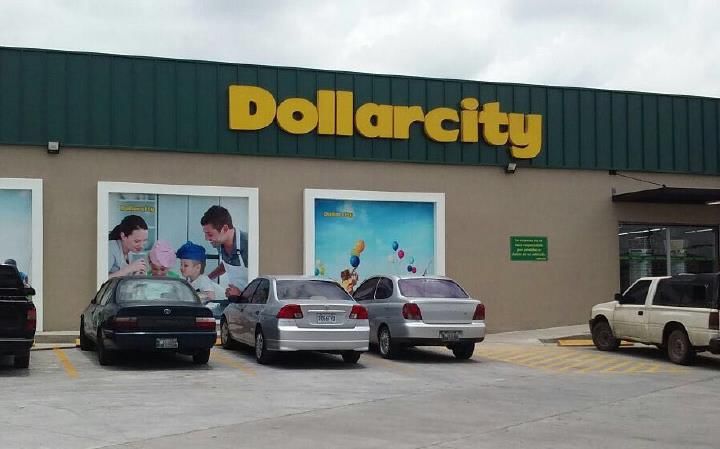
Competitive
Advantages
Direct sourcing expertise

• Longstanding relationships with low-cost
  supplier network:
  • Overseas direct sourcing program initiated in 1992
  • Well-diversified base of established suppliers
  • ~50% merchandise sourced directly from
    over 25 countries (primarily China)

• Benefits of direct sourcing:
  • Creates different, more
    compelling product selection
  • Reduces costs associated
    with intermediaries
  • Increases bargaining power with suppliers
  • Provides cost flexibility to help control inflation
    and currency fluctuations
                                                          9
Large network with over 1,350
stores across Canada

Only dollar store chain
with a significant presence in
all ten provinces                111
                                        134
                                                   40 41                           379
                                                                      539                      112

  ~2.6x more stores                    12911356
  than 4 largest pure              1225
                                                              3-yr Store Count
  play competitors                                              Dollarama vs.
  combined                                              Next 4 Pure Play Competitors

  ~5.9x larger than
  next largest pure play
                                                   228 229 231
  competitor                                                      114 117 117    116 124 118
                                                                                               50 47 48

                                       Dollarama   Dollar Tree    Dollar Store     Great        Buck or
                                                     Canada        with More      Canadian       Two      10
                                   Source: company reports and websites
Compelling product
offering
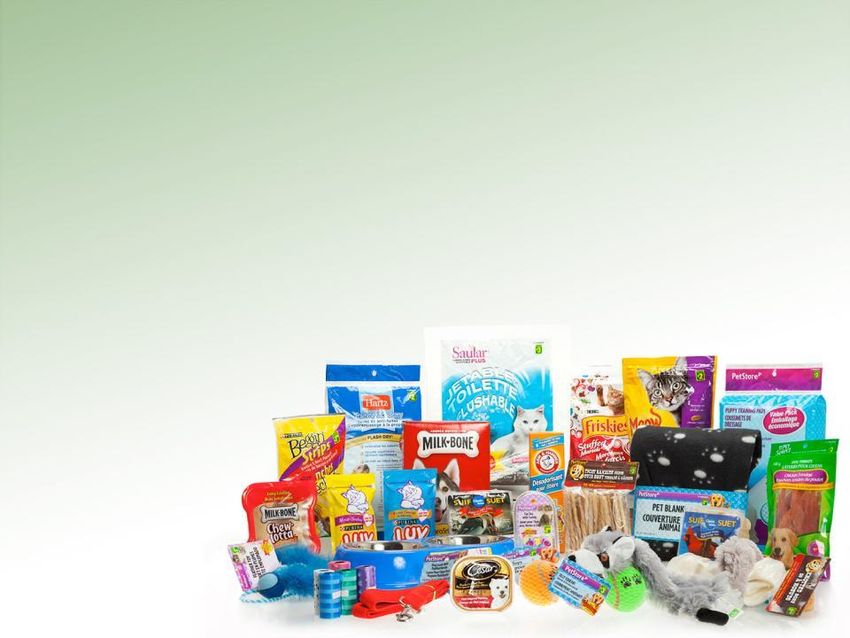
• Broad assortment of products
across 20+ departments at
compelling value
• Mix of store brands and General
Merchandise Consumables
name brands 43% 41%
Seasonal
• Multiple fixed price points 16%
11Offering convenience
and value
• Strong brand recognition and reputation
for delivering value
•
Unrivaled presence across Canada in
convenient locations
• Destination store appealing
to broad customer base
• Consistent in-store shopping experience
• Recognition as essential business amid
COVID-19 pandemic
12Growth Strategies
Strategies for driving growth
 and creating value

• Grow store network in Canada
  in a disciplined manner
  • New long-term target of 2,000
    Dollarama stores by 2031
  • Leverage strengths to stimulate sales
  • Maintain low-cost operating model

• Develop second growth
• platform in Latin America
  • Acquisition of 50.1% interest in
    Dollarcity in Q3-FY2020
  • Target of 600 Dollarcity stores
    by 2029 in the initial 3 countries
  • Enter the Peruvian market in 2021
Significant potential for
additional growth in Canada
Thousands of People per
Dollarama Store
Average of 70 net new 37
stores per year over last 27
23 22
10 fiscal years
Eastern Canadian market
not saturated
Western Ontario Quebec Atlantic
Dollarama underpenetrated Provinces
in Ontario and Western Canada Source: Statistics Canada; Q4-FY21 store count
Thousands of People per Dollar
Store (5 chains combined)
Canadian market 20
underpenetrated relative
10
to US dollar store segment
(subject to notable differences in business models)
Canada US
Canada: Dollarama, Buck or Two, Dollar Store with More, Dollar
Tree Canada, Great Canadian
US: Dollar General, Dollar Tree, Family Dollar, Fred’s, 99c only 15
Source: Census data and company websitesDisciplined approach to growth
• Efficient capital model
• $650K in leasehold improvements,
fixtures and inventory for new Dollarama store
• Quick sales ramp-up
• Average sales ramp-up to $2.3M within 2 years
• Rapid payback of approximately 2 years
• Low maintenance capex
Strong profitability,
low capital intensity
and high ROI
16Leverage strengths
to stimulate Dollarama sales
• Effective and flexible Industry leading
merchandising
• Refresh 25-30% of
same-store sales
merchandise every year
12-year 12-year 12-year
• Zonogram by department (vs. 4500
Store CAGR Sales CAGR SSS Average
11.0%
fixed planogram) 4000
7.6% 11.5% 5.4% 10.0%
• No loss leaders 3500 9.0%
(in millions of dollars)
3000 8.0%
• Multiple fixed price points 2500 7.0%
• Introduction of new price
2000 6.0%
points in 2009, 2012 & 2016
• $3.50 & $4.00 price points 1500 5.0%
introduced on August 1st, 1000 4.0%
2016 (first day of Q3- 500 3.0%
FY2017) 0 2.0%
FY09 FY10 FY11 FY12 FY13 FY14 FY15 FY16 FY17 FY18 FY19 FY20 FY21
17Maintain low-cost
operating model
• Continuous in-store • Efficient supply chain
productivity improvements • DC, warehouse and
• POS systems transportation logistics
• Kronos advanced scheduling
• NCR point of sale terminals • Lean overhead
• WIFI and mobile-driven • operations
projects
• LED retrofits
• Security cameras
• Self-checkouts
18Dollarcity transaction
overview
Acquisition of 50.1% interest in Dollarcity
▪ Final purchase price of US$92.7M1; upfront payment of US$40M in
Q3-FY20, balance of US$52.7M paid in Q3-FY21
▪ Immediately accretive to DOL EPS (+CA$0.03 per share in F20202)
▪ Investment reported based on equity method
A compelling growth platform
▪ Creates compelling second growth platform, in complement to
Canadian growth strategy
▪ Proven business model with 7 years of success creating a
‘localized’ DOL
▪ Strong local partners committed as long-term operators
(1) Equity value calculated as 50.1% of 5x EBITDA for the 12 months ended June 30, 2020, minus net debt +/- other
customary adjustments.
(2) FY2020 EPS includes 50.1% of approximately 4,5 months of Dollarcity’s net earnings.
19Dollarcity’s growth trajectory
▪ ‘Localized’ Dollarama concept initially
tested and established in El Salvador Target of
and Guatemala 600
Dollarcity
▪ Since 2017, network expansion has stores(2)
been mainly focused on Colombia, a Guatemala
compelling retail market with significant ▪ 67 Dollarcity stores(1)
growth opportunities ▪ Local warehouse
▪ Entry into Peru planned for 2021 El Salvador
▪ 52 Dollarcity stores(1)
▪ Administrative office
▪ Recognition as essential business in all in San Salvador
3 countries amid COVID-19 pandemic ▪ International warehouse
▪ Local warehouse
Target of 600 Dollarcity stores in Panama
Colombia, Guatemala and El Salvador ▪ Head office in
by 2029 Panama City
• Majority of store network growth will be Peru
Colombia
focused in Colombia
▪ 145 Dollarcity stores(1) ▪ Entry planned
• Does not include Peru for 2021
▪ Local warehouse
• 264 stores as at Dec. 31, 2020
(1) As at Dollarcity’s latest quarter ended Dec. 31, 2020.
(2) In Colombia, Guatemala and El Salvador by 2029; 20
does not include Peru.Dollarama Financial Metrics
Robust financial performance
                                            FOURTH QUARTER ENDED                             Y-O-Y                   FISCAL YEAR ENDED              Y-O-Y
(in millions of dollars, except per
share amounts)                         JAN. 31, 2021(1)            FEB. 2, 2020            GROWTH            JAN. 31, 2021(2)    FEB. 2, 2020(3)   GROWTH

                                                     % OF                      % OF                                       % OF            % OF
Sales                                  $1,104       SALES
                                                                  $1,065      SALES
                                                                                             3.6%            $4,026      SALES
                                                                                                                                 $3,787 SALES       6.3%

Gross Margin                            $502       45.5%           $476       44.7%          5.5%            $1,765      43.8%   $1,652   43.6%     6.8%

SG&A                                    $186       16.9%           $156       14.6%         19.5%             $654       16.2%    $552    14.6%    18.5%

Equity Pick-Up (Dollarcity)              $11        1.0%            $9         0.8%         22.9%              $20       0.5%     $10     0.3%     91.5%

EBITDA                                  $327       29.6%           $329       30.9%         (0.7%)           $1,131      28.1%   $1,111   29.3%     1.8%

Operating Income                        $256       23.2%           $266       25.0%         (3.8%)            $861       21.4%    $868    22.9%    (0.8%)

Net Earnings                            $174       15.8%           $179       16.8%         (2.7%)            $564       14.0%    $564    14.9%     0.1%

                                                   16.3%                                                                 14.5%
EPS                                     $0.56                     $0.57                     (1.8%)            $1.81              $1.78              1.7%

Adj. Net Debt / LTM
                                        2.68x                     2.97x                                       2.68x              2.97x
EBITDA(4)

    (1)   ~ $23.8M of direct costs were incurred in Q4-FY21 in connection with COVID-19 (all included in SG&A)
    (2)   ~ $84.0M of direct costs were incurred in FY21 in connection with COVID-19 (~ $81.1M included in SG&A)                                            22
    (3)   Only includes ~ 4.5 months of equity pick-up for Dollarcity as the acquisition was closed on August 15, 2019
    (4)   (Total net debt + total lease liabilities) / LTM EBITDA
Balanced approach to operating
margin
LTM EBIT Margin (%)
21.4
9.9 10.5
8.3 7.8
6.9 7.4
4.8 4.6
DOL Canadian Tire Couche-Tard North West Metro Loblaw Empire Dollar Dollar
General Tree
Canadian retailers with product offering US dollar
overlap with Dollarama stores
Source: Company websites; Walmart Canada figures not available
23Strong organic growth with low
capital requirements
10%
8%
Last Three Fiscal Years Store Count CAGR
6%
4%
2%
0%
30% 40% 50% 60% 70% 80% 90%
Cash Flow After Capex(1)
Source: Company websites; Walmart Canada figures not available
(1) (EBITDA – CAPEX) / EBITDA 24Strong key metrics growth
since IPO
4,500 IFRS 16
$4,026
4,000
$3,787
IAS 17 $3,549
3,500
$3,266
$2,963
3,000
$2,650
2,500 $2,331
$2,065
2,000 $1,859
$1,603
1,500 $1,420 1,356
1,225 1,291
1,095 1,160 $1,079 $1,111 $1,131
1,030
955
1,000 874 $826
785 $703
652 704
$597 $564 $564
$519 $545
$355 $402 $461 $446
500 $295 $385
$234 $173 $221 $250 $295
$117
-
FY11 FY12 FY13 FY14 FY15 FY16 FY17 FY18 FY19 FY20 FY21
FY21 EBITDA & Net Earnings reflect incremental direct costs related to COVID-19 ( ~$84.0M on a pre-tax basis) 25Continuous margin improvement
since IPO
Variable cost structure allows for scaling benefits with top line growth
60.0%
IFRS 16
IAS 17
50.0%
44.6% 43.8%
43.6%
39.0% 39.2% 39.8%
40.0% 37.5% 37.4% 37.1% 36.9%
36.1%
30.4%
29.3%
30.0% 28.1%
25.3%
23.7% 23.8%
22.5% 23.1%
21.8% 22.9%
19.6% 19.0% 19.5% 19.8% 20.7% 21.4%
18.4% 19.1% 18.3%
20.0% 16.5% 17.3% 18.1%
17.2% 17.6%
16.3% 17.1%
16.4% 16.2%
14.5% 15.5%
14.5% 14.2% 14.6%
10.0%
0.0%
FY11 FY12 FY13 FY14 FY15 FY16 FY17 FY18 FY19 FY20 FY21
FY21 metrics reflect incremental direct costs related to COVID-19 ( ~$2.9M in Gross Margin, ~$81.1M in SG&A, ~$84.0M in EBITDA and EBIT) 26Debt structure as at Q4-FY2021
▪ 84% fixed rate debt, 16% floating rate debt
▪ $939M available liquidity ($139M cash + $800M undrawn and available credit facility) (1,2)
▪ ~2.3% weighted average cost of debt
▪ ~2.2 years weighted average time to maturity
5-Year Fixed
$600 2.337%
5-Year Fixed
3.550%
$525M $500M
$500
$400 3-Year FRN 7-Year Fixed
BA + 27 bps 1.505%
$300M 5.5-Year Fixed $300M
2.203%
$300 $250M
$200
$100
$0
Feb’21 Jul’21 Nov’22 Nov’23 Sept’27
(1) Excludes letters of credit (approximately $1.1M)
(2) Does not include an amount of $300M that was utilized on February 1 st for the repayment of the February 2021 FRN
following the issuance in September 2020 of the $300M 1.505% September 2027 bond. 27U.S. Commercial Paper Program
Issuer: Dollarama Inc. - Bloomberg Ticker ("DOL") We intend to shift a portion of
borrowings to commercial paper
Dollarama L.P. and Dollarama GP Inc., both
Guarantors:
wholly-owned subsidiaries of the Issuer
and utilize the revolving credit
facility as a backstop to the
Securities: Commercial Paper Notes commercial paper program
Program Ratings: S&P: A-2 / Moody's: P-2
Long-Term Ratings: S&P: BBB / Moody's: Baa2 / DBRS: BBB Credit Facilities
• CDN $800 million committed
Program Size: Up to US $500 million
• Syndicate of six Canadian
Maturities: Overnight to 397 days (target 1 week to 90 days) and two international financial
institutions
• Same day draw capabilities
up to U.S. $300 million
• Ability to draw in both
Canadian and U.S. dollars
• Different maturity dates
including a tranche maturing
on September 29, 2024
(extended annually)
28Total shareholder return
Performance Graph Since January 31, 2011
1350
1250
1150
Dollarama
1050
(Total Cumulative Return of a $100 investment)
TSX Capped Consumer Discretionary Index
950
850
750
650
550
450
350
250
150
50
31-Jan-11 31-Jan-12 31-Jan-13 31-Jan-14 31-Jan-15 31-Jan-16 31-Jan-17 31-Jan-18 31-Jan-19 31-Jan-20 31-Jan-21
29Disciplined execution
of our growth plan
Disciplined execution of our Canadian growth plan
▪ New long-term target of 2,000 stores in Canada by 2031
▪ Maintain payback period of approximately 2 years
▪ Sustain attractive same-store sales growth
▪ Maintain balanced operating margins
Development of our LATAM growth platform
▪ Target of 600 stores in initial three countries by 2029
▪ Entry into Peru planned for 2021
▪ Continue implementation of various operational initiatives
▪
Create value for all stakeholders
▪ Comfort zone between 2.75x – 3.00x adjusted net debt to EBITDA allows for
significant return of capital to shareholders through share repurchases & dividends
30ESG
Dollarama’s ESG framework

PRIORITY AREAS

      OUR PEOPLE            OUR PRODUCTS            OUR SUPPLY CHAIN       OUR OPERATIONS

▪   Fair labour         ▪   Product safety      ▪   Product sourcing   ▪   Energy
    practices               and quality                                    management
                                                ▪   Human rights           and climate change
▪   Diversity and
    inclusion                                   ▪   Fair labour        ▪   Waste management
                                                    practices
                                                                       ▪   Data security
MATERIALITY AND GOVERNANCE                                                 and privacy
Dollarama’s ESG priority areas are based on
comprehensive enterprise risk and ESG materiality
assessments, and are managed within the company’s
enterprise risk management framework.

The 2021 ESG Report will be available in June

The 2019 ESG Report and other relevant documents are
available at: www.dollarama.com/en-CA/corp/corporate-
governance-and-responsibility
                                                                                            32
ESG priorities overview
KEY 2019-2020 ESG PRIORITIES
OUR PEOPLE OUR PRODUCTS
Promoting a dynamic and inclusive Providing customers with compelling
workforce value and a consistent shopping
experience
▪ Successfully recruit in support of expanding
store network ▪ Maintain a diverse supplier base and
ensure products meet our safety and quality
▪ Increase internal promotions from store specifications
level to field management
▪ Increase number and frequency of product
▪ Aim for zero workplace accidents testing on toys
▪ Maintain 25% representation of women ▪ Proactively communicate product recalls via
among independent board members Dollarama’s website
33ESG priorities overview
KEY 2019-2020 ESG PRIORITIES
OUR SUPPLY CHAIN OUR OPERATIONS
A three-pronged approach to vendor Minimizing the environmental footprint
compliance and engagement of our operations
▪ Maintain vendor adherence and ▪ Continue to measure Scope 1 and 2 GHG
compliance with Vendor Code of Conduct emissions
▪ Update Vendor Code of Conduct ▪ Increase use of LED lighting across
operations
▪ Roll-out Vendor Compliance Survey
▪ Increase reuse and recycling through
▪ Roll-out third-party Social Audit Program various initiatives (pallet recycling, baler
installation)
34Thank you
A seasoned board
and management team
BOARD OF DIRECTORS                                      OFFICERS

Stephen Gunn              Nicholas Nomicos              Neil Rossy
Chair of the Board        Managing Director             President & Chief Executive
Corporate Director        Nonantum Capital Partners     Officer

Joshua Bekenstein         Neil Rossy                    J.P. Towner
Managing Director         President & Chief Executive   Chief Financial Officer
Bain Capital Partners     Officer
                          Dollarama                     Johanne Choinière
Gregory David                                           Chief Operating Officer
Chief Executive Officer   Richard Roy, FCPA, FCA
GRI Capital               Corporate Director            Nicolas Hien
                                                        Chief Information Officer
Elisa D. Garcia           Huw Thomas, FCPA, FCA
Chief Legal Officer       Corporate Director            Geoffrey Robillard
Macy’s                                                  Senior Vice President
                                                        Import Division
Kristin W. Mugford
Senior Lecturer                                         Josée Kouri
Harvard Business                                        Senior Vice-President, Legal
School                                                  Affairs & Corporate Secretary

                                                                                        36
You can also read