Best Ideas, 2019 Hosted by: (EZPW) - Laughing Water Capital

Page created by Harold Tyler
 
CONTINUE READING
Best Ideas, 2019 Hosted by: (EZPW) - Laughing Water Capital
Best Ideas, 2019
      Hosted by:

              (EZPW)
Best Ideas, 2019 Hosted by: (EZPW) - Laughing Water Capital
DISCLAIMER
    THIS PRESENTATION IS FOR INFORMATIONAL AND EDUCATIONAL
PURPOSES AT THE BEST IDEAS 2019 MOI CONFERENCE ONLY AND SHOULD
             NOT BE CONSIDERED INVESTMENT ADVICE.

      WE MAKE NO REPRESENTATION OR WARRANTIES AS TO THE
  ACCURACY, COMPLETENESS OR TIMELINESS OF THE INFORMATION,
 TEXT, GRAPHICS OR OTHER ITEMS CONTAINED IN THIS PRESENTATION.
 WE EXPRESSLY DISCLAIM ALL LIABILITY FOR ERRORS OR OMISSIONS IN,
    OR THE MISUSE OR MISINTERPRETATION OF, ANY INFORMATION
                CONTAINED IN THIS PRESENTATION.
Best Ideas, 2019 Hosted by: (EZPW) - Laughing Water Capital
About Laughing Water Capital

• Private partnership formed in 2016
• Concentrated value strategy: typically own 10-20 stocks
• Common sense approach to investing: seek out good businesses that are dealing with
  structural and/or operational problems that are likely easily solved by an incentivized
  management team given enough time
• Patience is essential: typically invest with a 3-5 year view
   • Volatility is not risk

                                            About Matt Sweeney
    • 17 years in sales, trading, banking and research roles on the buy and sell side
         • Sales experience covering hedge funds and mutual funds focused on small/mid cap names
         • Learned what not to do: focus on short term, trade frequently, over-diversify
    • Additional experience in change management consulting
         • Learned the importance of people and culture, and that turn arounds often don’t turn
    • Almost my entire net worth is invested in the strategy
    • Former Vice Chair, New York Society of Security Analysts (NYSSA) Value Investing Committee
    • Chartered Financial Analyst
Best Ideas, 2019 Hosted by: (EZPW) - Laughing Water Capital
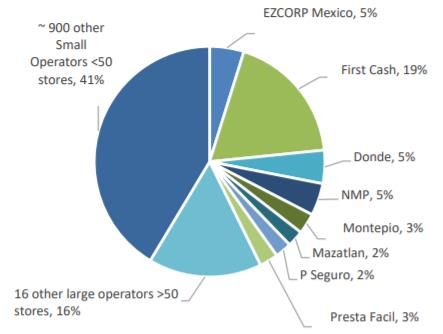
LWC’s 5 Part Framework

                    Is it a Good
                     Business?

 What Happens                                 Are
When Something
 Goes Wrong?
                                        Management’s
                                      Interest’s Aligned?
                                                            What is it worth?

                   Why Does the
                 Opportunity Exist?
Best Ideas, 2019 Hosted by: (EZPW) - Laughing Water Capital
(EZPW)
Elevator Pitch
EZPW is a recession proof, cash                                              Valuation Summary
flowing, growing business that is
trading at multiples not seen since the   Downside Cases                                             Target Price % Upside
2008 recession and a 50+% discount to     Estimated Net Asset Value                                    $11.13       44%
peers. The rolling off of 1 time items    Financial Crisis EBITDA Multiple                              $7.61       -2%
and FY contribution from recent
acquisitions will drive near term         Upside Cases                                               Target Price % Upside
upside, while a long runway for           "Normal" 2018 adj. EBITDA, No Multiple Expansion              $9.16       18%
profitable growth and an increasing       "Normal" 2018 adj. EBITDA, 15 Year Comp Discount             $14.32       85%
focus on ROIC and improvements to         "Normal" 2018 adj. EBITDA, Pre Acquisition Comp Discount     $16.14      109%
corporate governance lay the               2020: Acquisitions and Operational Improvement              $19.20      148%
foundation for multi-year success.         2021: Acquisitions and Operational Improvement              $20.70      168%

       Profitable, growing, recession proof stocks should not trade at a discount to NAV.

                                                                                                                             1
Investment Basics
✓ Easy To Understand
✓ Recession Proof Industry
✓ Strong FCF Generation
✓ Limited Sell Side Coverage
✓ Long runway for growth
✓ Operational improvements underway
✓ Governance improvements underway
✓ One time items
✓ Hidden Assets
✓ Large Margin of Safety

                                      2
                                      1
Stock Basics
                                                                                                      $16
  Stock Symbol                                                         EZPW
                                                                                                      $14
  Stock Price*                                                       $7.73
                                                                                                      $12
  Shares Out (mm)*                                                    54,585
                                                                                                      $10
  Market Cap (mm)                                                    $421.9
  Cash (mm)                                                          $286,015                          $8

  Debt (mm)*                                                         $316.4                            $6

  Enterprise Value (mm)*                                             $575.3                            $4

  % Owned By Insiders                                                10.6%                             $2

  Current Yield                                                      N/A
                                                                                                       $0

                                                                                                            1/3/2017
                                                                                                                       2/3/2017
                                                                                                                                  3/3/2017
                                                                                                                                             4/3/2017
                                                                                                                                                        5/3/2017
                                                                                                                                                                   6/3/2017
                                                                                                                                                                              7/3/2017
                                                                                                                                                                                         8/3/2017
                                                                                                                                                                                                    9/3/2017
                                                                                                                                                                                                               10/3/2017
                                                                                                                                                                                                                           11/3/2017
                                                                                                                                                                                                                                       12/3/2017
                                                                                                                                                                                                                                                   1/3/2018
                                                                                                                                                                                                                                                              2/3/2018
                                                                                                                                                                                                                                                                         3/3/2018
                                                                                                                                                                                                                                                                                    4/3/2018
                                                                                                                                                                                                                                                                                               5/3/2018
                                                                                                                                                                                                                                                                                                          6/3/2018
                                                                                                                                                                                                                                                                                                                     7/3/2018
                                                                                                                                                                                                                                                                                                                                8/3/2018
                                                                                                                                                                                                                                                                                                                                           9/3/2018
                                                                                                                                                                                                                                                                                                                                                      10/3/2018
                                                                                                                                                                                                                                                                                                                                                                  11/3/2018
                                                                                                                                                                                                                                                                                                                                                                              12/3/2018
  52 Week Range                                                      $7.45 - $15.10

*Share price as of 12/31/2018
*Shares out = A shares + B shares + RSUs
*Debt is convertible to equity at $10, $15.90, and $16.06, and is accounted for via treasury method                                                                                                                                                                                                                                                                                       3
*Includes investment in public securities, and financial receivable due
Company Basics
                                                                       FY’18 Revenue Mix

• 2nd largest publicly traded pawn                        Gross Revenue                         Net Revenue
  company                                                  7% 1%                               2%      2%

• IPO in 1991                                                                  38%     33%

• New management team brought in in
  2014 has cleaned up past mistakes,
  and established a pattern of                      54%
                                                                                                                    63%

  operational excellence
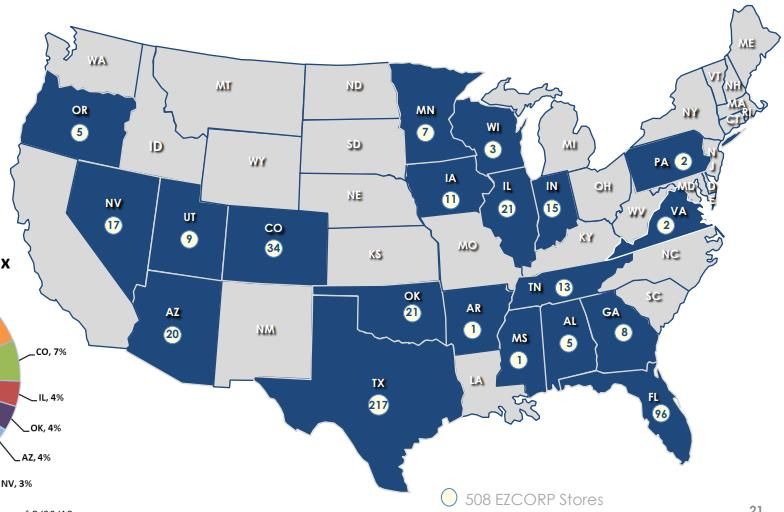
• U.S. business is a mature cash cow                                      Geographic Mix
• Latin America represents an exciting                                Stores             508                  454
  growth and margin opportunity                                Net Revenue $                 $379,330               $97,157

          • 84% store count growth in 2018                    Net Revenue %                    79.6%                20.4%

          • 22-44% store count growth expected in           Segment EBITDA $                 $115,965           $38,405

            2019                                           Segment EBITDA %                    75.1%                24.9%
                                                    Segment EBITDA NR Margin           30.6%                39.5%

                                                                                U.S.     LatAm                                4
Table source: 2018 10K
Is it a Good Business: Necessity => Longevity
                                  Meeting an Essential Need

• While it may seem like an unsavory business to the investing class, for the working
  poor pawn is an important part of managing cash needs
   • Close to 1 in 4 Americans are under-banked or unbanked
   • More than 3 in 5 Mexicans are unbanked
   • Close to 1 in 2 LatAm ex-Mexico are unbanked
• Secured lending: heads I win, tails I don’t lose
• Low capex: if a store is too nice, it may actually intimidate customers
   • Maintenance CapEx ~1% of gross revenue

                                          Longevity
• Pawn is likely the worlds second oldest business
    • How many businesses have existed virtually unchanged for ~3,000 years?
• While bears worry about regulatory risk, they fail to acknowledge that multiple
  Popes, absolute monarchs, the Prophet Mohammed, and others have tried and
  failed to regulate away the pawn industry                                             5
Industry Landscape
                                              U.S.            Mexico / Latin America

• Fragmented market                                  • Fragmented market
   • 10,000+ pawn stores                                • Mexico
   • FCFS and EZPW have ~1,600                             • 7,000+ stores
     stores                                                • 22 large operators with 50+
   • Next largest player has ~40                              stores
     stores                                             • Other LatAm
   • Wide range of quality                           • FCFS and EZPW have ~1,800 stores
• Barriers to entry for new stores                   • Significant opportunity to high-
• Primarily state level regulation                     grade stores toward general
                                                       merchandise
                                                     • Federal regulation

                                                                                           6
Note: estimates of store counts vary widely
Competitive Advantage
                                   Driving Pawn Loans Outstanding

                                             Technology
•   Data analytics
    • Using data to strike the right balance between maximizing LTV, and protecting gross margins
        in the event of forfeiture
    • Improve customer experience through higher LTVs, and speed of transaction
•   Ahead of FCFS for the time being, but expect that gap to close
•   Mom and pops will not be able to compete

                                                Scale
•   Balance sheet strength and bigger footprint allows for higher LTVs / more inventory risk
•   Not relevant vs. FCFS, very relevant vs. Mom and Pops

                                            Relationships
•   Stability of employee base drives transactions
•   Average district manager 8 years with EZ, 3 years in position
•   Average store manager 8 years, 4 in position
                                                                                                    7
Where Are We Now: Operational Excellence
Under previous management, EZPW got                                 Consolidated EBITDA Trends and Margin
away from its core competency of pawn                 $180,000                                                                               40.0%
                                                      $160,000
lending, leading to several poor                      $140,000
                                                                                                                                             35.0%
                                                                                                                                             30.0%
acquisitions, and subsequent writedowns               $120,000
                                                      $100,000
                                                                                                                                             25.0%
                                                                                                                                             20.0%
                                                       $80,000
                                                                                                                                             15.0%
                                                       $60,000
                                                       $40,000                                                                               10.0%

The business has since been streamlined,               $20,000
                                                            $0
                                                                                                                                             5.0%
                                                                                                                                             0.0%
and is once again executing at a very high                           2014        2015         2016    2017        2018       2019E   2020E
level as a pure play pawn company                                                       Adj. EBITDA          Margin (net revenue)

• Focus on growing pawn loans
  outstanding (PLO)
   • LatAm same store PLO growth:
       • 18 straight Qs of constant currency growth
   • U.S. same store PLO growth:
       • Growth in 11 out of last 12 quarters

                                                                                                                                                     8
                                                      Source: Sentieo, company presentation
Why Now: Macro
                                                                      Recession Proof?
Historically, pawn has exhibited counter-cyclical                                      Improving Metrics Through the Great Recession
trends, positioning the business well for any
macro problems                                                                                                    2007 2008 2009 2010 2011
                                                                               Revenue                            $372 $457 $597 $733 $853
                                                                                 growth                            -        22.9% 30.6% 22.7% 16.3%
With multiples near crisis era lows, and                                       EBITDA                                  65     87   114   157   192
operating metrics likely to improve, EZPW stock                                  margin                           17.6% 19.0% 19.1% 21.4% 22.6%
appears very well positioned                                                     growth                             -     34% 31%     38% 22%
                                                                               Diluted EPS                        $0.88 $1.21 $1.42 $1.96 $2.57
                                                                                 growth                                     37.5% 17.4% 38.0% 31.1%
  T12M EV/EBITDA Mult. Through the Great Recession                                       Same Store Sales Through the Great Recession
12.0x                                                                                                  2007 2008 2009 2010 2011
10.0x                                                                          Total Revenue            n/a +13% +5% +14% +10%
 8.0x                                                                          US Pawn Service Charges +10% +17% +9% +16% +12%
 6.0x

 4.0x

 2.0x

 0.0x

                                                                                                                                                      9
        T12M EV/EBITDA   Current T12M EV/EBITDA   LWC T12M EV/normal EBITDA    Source: Company Filings, Sentieo
Why Now: Organic EBITDA Growth Already Baked
  Calendar adjustments                                                     Full Year Acquisition Contribution
  • While EZPW now has 453 LatAm stores, we                    2018 LatAm Net Rev              $97,157 10K
    estimate a weighted average of ~390 stores                 Wtd. Avg. # of LatAm Stores         390 LWC estimate
    through FY’18                                              Net Revenue/ Wtd. Avg. Store       $249
                                                               FY19 Initial Store Count            453 Investor Day Presentation
  • The 210 stores added in 2018 have significant              Implied Net Revenue            $112,852
    room for revenue and margin expansion                      FY 18 LatAm EBITDA Margin         39.5% 10K
            •   12 de novos maturing                           Implied FY19 LatAm EBITDA       $44,609 no margin expansion
            •   Mix shift to general merchandise               2018 LatAm EBITDA                38,405
            •   Upgraded technology                            Implied Calendar Improvement     $6,204 no operational improvement
            •   Back office synergies                                 Expected Base Improvement to YoY EBITDA
  Rolling off of 1 time items                                  2018 EZPW adj. EBITDA          $100,500    Investor Day Presentation
                                                               + Hurricane Impact                6,900
  • 2017 Hurricanes in TX and FL were an                       + FY acq. Contribution            6,204
                                                                                                          Investor Day Presentation
                                                                                                          LWC estimate
    estimated $6.9M drag on 2018 EBITDA                        2019 EZPW Base adj. EBITDA     $113,604    no operational improvement
                                                               YoY increase                      13.0%
  If EZPW simply muddles along in 2019, adjusted
  EBITDA should improve by ~13%

                                                                                                                                       10
Source: Company filings, company presentation, LWC estimates
Why Now: Aggressive Acquisitions Likely
Mexico                                             Mexican Acquisition Opportunities
At their December investor day, management
indicated they expect to add 100-200 stores in
2019, while providing detail on the Mexican
market for the first time

                                                                                   Investor Day Presentation

Other LatAm                                                  Flight History
Examining the flight history of the company
plane circa the time of the May convertible bond
offering indicates management had been
travelling to destinations where they do not
currently have a meaningful presence,
suggesting a deal was close… yet no large deal
has materialized
                                                                                                               11
Why Now: Aggressive Acquisitions Likely
                                           Ability to Self Finance

                                                                                   Cost Per Store Matrix
With expected ROIC for acquisitions of 25%, we                                                        Cash Available Including 2019
                                                                            Current Cash Available
view acquisitions as an effective use of capital                                                              Generation
                                                                            $20M   $30M    $40M      $50M   $60M     $70M    $80M
                                                                      100   $200   $300    $400      $500   $600     $700    $800

                                                     # of Stores to
Combining current liquidity with expected near
                                                                      125   $160   $240    $320      $400   $480     $560    $640
term cash generation and cash receivables

                                                          Buy
indicates EZPW has substantial dry powder                             150   $133   $200    $267      $333   $400     $467    $533
                                                                      175   $114   $171    $229      $286   $343     $400    $457
                                                                      200   $100   $150    $200      $250   $300     $350    $400
EZPW should be able to finance acquisitions
without relying on capital markets transactions                              Cash Available For Acquisitions
                                                                                  Low      High
                                                    Current Cash Available     $20,000 $40,000 Investor day pres.
                                                    + 2018 OCF After PLO Growth 70,000 70,000 No   credit for FY
                                                                                                contribution from acq.

                                                    + 2019 Alpha Receivable     30,000 30,000 Q4 presentation
                                                    - CapEx (inc. growth)       30,000 35,000
                                                    2019 Cash Available        $90,000 $105,000
                                                                                                                                      12
ROIC = NOPAT / total cost of acquisition
Why Now: Operational Margin Improvement
                                               A Proven Formula for Growing PLO

Recent acquisitions in LatAm are significantly                                      Expected Improvement at New Stores
underearning vs. their potential                                                                                                       Monthly PLO        Avg. Net   Avg. Pre-
                                                                                                                                         Yield           Rev/Store   tax profit
                                                                Legacy MX Stores                                                         18%             $239.7        $82
Legacy stores saw same store PLO grow ~75%                      Acquired MX Stores                                                       12%             $137.7        $56
from 2015-2018 as the company improved                          Potential Operational Improvement                                       600 bps          $102.0        $26
operations                                                                                     EZPW LatAm: Margin Trends
- Change to store level incentives
                                                                 $120,000                                                                                               60.0%
- Mix shift to general merchandise / focus on PLO growth
                                                                 $100,000                                                                                               50.0%
- Right sizing store level operating expense
                                                                  $80,000                                                                                               40.0%

                                                                  $60,000                                                                                               30.0%
As store level costs are largely fixed, PLO
growth comes with significant operating                           $40,000                                                                                               20.0%

leverage                                                          $20,000                                                                                               10.0%

                                                                         $0                                                                                             0.0%
                                                                                      2014               2015               2016             2017            2018
We believe the trend will continue with                                        Net Revenue             Segment EBITDA                segment EBITDA margin      FCFS margin
recent acquisitions as EZPW improves
operations, and FCFS indicates additional
potential upside
                                                                                                                                                                                  13
                                                                 Source: Investor Day Presentation, company filings, LWC estimates
Why Now: Mix Related Margin Improvement
   Continued growth in higher margin LatAm will                                            45.0%
                                                                                                                    FY’18 Segment Margin
   drive up consolidated margins                                                           40.0%
                                                                                           35.0%
                                                                                           30.0%
                                                                                           25.0%
                                                                                           20.0%
                                                                                           15.0%                   U.S.                         LatAm
                                                                                           10.0%
                                                                                            5.0%
                                                                                            0.0%

                                                                            An Evolving Mix
   100%
    90%
    80%
    70%
    60%
    50%
    40%
    30%
    20%
    10%
     0%
               2003          2004        2005   2006   2007   2008   2009   2010    2011        2012   2013      2014     2015   2016   2017   2018   E2019   E2020
                                                                        Mexico / LatAm Stores      U.S. Stores
                                                                                                                                                                      14
Source: company filings, LWC estimates
Why Does the Opportunity Exist?
                                 Big Picture

Structural Factors                                   Sins of the Past

• Unsavory industry
• Controlling shareholder that                    Madison Park
  spent a few years taking
  advantage of related party
                                               Consulting Agreement
  transactions

                                                                        15
Why Does the Opportunity Exist?
                                                          Big Picture

Political Factors                                                       A.M.L.O.
Left wing populist Andres Manuel Lopez
Obrador(AMLO) became President of Mexico on
December 1, 2018
Prior to his inauguration, AMLO proposed policies
that would limit the ability of Mexican banks to
charge fees to retail customers, sparking fears that
the pawn industry may face increased regulation
We view these fears as unfounded:
• Bank fees in Mexico are egregious
    • Ex: direct deposit may cost 10% of your pay check
• Pawn shops are not regulated like financial
  institutions in Mexico
• The government runs a large pawn network that
  was founded in 1774
• Pawn is an essential part of life for the majority of
  Mexicans

                                                                                   16
Why Does the Opportunity Exist?
                                                  Small Picture

Temporary Problems
Hurricane Impact
• In late Q4’17, hurricanes Irma and Harvey led to the
  temporary closing of 176 stores in TX and FL
• FEMA relief funds subsequently reduced the cash
  needs of EZPW’s customers
• The company estimates that 2018 EBITDA was
  impacted by -$6.9M (6.9%)
Segment Reporting Problems
• The company owns 27 Payday Lending / Installment
  Loan stores in Canada that acted as a ~$3.8M
  (3.8%) EBITDA drag in 2018                                      ~62% of stores
                                                                   in TX and FL
• Despite this loss, the segment does not have a
  negative value, so this loss could be excluded from
  “normal” EBITDA

                                                                                   17
Why Does the Opportunity Exist?
                                          Financing Decisions
The dual share structure and messy historical            Effective Equity Sale Multiple of $15.90 Converts
financials combine to limit EZPW’s ability to
                                                                                                           LWC estimate: treasury
access debt markets at acceptable rates             Diluted Shares                              61,691 method + unvested RSUs
As a result, the company has relied on              Price                                        $15.9 2025 convert price
convertible debt. A May, 2018 convert sale led to   Market Cap                                $980,885
a sell off in EZPW shares due to:                   -Cash & Equivalent                         159,912 3.31.18 10Q
                                                    -Notes Receivable                           56,751 3.31.18 10Q
1) Short selling by convert arb players
                                                    -Cash Converters                            46,509 3.31.18 10Q
2) Fear of future dilution                          +Gross Debt                                354,792 3.31.18 10Q includes deriv
3) No subsequent large acquisition                  EV                                      $1,056,463
                                                    3.31.18 T12M adj. EBITDA                   $92,780 Company presentations
In our view, the more appropriate lens is to        EV / T12M adj. EBITDA                        11.4x
consider the convertible debt as an equity raise
at an 11.4x multiple, which compares favorably            Recent Adj. Purchase Price Multiples in Mexico
to where we estimate recent acquisitions have       Avg. Net Revenue / Legacy MX Store $239.7 Investor Day presentation
taken place                                         # of MX Stores Purchased in '18         84 Company filings
If EZPW issued equity at 11.4x and made an          Potential Net Revenue Purchased    $20,135
acquisition at 4.8x, markets would crow about       2018 L.A. Segment EBITDA Margin      39.5% 10k – conservative b/c of new
                                                                                               store drag in FY18

value creation through multiple arbitrage, but      Potential EBITDA Purchased          $7,959
this dynamic is lost on impatient market            Estimated Purchase Price                    $38,148
                                                                                                           Imputed from company
                                                                                                           filings
participants                                        Adj. Purchase Multiple                         4.8x                             18
Why Does the Opportunity Exist?
                                                       Small Picture

Trading Factors                                                                                                2 Year Price and Volume

• In May of 2018 EZPW announced a convertible                $16
                                                                                                                                                  Motivated tax sellers                                                          7,000
  bond offering that led to a 50% decline in
                                                                                   2025 $15.90
  share price as:                                            $14
                                                                                     Convert                                                                                                                                     6,000
    • Arb players shorted stock vs. the convertible
                                                                                   Announced
    • A large acquisition was not subsequently announced     $12
                                                                                                                                                                                                                                 5,000
    • Equity players questioned management’s capital
      allocation and incentives in the face of potential     $10
      dilution                                                                                                                                                                                                                   4,000

                                                                                                                                                                                                                                         (000)
• Non economic sellers contribute to downward                 $8

  momentum                                                                                                                                                                                                                       3,000
                                                              $6
    • Tax motivated sellers sought to lock in short term
      losses in 2018                                                                                                                                                                                                             2,000
                                                              $4
    • EZPW rose ~100% in the 3 quarters before the
      convert, likely becoming too big of a position for
                                                              $2                                                                                                                                                                 1,000
      some holders

                                                              $0                                                                                                                                                                 -
                                                                   1/3/2017
                                                                              2/3/2017
                                                                              3/3/2017
                                                                                         4/3/2017
                                                                                         5/3/2017
                                                                                                    6/3/2017
                                                                                                    7/3/2017
                                                                                                               8/3/2017
                                                                                                                           9/3/2017
                                                                                                                          10/3/2017
                                                                                                                                      11/3/2017
                                                                                                                                      12/3/2017
                                                                                                                                                  1/3/2018
                                                                                                                                                             2/3/2018
                                                                                                                                                             3/3/2018
                                                                                                                                                                        4/3/2018
                                                                                                                                                                        5/3/2018
                                                                                                                                                                                   6/3/2018
                                                                                                                                                                                   7/3/2018
                                                                                                                                                                                              8/3/2018
                                                                                                                                                                                                          9/3/2018
                                                                                                                                                                                                         10/3/2018
                                                                                                                                                                                                                     11/3/2018
                                                                                                                                                                                                                     12/3/2018
                                                                                                                                                                                                                                                 19
Why Does the Opportunity Exist: Hidden Assets?
                  Cash Converters                                    Alpha Credit Receivable
• EZPW owns a ~35% stake in a publicly traded         • EZPW sold Grupo Finmart subsidiary in
  Australian company                                    September, 2016 for $50M and a $91M
    • Present market value of $0.63 per EZPW            promissory note, which was subsequently
      share                                             refinanced at attractive terms
• Cash Converters has its own problems                • Present value of the remaining payments is
                                                        ~$37M, and we believe collection is very likely
    • Regulatory etc.
                                                          • Undiscounted value of $.68 per EZPW
    • Restructuring                                         share
• Difficult to value this business, but there is          • ~$30M expected in 2019
  potential for significant upside with shares            • Borrower saves $4M if paid by 6.30.19
  presently trading around 6x forward earnings

                 ASX: CCV

Mechanical screeners and some sell side reports that we have seen fail to ascribe any value to these
assets, which are worth ~17% of the share price.                                                          20
Are Management’s Interests Aligned?
                                        Incentives

               Management                                     Controlling Shareholder

• CEO - Stuart Grimshaw                        • Philip Cohen
   • Left his job as CEO of the 3rd largest          • Australian banker/private equity
                                                       investor controls 5.5% of stock and
     bank in Australia to join a small cap             100% of the vote
     American pawn company                           • Previously paid himself exorbitant
   • Seems odd, unless he thought there                consulting fees via Madison Park
     was a huge opportunity                          • Agreement terminated in 2014, and DE
                                                       court ruled in Jan. 2016 that “entire
   • Will be selling shares via 10b5-1 to              fairness standard” applies – extremely
     finance the purchase of a new home                unlikely deal is re-implemented
                                                     • Historically poor track record of capital
                                                       allocation
• Top 20 executives                                  • Share price appreciation is now Cohen’s
   • Incentive compensation recently                   only avenue toward wealth creation,
     tied to per share performance                     and new management appears to have
                                                       a better grasp on capital allocation
                                                                                                   21
Quantifying the Cohen Discount
                   • Phil Cohen is a clear hindrance to value creation at EZPW, and EZPW thus deserves to trade at a discount to FCFS
                   • However, at the moment, this discount is historically wide
                       • The last time these levels were approached, performance was suffering from a strategy shift away from the
                         core pawn business that led to significant write downs
                       • At present, the company is operating at a very high level, with continued growth and margin expansion all but
                         guaranteed, suggesting that the spread should be close to record tights, not at record wides
                       • The convertible bond that led to recent selling is out of the money by >100% at present

                                                   FCFS premium T12M EV/EBITDA multiple to EZPW
           160%
                                                 % Premium EBITDA multiple         15 year average   Pre de-WORSEification
                                                                                                                             113%
           140%
                                                                              Disastrous             2025 $15.90 Convert
           120%
                                                                             Strategy Shift                Offering
           100%

             80%
                                                 31%                  44%
             60%

             40%

             20%

                  0%

                       4Q2018E
                       1Q2019E
                       2Q2019E
                       3Q2019E
                       4Q2019E
                       1Q2020E
                       2Q2020E
                       3Q2020E
                       4Q2020E
                        1Q2003
                        2Q2003
                        3Q2003
                        4Q2003
                        1Q2004
                        2Q2004
                        3Q2004
                        4Q2004
                        1Q2005
                        2Q2005
                        3Q2005
                        4Q2005
                        1Q2006
                        2Q2006
                        3Q2006
                        4Q2006
                        1Q2007
                        2Q2007
                        3Q2007
                        4Q2007
                        1Q2008
                        2Q2008
                        3Q2008
                        4Q2008
                        1Q2009
                        2Q2009
                        3Q2009
                        4Q2009
                        1Q2010
                        2Q2010
                        3Q2010
                        4Q2010
                        1Q2011
                        2Q2011
                        3Q2011
                        4Q2011
                        1Q2012
                        2Q2012
                        3Q2012
                        4Q2012
                        1Q2013
                        2Q2013
                        3Q2013
                        4Q2013
                        1Q2014
                        2Q2014
                        3Q2014
                        4Q2014
                        1Q2015
                        2Q2015
                        3Q2015
                        4Q2015
                        1Q2016
                        2Q2016
                        3Q2016
                        4Q2016
                        1Q2017
                        2Q2017
                        3Q2017
                        4Q2017
                        1Q2018
                        2Q2018
                        3Q2018
                                                                                                                                         22
            -20%
Source: Sentieo
Valuation – Downside Case: NAV
                Rare to find a growing, cash flowing, defensive business that is trading below breakup value
# U.S. Stores                508
                                                                                                   Notes
# LatAm Stores               453
                                                                    US Store Value
U.S. Value Per Store       $800      $1,000    $1,200     $1,400    1.   Total US store value of $610M puts a middle of the range
                                                                         private multiple on segment EBITDA
U.S. Asset Value         406,400    508,000   609,600    711,200
                                                                    2.   Management believes $1.2M per store is conservative

L.A. Value Per Store       $300       $350      $400       $450     LatAm Store Value
L.A. Asset Value         135,900    158,550   181,200    203,850    1.   Total LatAm store value of $181 ties to LWC’s estimate of
                                                                         EZPW’s recent adjusted acquisition multiple of 4.8x
Total Store Value       $542,300 $666,550 $790,800 $915,050         2.   De novo cost = ~$300k USDvalue goes up with inventory and
                                                                         customer relationships over time
+ Cash                   286,015 286,015 286,015 286,015
+Note Receivable          37,425   37,425   37,425   37,425         3.   LWC estimates that EZPW’s 2018 acquisitions avg’d ~$500k per

+ Cash Converters         34,484   34,484   34,484   34,484         Cash Converters @ Market                 Notes Receivable @ BS
- Total Debt             511,250 511,250 511,250 511,250
NAV                     $388,974 $513,224 $637,474 $761,724                                Relative Valuation
Shares                    57,268   57,268   57,268   57,952         •    LWC estimates that while EZPW trades at a discount to NAV,
NAV/Share                  $6.79    $8.96   $11.13   $13.14              FCFS trades at a >100% premium
                                                                    •    This despite the fact that EZPW appears to have a better
                                                                         geographic mix in the U.S., has been taking share, has a larger
Price                      $7.73      $7.73     $7.73      $7.73
                                                                         relative growth opportunity, and has upside to margins
Upside to NAV             -13.3%      12.9%     44.0%       70%          relative to FCFS                                                  23
Valuation – Downside Case: Financial Crisis
                                     EZPW: Trading at Crisis Era Lows
If 2018 had been a “normal” year without             2018 adj. EBITDA As Reported       $100,600 Company presentation
assorted one time items, EBITDA would have been      + Est. Hurricane Impact               6,900 Company presentation
~17% higher                                          + Canada EBITDA Drag                  3,771 10K
                                                     + Est. ‘18 De Novo Start Up Loss        400 LWC estimate
                                                     + FY contribution from acqs           6,204 LWC estimate
                                                     Est. 2018 Normal adj. EBITDA       $117,875 LWC estimate
If despite EZPW’s consistent growth throughout
                                                     Crisis Era Low Multiple                5.0x Source: Sentieo
the financial crisis, T12M EV/EBITDA multiples       Enterprise Value                   $589,374
declined to a low of 5.0x, on normalized EBITDA      + Cash and Equivalents              286,015 10K
downside would be limited                            + Cash Accumulation                       0 completely unrealistic
                                                     + Notes Receivable                   37,425 10K
                                                     + Cash Converters                    34,484 10K
This sort of multiple implies dark clouds on the     -2019 Convert Gross                 195,000 10K note: June maturity
horizon, yet EZPW is primed for continued margin     -2024 Convert Gross                 143,750 10K
expansion and organic sales growth, as well as       -2025 Convert Gross                 172,500 10K
growth from acquisitions                             Market Cap                         $436,048
                                                     Diluted Shares                       57,268 Treas. Method inc. unvested RSUs
                                                     Per Share                             $7.61

                                                     Downside                               -1.6%

                                                                                                                                    24
Valuation: Normalized 2018, Historical Discount
                                 Improving Profile… Increasing Cohen Discount?
If 2018 had been a “normal” year without                 2018 adj. EBITDA                            $100,600
assorted one time items, EBITDA would have been          + Est. Hurricane Impact                        6,900
~17% higher                                              + Canada EBITDA Drag                           3,771
                                                         + Est. De Novo Start Up Loss                     400
                                                         + FY Contribution From Acqs                    6,204
With no multiple expansion, this would lead to           Est. 2018 Normal adj. EBITDA                $117,875    $117,875 $117,875
18% upside                                               T12M Multiple                                    5.8x      ~7.5x       ~9.2x
                                                         Enterprise Value                            $677,781    $886,254 $1,086,173
                                                         + Cash and Equivalents                       286,015     286,015    286,015
In recent years, EZPW has simplified its business,       + Notes Receivable                            37,425      37,425     37,425
improved their geographic mix, developed an              + Cash Converters                             34,484     $34,484    $34,484
acquisition pipeline, and proven they can execute        - 2019 Convert Gross                         195,000     195,000    195,000
very well                                                - 2024 Convert Gross                         143,750    $143,750 $143,750
                                                         - 2025 Convert Gross                         172,500    $172,500 $172,500
                                                         Market Cap                                  $524,454    $893,520 $1,094,120
All of these items suggest that a return to historic     Diluted Shares TM, inc. unvested RSUs         57,268      62,398     67,782
discounts (or tighter) is appropriate                    Per Share                                      $9.16      $14.32     $16.14
                                                         Upside                                         18.3%        85%      108.5%

Note that at historic discounts, implied multiples     Current Cohen discount: 133%
are attractive on an absolute basis                                  Cohen discount to FCFS @ 44%
                                                                                         Cohen discount to FCFS @ 31%                   25
                                                         FCFS @ 13.4x T12M EV/EBITDA per Bloomberg
Valuation: Acquisitions & Operational Improvement
                                                 Back of the Envelope
Multiple moving pieces including margin assumptions,                                       2020         2021
                                                            U.S. Segment EBITDA        $115,965     $115,965
cash accumulation, acquisition multiples, and financing
                                                            + Est. Hurricane Impact       6,900        6,900Investor day presentation
decisions make an accurate view of the future
                                                            Adj U.S. Segment EBITDA    $122,865     $122,865
impossible
                                                            LatAm Store Count               600          725LWC estimate
                                                            *Net Revenue / Store            250          250Slight improvement
However, using reasonable estimates can be illustrative     LatAm Net Revenue          $150,000     $181,250
                                                            EBITDA Margin                 43.0%        44.0%Conservative vs FCFS
Assuming reasonable operational improvements as             LatAm Segment EBITDA         $64,500    $79,750
recently acquired LatAM stores mature and store count       Corp Segment EBITDA         -$50,000 -$51,000 LWC estimate
growth well within guidance illustrates the potential to    Total EBITDA               $137,365 $151,615
increase adjusted EBITDA by 60% over the next 3 years       + adj.                         8,000      8,000 LWC estimate
                                                            Adj. EBITDA                $145,365 $159,615
                                                            Multiple                       10.0x      10.0x
Assuming collection of the outstanding receivable,
                                                            EV                        $1,453,650 $1,596,150
redemption of the 2019 note, $40M in cash                   + Cash and Equivalents       108,440    103,440
accumulation per year, average purchase price of $400k      + Cash Converters             34,484     34,484 10K
USD per store, and a multiple reflective of defensive,      -2024 Convert Gross          143,750    143,75010K
growing business that is executing well illustrates the     -2025 Convert Gross          172,500    172,50010K
                                                            Market Cap                $1,280,324 $1,417,824
potential for significant upside, and a very large margin                                                      Treasury method, including.
of safety from current prices                               Shares                        66,700       68,500unvested RSUs
                                                            Per Share                     $19.20       $20.70
                                                            Upside                         148%         168%                                 26
Valuation: Relative to SP 500
                   As recession fears grow, long only investors should seriously consider EZPW

•                      EZPW                                                        SP500

                                                                                   Lower Relative Growth
                                                                                Downside to Normal Margins
                                                                             Downside to Normal Valuation Range
         Higher Relative Growth                                                   Cyclical High Point (GDP,
       Upside to Normal Margins                                                     unemployment, gas)
    Upside to Normal Valuation Range
         Cyclical Low Point (GDP,
        unemployment, gas, gold)

              EZPW could trade 20-50% higher than our estimates if (when) GDP goes negative…
              The S&P could trade down 20+% if GDP goes negative…

                                                                                                                  27
Valuation Kickers
                        Significant Opportunity for Creative Value Creation

• EZPW’s ability to access capital markets has been significantly impaired
  by the presence of the controlling shareholder, resulting in significant
  share price convexity tied to convertible bonds
   • Going forward, EZPW should be able to self finance their growth, and potentially
     restructure their capital structure on more favorable terms
   • A financial buyer could remove the Cohen discount and restructure the capital
     structure on more favorable terms
• As Cohen ages, he is more likely to sell
   • FCFS is a logical buyer that could realize large operational synergies
   • Strategically, if FCFS were to purchase EZPW, they would be eliminating their main
     competitor in any auction for additional stores

                                                                                          28
Summary
                                                                            Valuation Summary
An investment in EZPW is very            Downside Cases                                             Target Price % Upside
favorably skewed, as downside            Estimated Net Asset Value                                    $11.13       44%
appears negligible, and significant      Financial Crisis EBITDA Multiple                              $7.61       -2%
potential upside exists as the company
continues to grow revenue and            Upside Cases                                               Target Price % Upside
margins in the years to come.            "Normal" 2018 adj. EBITDA, No Multiple Expansion              $9.16       18%
Importantly, even absent successful      "Normal" 2018 adj. EBITDA, 15 Year Comp Discount             $14.32       85%
growth, meaningful upside exists as      "Normal" 2018 adj. EBITDA, Pre Acquisition Comp Discount     $16.14      109%
one time items roll off and EBITDA        2020: Acquisitions and Operational Improvement              $19.20      148%
normalizes.                               2021: Acquisitions and Operational Improvement              $20.70      168%

                                                                                                                            29
What Could Go Wrong?
                 Risk                                  Mitigant

• Controlling shareholder             • Incentives are to focus on share
                                        price

• Continued reliance on potentially   • At this point, the company should be
  dilutive convertible offerings        able to self finance all but the largest
                                        acquisitions
• Regulatory                          • Unlikely: pawn is a vital service

• Weakness in retail sales/shift to   • A real risk, reduced by on demand
  online                                nature of pawn, and clients w/o
                                        credit cards

• Universal Basic Income?             • Human nature to outspend your
                                        income
                                                                                   30
If you are a patient, open minded, accredited investor that is not afraid to
stand away from the crowd, we should talk. Please join our mailing list at:
        www.LaughingWaterCapital.com
You can also read