STRATEGIC UPDATE MEETING - 31 MARCH 2021 - JDE Peet's

Page created by Janet Johnston
 
CONTINUE READING
STRATEGIC UPDATE MEETING - 31 MARCH 2021 - JDE Peet's
STRATEGIC
UPDATE MEETING
31 MARCH 2021
STRATEGIC UPDATE MEETING - 31 MARCH 2021 - JDE Peet's
IMPORTANT INFORMATION

Presentation
The condensed consolidated unaudited financial statements of JDE Peet’s N.V. (the Company)        There are a number of factors that could affect the Group’s future operations and could cause
and its consolidated subsidiaries (the Group) are prepared in accordance with International       those results to differ materially from those expressed in the forward-looking statements
Financial Reporting Standards as adopted by the European Union (IFRS). In preparing the           including (without limitation): (a) competitive pressures and changes in consumer trends and
financial information in these materials, except as otherwise described, the same accounting      preferences as well as consumer perceptions of its brands; (b) fluctuations in the cost of green
principles are applied as in the consolidated special purpose financial statements of the Group   coffee, including premium Arabica coffee beans, tea or other commodities, and its ability to
as of, and for, the year ended 31 December 2019 and the related notes thereto. All figures in     secure an adequate supply of quality or sustainable coffee and tea; (c) global and regional
these materials are unaudited. In preparing the financial information included in these           economic and financial conditions, as well as political and business conditions or other
materials, most numerical figures are presented in millions of euro. Certain figures in these     developments; (d) interruption in the Group's manufacturing and distribution facilities; (e) its
materials, including financial data, have been rounded. In tables, negative amounts are shown     ability to successfully innovate, develop and launch new products and product extensions and
in parentheses. Otherwise, negative amounts are shown by "-" or "negative" before the             on effectively marketing its existing products; (f) actual or alleged non-compliance with
amount.                                                                                           applicable laws or regulations and any legal claims or government investigations in respect of
                                                                                                  the Group's businesses; (g) difficulties associated with successfully completing acquisitions
Non-IFRS Measures                                                                                 and integrating acquired businesses; (h) the loss of senior management and other key
These materials contain non-IFRS financial measures (Non-IFRS Measures), which are not            personnel; and (i) changes in applicable environmental laws or regulations. The forward-
liquidity or performance measures under IFRS. These Non-IFRS Measures are presented in            looking statements contained in these materials speak only as of the date of these materials.
addition to the figures that are prepared in accordance with IFRS. The Group's use of Non-        The Group is not under any obligation to (and expressly disclaim any such obligation to) revise
IFRS Measures may vary significantly from the use of other companies in its industry. The         or update any forward-looking statements to reflect events or circumstances after the date of
measures used should not be considered as an alternative to profit (loss), revenue or any other   these materials or to reflect the occurrence of unanticipated events. The Group cannot give any
performance measure derived in accordance with IFRS or to net cash provided by operating          assurance that forward-looking statements will prove correct and investors are cautioned not to
activities as a measure of liquidity. For further information on Non-IFRS Measures, see the       place undue reliance on any forward-looking statements. Further details of potential risks and
definitions in the press release and adjusted EBIT as described in segment information in the     uncertainties affecting the Group are described in the Company’s filings with the Netherlands
condensed consolidated unaudited financial statements.                                            Authority for the Financial Markets (Stichting Autoriteit Financiële Markten).

Forward-looking Statements                                                                        Market and Industry Data
These materials contain forward-looking statements as defined in the United States Private        All references to industry forecasts, industry statistics, market data and market share in these
Securities Litigation Reform Act of 1995 concerning the financial condition, results of           materials comprise estimates compiled by analysts, competitors, industry professionals and
operations and businesses of the Group. These forward-looking statements and other                organisations, of publicly available information or of the Group's own assessment of its markets
statements contained in these materials regarding matters that are not historical facts involve   and sales. Rankings are based on revenue, unless otherwise stated.
predictions. No assurance can be given that such future results will be achieved. Actual events
or results may differ materially as a result of risks and uncertainties facing the Group. Such    .
risks and uncertainties could cause actual results to vary materially from the future results
indicated, expressed or implied in such forward-looking statements.

                                                                                                                                                                                                2
STRATEGIC UPDATE MEETING - 31 MARCH 2021 - JDE Peet's
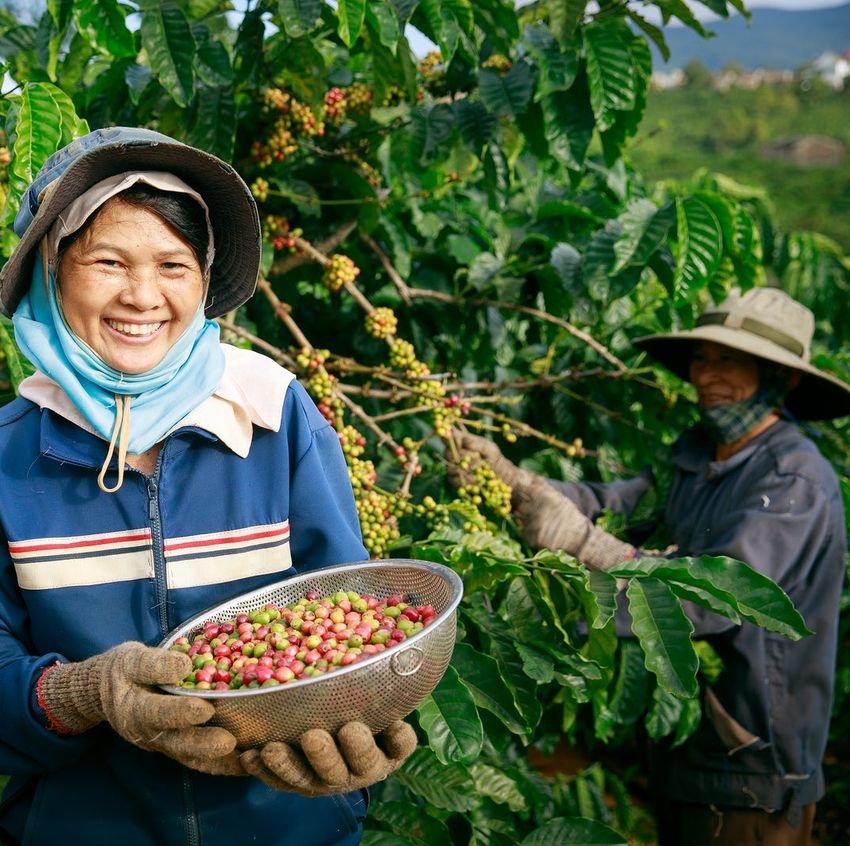
STRATEGIC UPDATE
JDE PEET‘S: A SUSTAINABLE GROWTH STORY
Fabien Simon, CEO

31 March 2021
STRATEGIC UPDATE MEETING - 31 MARCH 2021 - JDE Peet's
COFFEE & TEA IS A VERY LARGE CATEGORY
AT HOME & AT WORK ARE THE MOST POPULAR PLACES TO DRINK COFFEE & TEA
                                                                                                                Pre-COVID
                                      Value                                               Cups
                  EUR 380 bn                        CAGR                           3.1 trillion
                                                   (15-19)          The most popular places to drink coffee & tea are:
                 ~120 bn

                      At-Home                       4.4%
                 ~260 bn
                                                       2020: +7%
                                                                     1     At home                          ~80%

                                 AFH                6.0%             2     At work
                                                                                                            ~20%
                                                       2020: -23%
                          Incl. at Work &
                          at coffee stores                           3     In coffee stores
Note: *Market sizes are Pre-COVID numbers (2019)
Source: Euromonitor
Strictly confidential                                                                                                4
STRATEGIC UPDATE MEETING - 31 MARCH 2021 - JDE Peet's
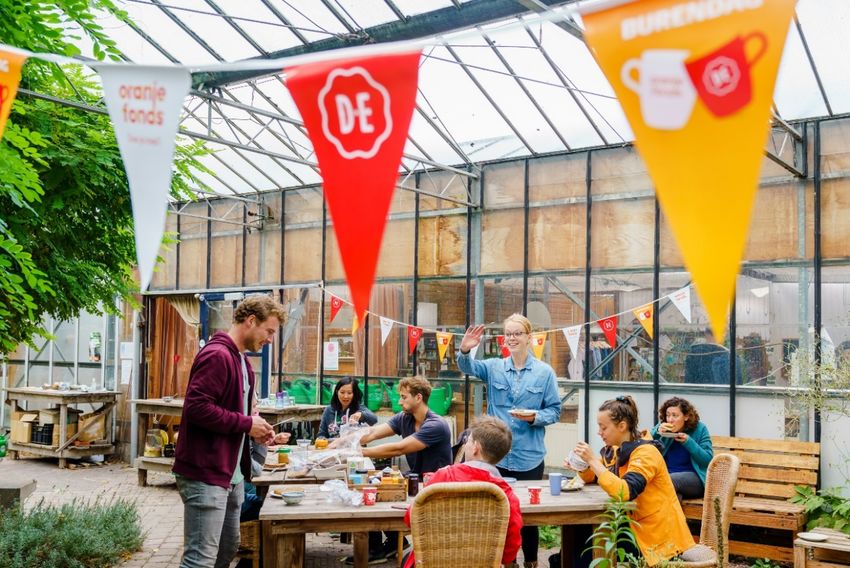
AT-HOME COFFEE & TEA IS HIGHLY ATTRACTIVE

Global retail Coffee and Tea market of EUR 122 bn1 …
                                                           …with growth outpacing most adjacent categories at 4.4% p.a.2
                                                                             7.5%                 4.4%                    4.0%                    3.7%                  3.4%                3.1%                     1.3%
                                                                  Bottled water            Coffee & Tea            Carbonated          Staple foods         Sports drinks            Beer                    Juice
                                                                                                                   Soft Drinks

          Coffee & Tea category has promising dynamics:

                                Addresses increasingly growing                                                                                            Proven to be
                                                   health trend                                                                                           inflation resilient

                             Cups of coffee are premiumizing3                                                                                               High margins
                                                         ~5c                      ~7c                                                                       and healthy cash flows
                                                         2010                    Today

Note: (1): 2020 RSV; (2): Retail sales value (2015-2019) at fixed 2020 exchange rate (with current prices); Numbers scope for (1) and (2) is B2C consumer packaged goods (CPG) sales at retail sale prices
(RSP) and total volume, including direct to consumer; excluding Ready to drink and Out of Home; (3): Price of coffee cup is average RSP per cup from 2010 - 2019. | Source: Euromonitor                                     5
STRATEGIC UPDATE MEETING - 31 MARCH 2021 - JDE Peet's
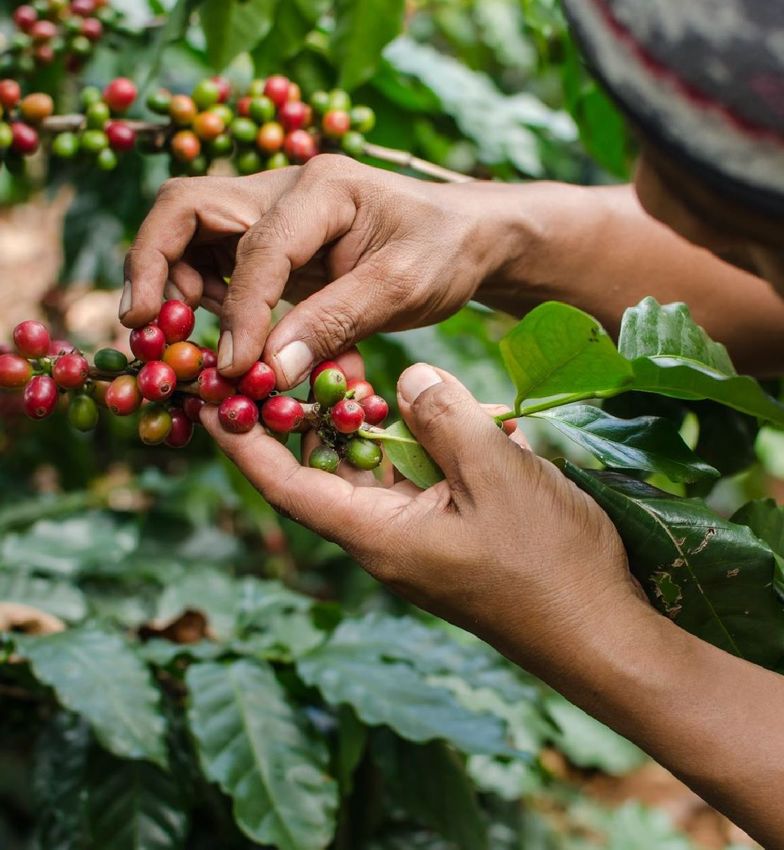
INSTANT AND R&G STILL MAKING UP MAJORITY OF COFFEE VALUE POOL,
SINGLE SERVE & BEANS OUTGROWING
                         Value                                                                                    Cups % of total cups consumed within market
                                                                      CAGR                       R&G                              ~5c per cup*                       Instant         ~6c per cup*
            EUR 75 bn                                                (15-19)
                                                                      4.2%
                                                                                                           53%                  49%                                                 46%
                 Beans                                                 6.7%                                                                                                  29%
                 SiSe                                                  7.8%
                                                                                                   Developed             E Emerging                                     D l d E E
                                                                                                                                                                      Developed

                  R&G                                                  2.6%                      SiSe                             ~30c     per cup*                  Beans           ~8c per cup*

                  Instant                                              3.5%                               10%                                                                  8%
                                                                                                                             1%                                                    4%
                                                                                                   Developed              E Emerging                                    D l d E EEmerging
                                                                                                                                                                      Developed

Note: Currencies are €cents; (*) price per cup is Retail Sales Price. Market sizes are Pre-COVID numbers (2019). Scope is 103 selected ERM countries, B2C consumer
packaged goods (CPG Retail) sales at retail sale prices (RSP), including direct to consumer. Excluding Away-From-Home and RTD. Developed markets include Western                                6
Europe, North America, Australia, New-Zealand and CEE. // Source: Euromonitor
STRATEGIC UPDATE MEETING - 31 MARCH 2021 - JDE Peet's
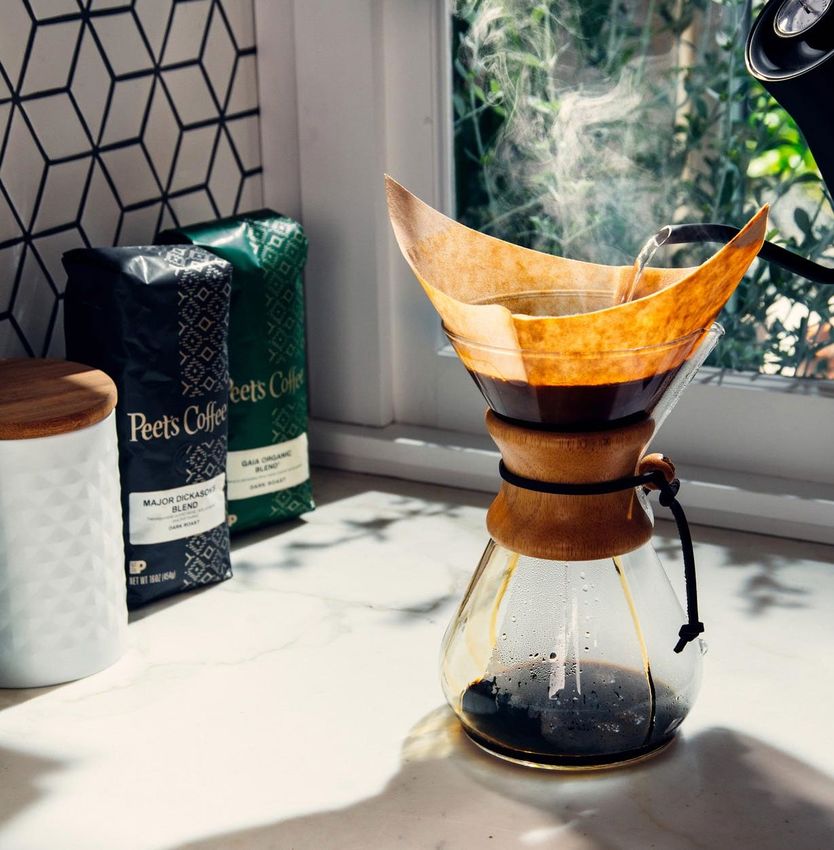
BARRIERS TO ENTRY ARE HIGH & INCREASING

                                                     Omni-channel
                                                      capabilities                                                                                                     2014              2020
                                                                                                                                                               #1 + #2 players combined market share:

                                                                                                                                                                                Coffee
                                                                                                                                                                 29%                        36%
Technology range                                         Requirements                                               Local and
  and expertise                                             to Win                                                 global scale
                                                                                                                                                                                 Tea
                                                                                                                                                                 13%                        13%

                                                    Wider
                                             portfolio of brands

 Note: Numbers include Mondelez (2014) /JDEP (2020) and Nestlé in Coffee; Numbers include Unilever and Associated British Foods (2014) /Tata consumer products (2020) in Tea.
 Source: Euromonitor                                                                                                                                                                               7
STRATEGIC UPDATE MEETING - 31 MARCH 2021 - JDE Peet's
JDE PEET’S HAS BUILT A STRONG PLATFORM WITH UNIQUE CAPABILITIES

                                                                         World’s largest C&T pure-player (Scale & focus)

                                                                         268 years of history

                                                                         Diversified portfolio across categories and geographies

EUR 6.7 bn at                                      19.2%                 Mastery of all coffee technologies (incl. RTD with partnerships)
   Sales                                           Adj. EBIT

                                                                         Omni-channel with CPG/office center of gravity (75% in-home)
140 bn at                      7.6c              in >100
  cups                        per cup*                     countries     Support of 380,000 farmers through Common Grounds

 Note: Currencies are €cents; (*) price per cup is Retail Sales Price.

                                                                                                                                       8
STRATEGIC UPDATE MEETING - 31 MARCH 2021 - JDE Peet's
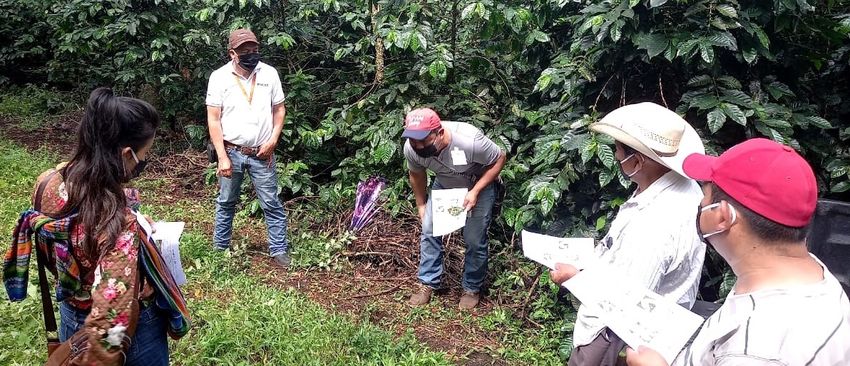
JDE PEET’S HAS KEY LEADERSHIP POINTS OF DIFFERENTIATION
                                                     World largest pure-player,
                                            78% of revenue with #1 or #2 share position

           Over-indexed to,                                                                                     Largest owner of coffee
        and gaining shares in,                                                                                  and tea brands globally
      fastest growing categories

                                             Leadership through innovation and expertise
              Instant Coffee                                           Single Serve                                            Beans & Other

• #1 in freeze-dried within existing footprint • Global leader in Aluminium capsules in modern trade              • World Largest craft roaster (Peet’s)
• Unique Proprietary liquid technology         • Largest appliance park in EU - with most affordable &            • Diversified R&G and Beans offer, with
                                                 sustainable offering (Senseo)                                      locally anchored brands
• #1 brand in white coffee                     • 2nd largest appliance park in EU for base beverage (Tassimo)     • Strong and growing portfolio in Tea

                                                                                                                                                            9
STRATEGIC UPDATE MEETING - 31 MARCH 2021 - JDE Peet's
WE HAVE A GROWTH- & PURPOSE-LED STRATEGY TO INCREASE BOTH OUR
BUSINESS PERFORMANCE AND THE POSITIVE IMPACT ON OUR ECOSYSTEM
                                          We
                               unleash the possibilities
                       of Coffee & Tea, to create a better future
     SERVE MORE CUPS               MASTER EXECUTION                 GROW TOGETHER

     Penetration                      Quality                       Talent
                                                                    Diversity & Inclusion

     Premiumisation                   Efficiency                    ESG

     Globalisation                    Operational leverage          Partner of Choice

                                                                                            10
IN 2020, WE HAVE REALISED FURTHER IN-HOME GROWTH (+9.1%) ON THE
BACK OF ACCELERATED CONSUMER TRENDS
Long-term consumer trends that are still relevant today   Consumer trends recently accelerated by COVID

      Café culture is here to stay                         Home recast as the new coffee shop
                                                                                     JDEP In-Home growth    +9%
                                                                                    JDEP Single Serve growth +18%
      Convenient quality                                   Health and Hygiene as priorities

      Consumers abandon middle ground                      Online leapfrog
                                                                                      JDEP Online growth +71%

      Emerging markets, emerging growth                    Sustainable and local consciousness

                                                                                                           11
THE STRENGTHS OF IN-HOME DID OFFSET THE UNPRECEDENTED DECLINE OF
AWAY FROM HOME IN 2020
                                                        AFH RESHAPED FOR EXTENDED RECOVERY
      ORGANIC SALES GROWTH 2020:           -0.2%

                                                       Permanent closure of 88 Stores (from 574
                                                       pre-COVID)
              +9.1%
                                 (30.0%)
                                                       Organisational & cost adjustments across
          In-Home             Away-From-Home
                                                       geographies

     ORGANIC SALES GROWTH – AWAY-FROM-HOME
                                                       Mobile order and delivery
      Q1 20           Q2 20     Q3 20          Q4 20

      (7%)                                             Reshaping customer contracts, and future
                                (30%)          (30%)   increase of Liquid & Single Serve offerings
                      (50%)

                                                                                                     12
2020 HIGHLIGHTED INCREMENTAL IN-HOME GROWTH OPPORTUNITIES
ACROSS GEOGRAPHIES & CHANNELS
Geography                           U.S.                                                               Greater China
                                   Strong premiumisation within growing, under-                        Strong penetration growth with accelerated
                                   penetrated, Single-Serve segment                                    premiumisation across categories
                                        ~25%           Of global premiumisation captured in the US         ~11     Low average yearly cups/capita in China

                                        ~12%           U.S. SiSe % of total cups (vs +17% in EU)          ~100     Rapidly emerging hotspots (e.g. Shanghai)

Channel                             Digital Commerce                                                   Appliances (Single Serve)
                                   Enabling consumers to buy anywhere, anytime                         Significant penetration potential remaining, leveraging
                                                                                                       partnerships
                                          3Y+          Equivalent years of penetration gain realised      ~10%     L5Y global SiSe market growth p.a.
                                                       over last 6 months
                                                                                                          ~25pp    Penetration1 delta within large EU markets
                                                                                                                   (i.e. France vs Germany, Spain)

Note: (1): Estimated based on difference in % of total SiSe Coffee cups; Source: Euromonitor;                                                                    13
WE WILL INVEST AHEAD OF THE CURVE TO CAPTURE THESE GROWTH
OPPORTUNITIES
     2021                                       Ambition over next 3 years
                                     U.S.                                                  Greater China
                             • Accelerate Peet’s ambition to become in-home      •   Turbo-charge Peet’s retail store expansion
                               Coffee powerhouse in the U.S.                     •   Invest behind our Premium brand equity for In Home
                             • Invest behind new growth opportunities across     •   Innovation for & by China
                               channels                                          •   Build out our existing partnership with Hillhouse
                                                                                     Capital, on the back of Philips DA sale
 Drive investments
                                     Digital Commerce                                      Others
back to 2019 levels
                             • Double our dedicated capabilities and invest in   • Speed up our appliance's innovation rhythm
   A&P spend (esp. Working     automated systems                                 • Office reopening & reinvention
   Media)                    • Double the weight of digital media spend          • Emerging Markets talent & capability
   Appliance investment                                                          • ESG as a growth enabler

                                                                                                                                    14
OUR AMBITION: ATTRACTIVE VALUE CREATION YEAR OVER YEAR

                        2021                          2022 & Beyond

              “A normalized year”               “A pure player algorithm”
                   Organic Sales Growth               Organic Sales Growth
                        3 – 5%                              3 – 5%
               Organic Adjusted EBIT Growth        Organic Adjusted EBIT Growth
          Low-Single-Digit, with A&P catch-up         Mid-Single-Digit
                        Leverage                          FCF conversion
                         < 3x                                ~70%

                    Proposed dividend                   Intended dividend
                         €0.70                  Stable to growing over time
                                                                                  15
KEY TAKE-AWAYS:             JDE PEET’S – A SUSTAINABLE GROWTH STORY

  One of the strongest growing                    Incremental growth opportunities from
       categories in F&B                           recently accelerated consumer trends

       JDE Peet’s has the assets to win & capture these opportunities

      Largest global C&T      Fuelled by a    Strong Cash Flow to fuel     Attractive return
        pure-player        Powerful Purpose   organic & inorganic growth   and earnings profile

                                                                                                  16
PEET’S COFFEE
A FRESH GROWTH STORY
Shawn Conway, President Peet’s

31 March 2021
PREMIUM POSITION & UNIQUE MODEL IN THE WORLD‘S LARGEST MARKET
                                                                                                                             Pre-COVID

                   The “Big Bang” of                                                                                        In-Home
                  US Speciality Coffee                                                                                     ~50% of sales

                                                                                            329 CUPS PER CAPITA
                                                                                              vs 556 in Western Europe

             Now the World’s Largest
                                                                                                      +7%                Away-from-Home
                  Craft Roaster                                                                        Sales $
                                                                                                       CAGR
                                                                                                                           ~50% of sales
                                                                                                      2015-2020

Source: Euromonitor for cups per capita. CAGR growth per company data same scope as 2020.
                                                                                                                                           18
AWAY-FROM-HOME BUSINESS RESHAPED FOR EXTENDED RECOVERY
        COMPANY OWNED STORES         OUT OF HOME VENUES

                                                          19
CONTINUED PLATFORM INVESTMENTS POSITION US WELL FOR THE FUTURE
 MOBILE ORDER AHEAD   LOYALTY REWARDS PROGRAM     DELIVERY

  >40% OF ORDERS       >55% OF TRANSACTIONS

                                                             20
IN-HOME SUCCESS: FASTEST GROWING PREMIUM CPG COFFEE BRAND
                    Robust consistent share growth                                                                                                            Super premium pricing strategy
                      Peets’s market share in the CPG premium segment                                                                                  Peet’s brand price vs average CPG premium segment (9-13 OZ bags)1

                                                                                  6.3%                                                                                                           $8.48
                                                  5.8%
                   5.0%                                                                                                                                          $6.71

                  2016                              2019                          2020                                                                      Premium Segment                    Peet’s Coffee

                                                       Freshness is key, that’s why we are Direct Store Distribution (DSD)
                                                                                            •      Only national DSD Network
                                                                                            •      650+ routes
                                                                                            •      17,000+ stores
                                                                                            •      90-day shelf life
                                                                                            •      Selling, Merchandising & Marketing system
Source: NielsenIQ Total US xAOC (eXtended All Outlet Combined), CY ending 2016, 2019, 2020 CPG premium segment = premium bags, K-cups, Capsules only
1 Based on 9-13 OZ bags sales
                                                                                                                                                                                                                           21
LEVERAGING E-COMMERCE INVESTMENTS AND OUR FRESHNESS MODEL
         Amazon, E-Retailers and E-Grocercy               Peets.com: Direct-to-Consumer

                                              • Coffee ships within 24
• Peet’s is #4                                  hours of roasting
  brand on
  Amazon.com                                  • Maximum variety and
                                                unique offerings

• Growing 2x
  category                                    • Doubled sales in 2020

                                              • >40% subscriptions

                                                                                          22
MAJOR HEADROOM AHEAD
  Plenty of room to keep growing household penetration                                                                                   32.0
 Household Penetration of US brand (2016-20)
                                                                                                  26 pts
                                                                                                             14.7

                                                                5.4                       6.1
                    3.9

                    2016                                        2019                      2020

 Initiatives & Investments to capture the growth opportunity

              GROW THE CORE                                                  ADD NEW PRODUCTS                         ACCELERATE E-COMMERCE

    • Supply chain expansion                                           • Expand Aluminum capsule portfolio          • Digital & Performance marketing
    • K-Cup, R&G extensions                                            • New technologies                           • Building Amazon expertise
    • Continued ESG progress                                           • Ready-to-drink                             • Supply chain evolution
    • Systems and organization

Source: Shopper Explorer, rolling L52 weeks ending 12.26.2020                                                                                           23
OUR ESG FRAMEWORK
AN ENABLER FOR GROWTH
Daniel Martz, Corporate Affairs Director
Laurent Sagarra, Global Technical Solutions Director

31 March 2021
OUR ESG PRINCIPLES

Strengthening JDE Peet’s RESILIENCE through the
efficient use of resources and cost reduction

Enhancing CONSUMER RELEVANCE by
leveraging investments through product quality
and brand credentials

Meeting SHORT-TERM AND LONG-TERM
expectations of our stakeholders

                                                 25
OUR ESG STRATEGYIS COMPREHENSIVE & AMBITIOUS
                                    WE UNLEASH THE POSSIBILITIES OF
                                 COFFEE & TEA TO CREATE A BETTER FUTURE

       COMMON GROUNDS                         MINIMISED FOOTPRINT                CONNECTED PEOPLE
     Addressing the priority issues            Reducing our environmental        Engaging our employees
          in our supply chain                     impact step-by-step              and our communities

              Selected KPI:                           Selected KPI:                   Selected KPI:
     100% responsibly sourced               100% recyclable, compostable       Targeting gender balanced
   green coffee, tea and palm oil                                              management positions by
              by 2025                       or reusable packaging by 2025                2025

                                      GOOD GOVERNANCE, ETHICS & PARTNERSHIPS
2020 DEMONSTRATED SIGNIFICANT PROGRESS AGAINST AMBITIONS

                                                           27
OUR RESPONSIBLE SOURCING COMMITMENTS

Coffee                                 29%       40%
                         21%
                         2019          2020   2025 target

                                       31%      100%
Palm oil                 11%
                         2019          2020   2025 target

Farmers                            380,000     500,000
reached                 300,000
                         2019          2020   2025 target

                                                            28
WE INCREASED OUR REACH BY 80,000 SMALLHOLDER FARMERS IN 2020

                                                               29
PACKAGING SUSTAINABILITY – ENHANCED COMMITMENT

By 2025, JDE Peet’s will:                                            Priorities

                                                                     Tea
                                                                     Convert to industrial compostable
                                                                     material & eliminate box overwrap

                                                                     Reflex (R&G/Beans)
                                                                     Converting all flexible materials to
  SAVE                      DESIGN                      USE          specifications designed for recycling
15.000                      100%                       35%           Tassimo discs
TONNES OF      OF OUR PACKAGING TO BE REUSABLE,   RECYCLED CONTENT
                                                                     Develop recyclable solution for T-disc
PACKAGING         RECYCLABLE OR COMPOSTABLE       IN OUR PACKAGING
                                                   WHERE ALLOWED
                                                                     Single-serve end-use
                                                                     Develop pre-competitive
                                                                     post-consumer recycling

                                                                                                              30
ADDRESSING CLIMATE CHANGE WITH A NEW SBTi COMMITMENT
                    Our GHG emissions                        GHG Emissions reduction – Proposed Target

                   SCOPE I                               • Signed up to SBTi in March 2021
                   Emissions from assets owned           • Release of our climate strategy to reduce GHG emissions
                   or operated by the company              across the value chain later this year

                                                 < 10%                               Renewable electricity / energy
                                                          Scope I+II           Energy efficiency & waste / water reduction
                          SCOPE II                          reduction levers
                                                                                            Sustainable fleet
                          Emissions from
                          purchased energy                                             Green coffee sustainability
                                                                                         Sustainable packaging
                                                           Scope III
 SCOPE III                                                  reduction levers               Low-carbon logistics
 Emissions from all other value chain
                                                 > 90%
                                                                                     Other areas (e.g. nutrition, etc.)
 activities and end-use of products
                                                                                                                          31
GÄVLE OUR FIRST FACTORY TO ACHIEVE
CARBON NEUTRALITY IN 2021

                                     32
CONNECTED PEOPLE – ADVANCING D&I AND SUPPORT FOR COMMUNITIES
              TARGETING GENDER-BALANCED
                                                            ENGAGING OUR COMMUNITIES
             MANAGEMENT POSITIONS BY 2025

Executive              30%           36%
Committee
                       2019          2020

Global
Leadership             34%           36%
Team                   2019          2020

All Employees          39%           42%
                       2019          2020
                                             45 MILLION CUPS
                                            OF COFFEE AND TEA DONATED FOR
                                               COVID FRONTLINE WORKERS
                                                                                       33   33
COMING SOON….

      Gevalia Reset                  Farmers Initiative                    Peet’s Anniversary Blend

•   Recyclable packaging       •   EUR 0.25 per product donated        •    100% women-produced coffee
•   Low-carbon manufacturing       to Common Ground projects           •    Donates to Women’s Center
•   4C & Rainforest Alliance   •   Rainforest Alliance certification        for Entrepreneurship in Huila,
    certification                                                           Colombia

                                                                                                     34
CAPITAL ALLOCATION AND CAPITAL STRUCTURE
TO FACILITATE GROWTH
Scott Gray, CFO

31 March 2021
AGENDA

CAPITAL ALLOCATION PRIORITIES

CAPITAL STRUCTURE

                                36
CAPITAL ALLOCATION PRIORITY #1 – REINVEST IN THE BUSINESS

     #1 - Investing behind the organic growth opportunities within our existing business to support growth

  Investments to support strategic growth priorities at geography, category and brand levels
     • Brand investments
     • Capabilities
     • CAPEX for capacity and productivities
     • ESG

  Recent examples
     • Drive A&P investments back to pre-COVID-19 sufficiency levels in 2021
     • EUR 110 m to expand our manufacturing capacity for aluminum capsules
     • Expansion of our freeze-dried instant coffee capacity

                                                                                                             37
CAPITAL ALLOCATION PRIORITY #2 – DELEVERAGING

                                          #2 - We target an optimal leverage of around 2.5x
                       Pro-Forma JDE Peet’s
   4.4X
                              4.2X
               3.7X
                                               3.4X     3.2X        Strong track record of deleveraging
                              3.1X
  in EUR bn
                              6.5                                   Well positioned to reach a leverage ratio of below 3.0x in
    5.7
                              PEET’S
                                               5.6                  the course of 2021, as we move towards our optimal
               5.2
                                                        5.1         leverage of around 2.5x
                              IFRS16

  Dec 17      Dec 18        Dec 19            Jun 20   Dec 20

                                                                                                                             38
CAPITAL ALLOCATION PRIORITY #3 – M&A

  #3 - We will continue to pursue inorganic growth opportunities, but always in line with our highly selective
    business and financial criteria. While our leverage is above our optimal leverage, we will not prioritize
                               transformational cash or debt funded acquisitions
                                                                        Partnership

                                                                                                        Partnership

           2015          2016            2017              2018            2019           2020           2021

                                                                                                                      39
CAPITAL ALLOCATION PRIORITY #3 – M&A

  #3 - We will continue to pursue inorganic growth opportunities, but always in line with our highly selective
    business and financial criteria. While our leverage is above our optimal leverage, we will not prioritize
                               transformational cash or debt funded acquisitions

      Bolt-on M&A focused on the core of our growth strategy

      Strategic Partnerships

                                                                                                                 40
CAPITAL ALLOCATION PRIORITY #4 & #5 – RETURN CASH TO SHAREHOLDERS

   #4 - We expect our excess cash to contribute to shareholder remuneration through stable dividend flows,
                                       sustainably growing over time

       #5 - We will not consider share repurchase while leverage is above our optimal leverage of 2.5x

                                                                                                             41
CAPITAL ALLOCATION PRIORITIES GUIDE JDE PEET’S STRATEGIC AGENDA

                                     REINVEST IN THE BUSINESS

                                          DELEVERAGING

                                              M&A

                                            DIVIDENDS

                                        SHARE REPURCHASE

      We believe in financial discipline and adherence to our capital allocation framework

                                                                                             42
AGENDA

CAPITAL ALLOCATION PRIORITIES

CAPITAL STRUCTURE

                                43
CAPITAL STRUCTURE – EUR 6.5 BN DEBT SECURED AT INVESTMENT GRADE TERMS

       Effective March 30, we established a single capital structure for JDE Peet’s at attractive terms
                                      New credit agreements signed for EUR 6.5 bn
                  New

         RCF             EUR 1.5 bn    Mar 26 + 2y    • Holistic capital structure without structural subordination

                  New
                                                      • No financial covenants
      TERM LOAN          EUR 1.0 bn      Mar 25
                                                      • Investment grade documentation
                  New
                                                      • Investment grade margins
      TERM LOAN          EUR 0.3 bn      Mar 23
                                                      • Strengthened and refocused relationship bank group
               Amended

      TERM LOAN          EUR 3.7 bn      Nov 23       • Financial flexibility and access to the bond market

         An oversubscribed book of EUR 11 bn+ as a testament of our strong business and credit profile

                                                                                                                      44
THE NEW FINANCING IMPROVES OUR DEBT STRUCTURE AND LIQUIDITY PROFILE

                 EUR 6.0 bn – Debt Maturity Profile – 31 Dec 2020                                       EUR 6.5 bn – Debt Maturity Profile – 31 Mar 2021
     in EUR bn
                                   0.5
    AVERAGE                                                                                                                                                           *
                                                                                                                     0.3
    COST OF
      DEBT
                                                                         2.4%                                                                                   1.8%
                                   4.0
                                                                                                                     3.7

                                                                                                                                                                     1.5
                                                            1.0                                                                         1.0

                     0.5

       2021         2022         2023        2024         2025    2026   2027   2028            2021       2022     2023     2024      2025      2026         2027   2028

  New financing provides a permanent capital structure with additional liquidity of EUR 0.5 bn (EUR 1.6 bn pro forma
  Dec 20) and bond market access
 * Pro forma FY20 average cost of debt at new financing terms

                           RCF        TERM LOAN WITH NON-RELATIONSHIP LENDERS   TERM LOAN WITH RELATIONSHIP BANKS    TERM LOAN WITH CORE RELATIONSHIP BANKS                 45
OUR ESG STRATEGY HAS BEEN INCORPORATED INTO OUR NEW BANK FACILITIES

                  EUR 2.5 bn of our new facilities are linked to our Sustainability Ambitions
 We have agreed with our core banks on a framework and KPIs that link the pricing of our RCF and 2025 Term Loan to
                                         our journey towards our 2025 ESG goals.

                                  COMMON GROUNDS                       MINIMISED FOOTPRINT
                               Responsible sourcing of coffee &     Recyclable, compostable or reusable
                                           palm oil                               packaging

                                Smallholder farmers reached                GHG emissions/SBTI
                                                                                                                     46
You can also read