HEADLINE EVIDENCE BASE FOR CORNWALL AND ISLES OF SCILLY - EU INVESTMENT STRATEGY - EUROPE 2020 - CIOS LEP
←
→
Page content transcription
If your browser does not render page correctly, please read the page content below
EU investment strategy
Headline evidence base for
Cornwall and Isles of Scilly

                GVA per capita
                £13,848
Europe          (UK £20,873)
2020

                                 Research and
                                 development
             Target of 34%       spend 0.19% of
             reduction in        GDP (UK 1.85%)
             green house
             gas emissions
Contents Introduction................................................................................................................. 3 Europe 2020.................................................................................................................. 3 Economy........................................................................................................................ 4 Enterprise and innovation....................................................................................... 5 Employment and economic activity levels....................................................... 7 Social inclusion............................................................................................................ 8 Skills................................................................................................................................. 9 Environment................................................................................................................. 9 Strengths, weaknesses, opportunities and threats analysis...................... 10 2 EU investment strategy
Introduction                                                       Europe 2020
Cornwall and Isles of Scilly has a GDP which stands at             The Europe 2020 strategy provides a number of high
64% of the European average (2011 figures). Despite an             level indicators and targets for measuring overall
improvement in GDP prior to the recession (this figure             progress against the themes of smart, sustainable and
stood at over 78% in 2006), GDP has now dropped                    inclusive growth. Although these indicators and targets
significantly and it is clear that weaknesses remain               will not necessarily be used within the local context for
within the economy. Addressing these are a priority for            the next Programme, a review of Cornwall and Isles of
local partners and stakeholders. Highlighted below are             Scilly (C&IoS) current position helps to set the broader
the main economic characteristics demonstrating that               context for the Common Strategic Framework Funds.
economic growth and prosperity has been stimulated,                The analysis demonstrates that key issues are as follows:
but that key challenges remain.                                    low level of R&D expenditure, higher level of early
                                                                   school leavers, lower levels of people with a tertiary
                                                                   education and people at risk of poverty.

EU2020 Headline Targets with UK and Cornwall and Isles of Scilly position

                                              Europe                        Current         C&IoS          C&IoS
                                              2020                          UK              target         current
              Headline Indicators             Target        UK target       position        (2020)         position
              Raising combined public and     3% of GDP     No target       1.77% (2011)    No target      0.19% (2009)
Smart

              private investment levels in                  set
              R&D

              Reduction in Greenhouse         20%           34%             reduction of    34%            4.53m
Sustainable

              gas emissions (index year       reduction     reduction       25% (2009)      reduction      tonnes
              1990)                           on 1990                       23% (2010)      (down to       (2009) -
                                                                                            3m tonnes)     baseline
              Share of renewable energy       20% share     15% share       2.9% (2009)     15% share      5.4% share
              sources as % of gross energy                                  3.2% (2010)     (390 MW)       255 MW
              consumption                                                   3.8% (2011)                    (2013)*
              Improve Energy efficiency       By 20%        No target       7.9% (2011)     No target      --
              (index year 2005)                             set
              % of population aged 20-64      75%           No target       73.6% (2011)    No target      72.5%
Inclusive

              in employment                                 set
              Proportion 18-24 with lower     < 10%         No target       15% (2011)      No target      15.7%
              secondary education or                        set             13.5% (2012)
              lower and not attending FE
              or training
              Increasing share of 30-34       40%           None set        45.8% (2011)    No target      33.2%
              year olds with tertiary/                                      46.8% (2012)                   (average
              equivalent education                                                                         2007-10)
              20 million people out of        20mln         < 10%           21.1% (2010     No target      18.5%
              the risk of poverty or social   out of risk   children in     England)                       (16,460) but
              exclusion - Relative low        (23% to       workless                                       nb. Ranges
              income: proportion children     19%)          households                                     2.5% to 53%
              in workless households                        with
GDP - per capita trends
1. Population %
140
Now 120
UK
C&IoS population has continued to grow and now
stands at 534,500 people (2011). 100
Cornwall and
IoS
Trend 80
This growth continues to be largely driven by in- 60
migration – which is dominated by people of middle
to older working age. An emerging trend is in relation 40
to young people with a steady increase in the number
of young people aged 15 to 24 years moving into the 20
area from 2001 to 2011. Also, a decrease in the number
0
of young people aged 15-19 years leaving Cornwall over 1999 2000 2001 2002 2003 2004 2005 2006 2007 2008 2009
the same period. Of note is that the number of people
graduating in Cornwall has increased almost fourfold in
the last ten years (2,944 people in 2012 compared to 798 So what?
in 2002). This would indicate that investment in higher It is C&IoS GDP that makes it a ‘Less Developed Area’
education has had an impact upon migration patterns. within the European context (that is, having a GDP
of less than 75% of the EU average). Productivity is
regarded as the key to higher output and earnings.
So what? To change C&IoS output and earnings we need to
This is increasing the number of economically active
increase productivity. The Local Enterprise Partnership
people in the medium term, but is a trend that will
Economic Strategy states that this should not happen
impact upon the future number of older (generally
at the cost of the environment. Addressing low levels of
economic inactive) people. C&IoS has an ageing
productivity is a key aim of European Structural Funds.
population, in line with the national trends, but more
marked in terms of percentages of the total population.
C&IoS already has a larger percentage of its population 3. Gross Value Added
aged 65 years and older.
Now
Economy C&IoS total Gross Value Added (GVA) stood at £7.5bn in
2011. GVA is the value of the goods or services as they
leave a sector or area, minus the cost of inputs used to
2. Gross Domestic Product produce them.
GVA on a per capita basis is £13,848: lower than the UK
Now £20,873 (2011)1. In 2011 C&IoS stood at 66.3% of the UK
GDP is the market value of all final goods and services average. This is the second lowest figure for all NUTS
produced within a geographical area within a given 2 regions in the UK (with West Wales and the Valleys
period of time. In relation to each person employed, being lower at 65%).
GDP is 16,200 per annum per capita. This per capita
figure is 64% of the EU average (and 61% of the UK
average). Based upon 2011, data.
Trend
Total GVA was rising between 2004 to 2008 at which
point it peaked. However, the GVA progress achieved
Trend between 2004-08 did not significantly close the gap
From 1999 up to 2003 the GDP per capita figure between C&IoS and other areas. Since 2008 GVA has
increased as a percentage of the EU average and then started to decline with a larger decrease than at a
plateaued until 2006. Since then the figure has been in national level.
decline.
So what?
C&IoS are still marked by a low GVA compared to the
rest of the UK demonstrating that the local economy
generates less added value per head than other
areas and is less productive – a clear weakness in the
economy. Addressing total GVA and GVA per capita is a
LEP priority.
4 EU investment strategy% Cornwall and Isles of Scilly as % of UK
67
66
65
64
63
62
61
60
59
58
57
99
00
01
02
03
04
05
06
07
08
09
10
3
11
19
20
20
20
20
20
20
20
20
20
20
20
20
4. GVA by Sector
Now
The main sectors contributing to C&IoS GVA in 2010 So what?
were Wholesale and retail (14.4%), Real estate (10.4%), C&IoS have some significant sectors in terms of size
Manufacturing (10%), Health (9.9%), and Construction of GVA contribution and employment, referred to
(8.4%). However, looking at the size of sectors only in as ‘bedrock industries’ within the LEP Strategy (for
relation to GVA does not provide a complete picture of example agriculture and tourism). Other sectors have
productivity and also the number of people employed. demonstrated a growth in GVA (food and drink and air
A review of this broad range of data is shown below. transport). Activities that can impact upon a wide range
of sectors are supporting innovation and Research and
Trend Development.
A more detailed analysis of change in sectors using
employment, GVA and productivity data:
Large (over £100m GVA in 2009) but Growing
not dynamic Retail distribution [Large £623m] - GVA and
Agriculture [Large £165m] – relative decline in employment growth and rising productivity.
contribution to GVA, static employment but rising Food and drink manufacturing [Large £239m] – GVA
productivity and employment growth and rising productivity.
Construction [Large £387m] – GVA and Air transport [Small £16m] - GVA and employment
employment growth but falling productivity growth and rising productivity.
Public administration and defence [Large £402m] Finance [Large £274m] - GVA and employment growth
- GVA growth, falling employment and productivity and rising productivity.
Social work activities [Large £248m] - GVA and
employment growth and rising productivity.
Growing but declining productivity Declining
Business services [Large £1,514m] - GVA and Fishing [small £10m) - relative decline in contribution
employment growth but falling productivity (largest to GVA, static employment but rising productivity.
elements being ‘Owning and dealing in real estate’
Other mining and quarrying [Small £25m] – declining
and ‘Letting of dwellings’
GVA, employment and productivity.
Hotels and catering [Large £445m] - GVA and
Motor distribution and repair and fuel retail [Small
employment growth but falling productivity.
£77m] – declining GVA, employment and productivity.
Headline evidence base for Cornwall and Isles of Scilly 5Enterprise and innovation So what?
Lower start ups than closures result in a decline in the
total number of businesses. High levels of business
5. Business numbers start ups can indicate a vibrant dynamic economy.
However, an excess of closures may simply reflect the
Now impact of the recession.
In 2012 there were 21,105 registered enterprises in
C&IoS. Also in this year there were a total of 27,785
7. Self Employment
business units.
An Enterprise is the smallest combination of legal units Now
under common ownership. It may consist of one or C&IoS have a high percentage of its workforce who
more local units. are self-employed: 20.7% of 16-64 year olds (average
A business unit is a separate site where economic 50,100 people 2012/13). This compares to a figure of
activity takes place. A unit may be an enterprise in its 13.5% for the UK. The proportion of self employed is
own right or part of an enterprise. 1.5 times higher than the UK average.
Trend Trend
Enterprise numbers dropped back from 2008 to 2010 Self-employment levels were stable between 2004
since then they have been static. In contrast the number and 2007 at around 17% and then rose above 20%.
of local units after falling from the 2008 level have Four out of five of the last data sets have shown figures
started to rise. It should be noted that Enterprise data over 22%.
excludes the self-employed sector which is a significant
element of the business sector in Cornwall. So what
Self employment levels are often seen as a proxy
No's Enterprises and units indicator for levels of entrepreneurship and therefore
29000 a factor to consider in the wider ‘innovation’ context.
28000 Self employment is higher within C&IoS than in the UK
27000
perhaps indicating ‘potential’. However, in the local
26000
context it can also be considered as the only option for
25000
employment.
24000
23000
22000 8. Business Size
21000
20000
2008 2009 2010 2011 2012 Now
Year
99.8% of the 21,105 enterprises in C&IoS in 2012 are
Local units Enterprises classified as small and medium sized enterprises
(88.6% are micro enterprises, 10% are small enterprises
So what? and 1.2% medium enterprises).
Enterprise numbers can indicate how the economy is
performing (although other factors such as the number Trend
of people employed should also be considered). This high percentage of SMEs is similar to the national
trend. However of note is that C&IoS has a lower
6. Business start up and closures proportion of larger businesses than the GB average.
And a lower proportion of employees in larger
businesses.
Now
In 2011 there were 1,715 start ups and 1,835 closures
resulting in a decline in the number of enterprises. So what?
This presents the continuing challenge of ensuring
priorities and actions identified to support businesses
Trend are particularly relevant and accessible to SMEs. As the
Business closures have exceeded start ups for the last
dominant size of firm, a ‘small improvement in their
three years.
productivity could have a significant effect on the
economy’’.
6 EU investment strategy9. Research and Development spend So what?
Knowledge intensive employment is considered
Now to play an important role in the general economy.
In 2009 R&D spend in C&IoS was 0.19% of GDP. The UK Whilst the traditional inputs of labour, land and
R&D spend is 1.85% of GDP. C&IoS spends the lowest capital remain important, the ability to create, use and
percentage of its GDP on R&D when compared to all share knowledge has emerged as the major driver of
other UK NUTS2 regions. economic growth and wealth creation over the past ten
years. The proportion of those employed is indicative of
an economy’s capacity and potential for innovation and
Trend growth.
Since 2006 the percentage R&D spend has been static.
So what? Employment and economic
Spend on R&D can be considered as an indication of activity levels
the ability of an economy to invest in research for future
growth. This is linked to our large SME base, with a high
proportion of smaller companies which do not have 11. Economic Activity
the finances to invest in R&D. Market failure in this area
requires intervention to overcome the issues. Now
Economic activity levels in C&IoS stands at 71.6%
10. Knowledge intensive industries compared to the UK average of 76.6% showing that
economic activity rates are slightly below the UK
employment average.
Now Trend
Latest estimates for 2011 show that 43.2% of employees The current position shows the widest gap between
were employed in knowledge intensive employment. C&IoS and the UK over the period 2004-11.
The comparative figure for Great Britain is 53.7%. Of the
36 NUTS 2 regions in Great Britain C&IoS lies just above % Economic activity rate (3 year MA)
the bottom region – Cumbria. 80
75
Trend
The proportion of people employed in knowledge 70
intensive industries has changed little between 2008
65
and 2011. In contrast the proportion in the UK increased
slightly. 60
% Knowledge intensive employment 55
56
50
54
4
6
8
09
05
07
10
11
0
0
0
20
20
20
20
20
20
20
20
52
Period
50 UK Cornwall and IoS
48
46
44
So what?
42
Economic activity rates are an indication of the
40
2008 2009 2010 2011
proportion of the working age group who are in the
Year workforce – whether as workers or unemployed. Below
Cornwall and IoS GB average rates may indicate an under utilisation of the
potential labour force. Increasing economic activity
rates, and then employment rates, is one way of
increasing economic output.
Headline evidence base for Cornwall and Isles of Scilly 712. Employee earnings % Economic inactivity rates
29
Now 28
27
In 2012, median gross annual earnings for all employees
26
in C&IoS equalled £17,389, 81% of the UK average
(£21,473). 25
24
• Median gross annual earnings for full-time
23
employees were £20,908, equal to 79% of the UK
22
average
21
• Median gross annual earnings of part-time 20
employees were £8,853, equal to 103% of the UK
4
6
8
09
05
07
10
11
0
0
0
20
20
20
20
20
20
20
20
average (£8,599). UK Cornwall and IoS
Trend So what?
A 3 year moving average indicates an upward trend In general a lower level of economic inactivity indicates
in all earning categories relative to the UK average a bigger workforce base in an area. Changes in the
(full/part time, male/female). Overall, between 2000 levels of economic inactivity can reflect a number of
and 2011 all earnings rose by 8%, and full-time by 4%. factors – retirement, sickness etc. Economic inactivity
However the upward move was concentrated from 1999 can be associated with social exclusion and is a key issue
to 2007 with the situation remaining static after that. within Europe 2020.
% Earnings as a % of UK 14. Unemployment
110
105
100 Now
95 The current unemployment figure is 13,700: a rate
90
85
of 5.7%. This is below the UK rate of 8.1%. The latest
80 Jobseekers allowance benefit claim rates (JSA) for April
75 2013 show 8,963 claimants; a rate of 2.7% of the working
70
age population. The UK figure is 3.8%.
65
60
1999 2000 2001 2002 2003 2004 2005 2006 2007 2008 2009 2010 2011 2012
Trend
The unemployment rate since 2004 has tended to be
Total Full Time Part Time
either below or close to the UK average. It briefly rose
above the UK level in 2010/11 but has since fallen back.
Since November 2012 there has been an improvement
So what? in the number of JSA claimants with numbers
Lower than average earnings reflect lower productivity
consistently falling compared to the same period in the
levels and also contribute to low demand in an area.
previous year. However, overall numbers are still higher
C&IoS still lags behind the UK in relation to earnings.
than the 2007 figure of 5,285.
13. Economically inactive % Unemployment rates
10
9
Now 8
27.2% of people aged 16-64 are economically inactive 7
this equates to 89,800 people. This is higher than the UK 6
figure of 23%. 5
4
3
Trend 2
Economic inactivity rates have tended to be higher than 1
the UK average apart from a period in 2010 when they 0
were similar. Since 2011 there has been an increase in
04
05
06
07
08
09
10
11
20
20
20
20
20
20
20
20
economic inactivity rates. Period
Cornwall UK
8 EU investment strategySo what? lower than the UK average (37%).
Generally unemployment rates have been lower than The number of people with ‘no qualifications’ has
the national average over a significant period. This decreased from 8.5% (2008) to 6.2% (2011). This is lower
demonstrates that C&IoS fairs relatively well, with than the UK figure (6.9%).
economic inactivity rates being the main issue (see
above). JSA figures have improved, however these only
tell a partial story as they do not cover all those people So what?
who are unemployed. The recent improvement is Our skills profile is important as it forms a building
positive but levels are still high compared to the pre- block not only for overall economic growth, but also
recession figures. for individuals. Skills are an important consideration
within the arena of social inclusion, providing access
to employment, personal advancement, increased
Social inclusion earnings and, for some, a route out of worklessness.
Progress has been made but we still lag behind in some
areas.
15. Young people not in education,
employment or training (NEET)
Environment
Now
Local data shows that the proportion of young people 17. Reduction in Greenhouse gas
NEET in Cornwall is 5%. This is relatively low compared emissions
to the South West average (5.7%).
Now
Trend C&IoS have set a target of 34% reduction in GHG
The average annual figures for Cornwall from 2004/05 emission between 2009 to 2020. The actual reduction in
to 2011/12 show that the proportion of young people GHG emissions are to be reported this year 2013 (Green
NEET has fluctuated during this 7 year period but has Cornwall).
shown a downward trend from 2008/09.
So what?
So what? The reduction of Greenhouse Gas emissions is a
Being NEET at a young age ‘is a major predictor of headline target and focus of the Europe 2020 strategy
unemployment, low income, poor mental health and and a key partnership aim within C&IoS.
physical health and associated problems later in life,
especially for those who are NEET for extended periods
of time or who repeatedly re-enter the NEET group. This 18. Share of renewable energy sources
will affect individual life chances and also impact within as a percentage of gross energy
the wider economy.’ consumption
Skills Now
In 2009 C&IoS produced 90 MW of energy from
renewables. The Green Cornwall Strategy aims to
16. Post 16 qualifications achieve a 15% share by 2020 (or 390MW). Progress
against this target is to be reported this year (2013)
Now (Green Cornwall).
C&IoS have a lower percentage of its economically
active population holding specific types of
Trend
qualifications:
A significant number of renewable energy projects have
• NVQ4+ 34.2% compared to 38.5% (UK)
been initiated within recent years which would suggest
• No qualifications 4.4% compared to 6.2% (UK)
positive progress against this target.
Trend So what?
Progress has been made on increasing skills.
This is a headline Europe2020 target and links to a
For example, the percentage of people who are
number of themes including business growth, research
economically active with higher level skills (NVQ4+) has
and innovation and the natural environment.
shown an increase over the last 4 years (28% to 34%).
However, the challenge remains that this is figure is still
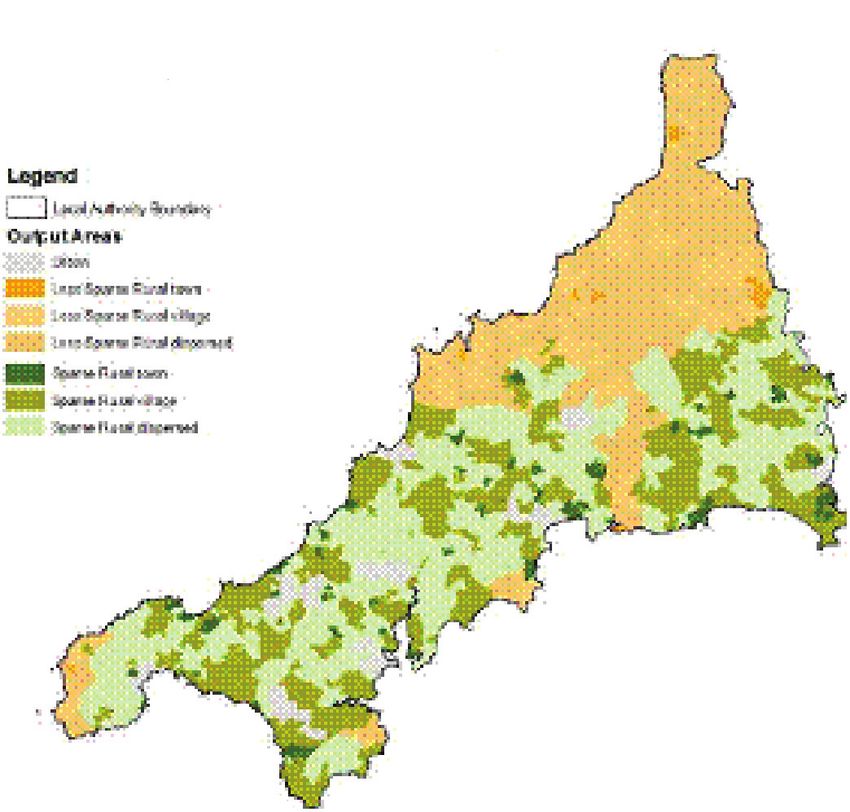
Headline evidence base for Cornwall and Isles of Scilly 919. Infrastructure Now
Cornwall has 86% of its population classified as rural,
Peripherality and physical distance from markets
the Isles of Scilly 100%. This classification is taken from
remains a constraint for C&IoS. A review of infrastructure
the DEFRA local authority rural-urban classification
provision and data highlights the following:
system. It results in an overall label of RU80 (Rural 80)
• a number of gaps in the strategic transport network for C&IoS. This means that at least 80% of the total
(congestion points in the road network acting as a population live in rural settlements or larger market
block on the development of employment space towns. By comparison, 33% of the total population in
and economic growth) and access for Isles of Scilly the South West live in predominantly rural areas and
residents and businesses to the mainland 19% in England (2010).
• 71% superfast broadband /other solution coverage The number of business units located in rural areas is
of Cornwall (March 2013: 180,000 premises, 21,000 significantly higher than in urban areas. The rural/urban
live connections including an estimated 2,500 ratio in Cornwall is 2:1; Isles of Scilly 1:0; South West 1:1;
businesses connected). The target for coverage has and England 1:3. A higher ratio of businesses based in
recently been increased from 86% to 95% across rural areas than urban areas demonstrates our reliance
C&IoS. Recent agreement has been secured to on the rural economy and highlights the micro and SME
enable connection IoS connection business base of our predominantly rural area (note: the
• Further development of Newquay Airport and its environment has long been identified as an economic
designation as an Enterprise Zone driver: business base connection to, and reliance on, the
natural environment)
• Increase in workspace to address a shortfall in
provision and issues of poor quality stock (including GVA for the agriculture and forestry sector stands at
bespoke and speculative) and three Innovation 2.5% significantly higher than for GB (0.6%). However,
Centres and other R&D facilities. as noted productivity is low. Our very rural area with a
high reliance on the agri food sector is a key factor at
play. Relating specifically to the rural economy, analysis
20. Rurality of local data for the agri-food sector indicates that
productivity per full time equivalent is an issue standing
Cornwall and Isles of Scilly LEP, shaded at between 51% and 68% of the C&IoS average.
by Output Area according to the urban/ The agricultural sector – in particular – is subject
rural definition to a number of external factors that will influence
Legend performance and productivity: global food prices,
Local Authority Boundary fuel prices and logistic/distribution costs. Production
Output areas methods have a direct impact on land and landscape
Urban
Less Sparse Rural town setting; environment is recognised as a key economic
Less Sparse Rural village
Less Sparse Rural dispersed driver.
Sparse Rural town
Sparse Rural Village C&IoS has a high percentage of population living in rural
Sparse Rural dispersed
areas and lower than average employee earnings. Low
earnings in turn impact upon household incomes (18%
of households with an income of £10-£15k compared to
11% in the UK and 15% over £40k compared to 29% in
the UK).
Cost of living is higher in C&IoS is higher than the
national average for a number of expenditures,
including water and sewerage charges, costs of energy
and transport fuels, and mortgages. The ‘living wage’
© DEFRA 2012
(pay needed to provide an adequate standard of living)
is £7.45 per hour – it is estimated that around 20% of the
working age population earn less than the living wage
in Cornwall.
10 EU investment strategySo what? Low productivity levels and wages are clearly evident
Our rural and dispersed population gives rise to in our predominantly rural area and need to be
issues of access to services and demonstrates the addressed; in particular in relation to the significant
importance of the functional linkages between rural agri food sector. Developing the agri food supply chain
areas and market and administrative centres. There is can positively impact upon many aspects of the rural
a need for communities to become more sustainable economy. A focus upon training and skills can support
in terms of housing, employment and services career development and skills transferability across
supporting each other. sectors. Improving competitiveness and productivity
of our rural micro and SME business base will support
higher wages and generate additional local spend.
Strengths, weaknesses, opportunities and threats analysis
The following table provides an overview of the headline evidence base (prepared March 2013):
Strengths Weaknesses
Improvements in our HE/FE infrastructure: improved Peripherality and distance from markets contributing
facilities, breadth of courses, increased student and to low GDP and GVA
increasing research capacity within world class research
groups
A strong brand with national and some international Low levels of R&D investment, innovation and
recognition competitiveness contributing to low earnings (81% of
UK average)
Vigorous third sector facilitating innovative delivery
Vibrant creative sector which can drive innovation Overall levels of low productivity and seasonality
including significant ‘bedrock’ sectors such as tourism
Unique natural resources with significant energy Continued low earnings, high benefit
production potential
dependencies and continued concentrations of
deprivation and rural dispersed deprivation
Long history of collaborative partnership working Skills levels that are still below the national average
(basic and higher level)
One the best digitally connected rural areas in the Lack of regulatory framework for renewable energy
world project development (geothermal/local energy
markets
High levels of self employment and business survival
rates
Emerging clusters in key high value sectors (marine/
aerospace)
Headline evidence base for Cornwall and Isles of Scilly 11Opportunities Threats
Capitalise upon FE and HE infrastructure to increase Failure to address bottlenecks in strategic infrastructure
R&D, innovation and create the conditions for growth that will then ‘block’ further development to support
economic growth and reduce resilience
Emerging markets and sectors (e-health/renewables/ Failure to address low levels of research and
agri-tech) leading to opportunities to increase innovation could lead to a further decline in relative
productivity and shape the future economy competitiveness
Failure to address climate change impacting on
resilience
Exploit our existing competitive advantage in relation Failure to grasp our status as ‘early adopter’ of superfast
to superfast broadband to facilitate growth for broadband
business by improving content and access to markets
Abundant environmental assets to increase Failure to address the productivity of bedrock
productivity and growth in key low carbon sectors industries compounding overall economic
where we have nationally significant energy performance
production capacity to capture value in the future
economy and drive growth for business in the agri-
food sector with enhanced manufacturing and supply Continuing barriers to finance for SMEs
chain development.
Large numbers of agile SMEs and impressive business Lack of flexibility and join up in national approaches
survival rates create potential for accelerated growth leading to sub optimal outcomes.
for business if appropriate and bespoke support
(finance/export/start up) can be delivered.
Existing physical assets and social capital which have Inability to exploit our natural resources for renewable
the potential to grow further (Innovation Centres energy due to constrained grid capacity
Aerohub/Wavehub) with further infrastructure
investments to enhance conditions for growth
Potential to develop replicable pilot/research projects
to lead the UK/EU future economy (smart energy
infrastructure)
12 EU investment strategyData sources Endnotes
1. Population: Census 2011 1 GVA figure is calculated ‘less Extra Regio’
2. GDP: Eurostat 2012 2 The number of VAT and/or PAYE registered enterprises,
3. GVA: ONS, Regional, Sub-regional and Local ONS
Gross Value Added 2011 3 Definitions: micro enterprise: less than 10 employees,
small enterprise: 10-49 employees, medium enterprise:
4. GVA by sector: ibid
50-249 employees
5. Business Numbers: ONS, UK Business: Activity, 4 Source: Office of the Northern Ireland Adviser on
size and location, 2012 Employment and Skills (2010) Improved Engagement of
6. Business births and deaths: ONS, UK Business SMEs in the Employment and Skills Arena
Demography, 2011 5 Children’s Trust Cornwall, Focus Paper: Young People NEET
7. Self employment: NOMIS, Annual Population (October 2012)
Survey, 2013
8. Business Size: ONS, UK Business: Activity, size
and location, 2012
9. R&D spend: Eurostat, 2012
10. Knowledge Intensive employment: Business
Register and Employment Survey, 2011
11. Economic Activity: Annual Population Survey
2004-11
12. Employee Earnings: Annual Survey of Hours and
Earnings, 2012
13. Economically Inactive: Annual Population
Survey, 2000-2012
14. Unemployment: Annual Population Survey,
2004-2012, Job Seekers Allowance Claimant
figures, NOMIS, 2007-13
15. NEETs: Children’s Trust Cornwall, Focus Paper,
October 2012
16. Post 16 qualifications: Annual Population
Survey, 2012
17. GHG emissions: targets in Green Cornwall
Strategy 2011
18. Share of renewables: targets in Green Cornwall
Strategy 2011
19. Infrastructure: Broadband data: Superfast
Cornwall Project, March 2013
Headline evidence base for Cornwall and Isles of Scilly 13Economic Development and Culture If you would like this information in another format or
Chief Executives Directorate language please contact:
Cornwall Council,
Cornwall Council, County Hall, Treyew Road, Truro TR1 3AY
Carrick House,
Truro TR1 1EB Telephone: 0300 1234 100
economicdevelopment@cornwall.gov.uk Email: enquiries@cornwall.gov.uk www.cornwall.gov.uk
www.cornwall.gov.uk/economicdevelopment
May 2014 Jn34208You can also read