Economic Bulletin - Issue 2 - August 2020 - Staffordshire ...
←
→
Page content transcription
If your browser does not render page correctly, please read the page content below
Economic Bulletin - Issue 2 – August 2020
Welcome to the second edition of the new Staffordshire & Stoke-on-Trent Economic Bulletin
produced by our Economy, Skills and Insight Teams, which provides the timeliest secondary
data available on what is happening with the local economy. However, this clearly only
provides part of the picture and over the coming months we intend to build up our softer
intelligence to provide a better indication of what is happening on the ground, including the
local response to the COVID-19 crisis.

Alongside information on the Claimant Count and Job Vacancies that will be a part of every
Bulletin, we again look at the Coronavirus Job Retention Scheme (CJRS) Furloughed Workers
and Self-Employment Income Support Scheme (SEISS) to assess how these schemes are
being used in Staffordshire & Stoke-on-Trent. This month’s issue also provides ward level
analysis of the claimant count helping to identify areas which have been impacted the
hardest across Staffordshire & Stoke-on-Trent and where there may be a greater need for
support. We also provide analysis of how local businesses are making use of the Coronavirus
Business Interruption Loan Scheme (CBILS) and the Bounce Back Loan Scheme (BBLS).

We hope you find the Bulletin useful and welcome your comments and suggestions on
further information you would like to see included in future editions. If you do have any
feedback please send your comments to Darren Farmer, Economy & Skills Analyst at
darren.farmer@staffordshire.gov.uk.

Stay Safe,
Darryl Eyers
Director for Economy, Infrastructure and Skills, Staffordshire County Council
Key Messages

•     The number of people on some form of government economic support scheme is
      currently largely on a par with the rest of the country (36%).

•     The claimant count in Staffordshire saw a slight rise of 705 between June 2020 and July
      2020 to a total of 26,465 claimants and a rate change from 4.8% to 4.9% of the working
      age population - however, not all will be out of work. Whilst there has been some
      announcements of potential redundancies, due to the move to Universal Credit
      claimant count figures now also include those that have had a lower income through
      COVID-19, including furloughed staff and part time employees, short-term layoffs and
      the self-employed who have paused or ceased operating.

•     The claimant count rate is still relatively low in Staffordshire (4.9%) compared to
      regionally (7.3%) and nationally (6.5%). However, it is young people, the lowest paid
      (including those in manual occupations, more routine or less skilled jobs) and part-time
      workers who continue to feel the impact of the economic shock the most. It remains
      vital that these groups are supported to help prevent them becoming long-term
      unemployed.

•     Although unemployment and those claiming benefits has not surged further over more
      recent months this is largely due to the considerable number of workers which remain
      on the Government-backed furlough scheme. However, there is concern that over
      coming months as the furlough scheme winds down and already announced potential
      job cuts become a reality there are likely to be more people that find themselves out
      of work.

•     The latest Coronavirus Job Retention Scheme (CJRS) and Self-Employment Income
      Support Scheme (SEISS) figures for July show that there was an increase of 6,900
      furloughed workers in Staffordshire compared to June and a 2,000 increase in Stoke-
      on-Trent, although the pace of increases appears to be slowing. SEISS claims increased
      by 500 in Staffordshire between June 2020 and July 2020 and by 100 in Stoke-on-Trent,
      again far smaller increases than those experienced between May and June although
      this is likely to be due to the design of the scheme with the second tranche only
      opening on 17th August.

Staffordshire & Stoke-on-Trent Economic Bulletin – August 2020                  Page | 2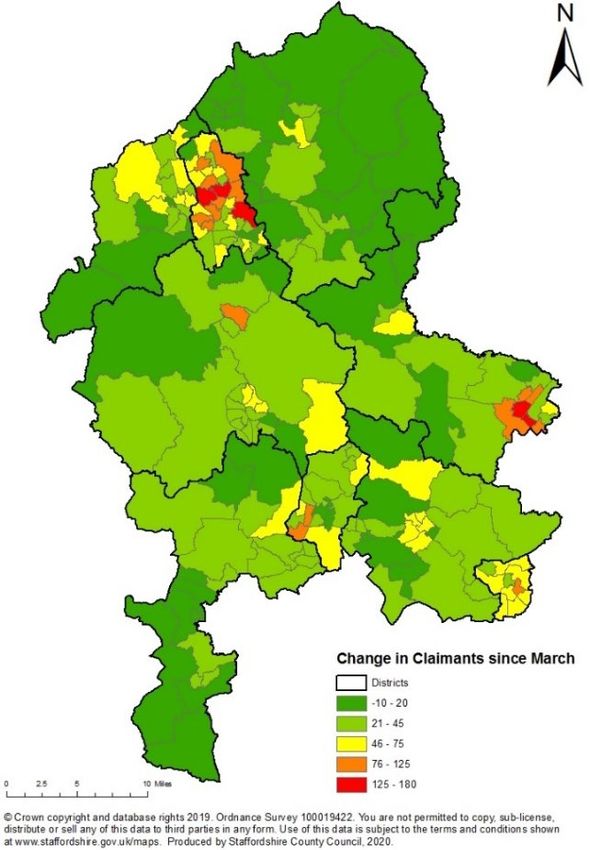
•     Across the country the number of job vacancies has also decreased since the crisis
      began and still remain well below levels seen a year earlier, although there are signs
      that the job market is starting to pick back up. We continue to see demand for roles in
      health, social care and distribution with clear emerging opportunities for job creation
      in digital, construction and the green economy.

•     In conclusion, it is apparent that as we move out of lockdown and Government support
      is wound down there are more businesses finding the need to restructure their
      operations and unfortunately in some cases this means making staff redundant.
      However, it is also clear that as we continue to work together to drive local economic
      recovery more jobs are being saved in high-risk sectors and there are new
      opportunities being created in new roles and new sectors of the economy.

•     Our main focus now continues to be on working together to ensure that as many
      people as possible currently on furlough return to work and for those residents
      unfortunate enough to have lost their jobs support them back into work as we build a
      stronger local economy.

•     Fundamental to this is the work of the Countywide Redundancy Task Group where
      more than 20 local partners are working together to support businesses and employees
      with potential redundancies. Alongside this the Redundancy and Recruitment Triage
      Service will have an important role in helping residents gain new skills and
      employment.

•     Alongside this important work the County Council and our local partners have made
      numerous interventions over the last few months to support our residents and
      businesses including:

      o     South Staffordshire Council have taken a proactive approach to business
            engagement during the pandemic. The team have worked on a one council
            approach to helping the high streets get back to business using their ‘locality
            enablers’ with different specialisms from different teams of the Council to come
            together to engage with businesses to support their reopening plans. Engaging
            District Councillors, Parish Councillors and businesses in the recovery approach
            on the high street has forged relationships to ensure that the village centres in
            the District access the support they need. The team have also recognised the
            issues that the high street businesses were facing and have run bespoke webinars
            for business as well as offering virtual support clinics to businesses on our
            industrial estates. In the future the Council will be offering a virtual business
            support team approach so that there is a one stop shop approach for businesses
            when they need contact with the Council services.

Staffordshire & Stoke-on-Trent Economic Bulletin – August 2020                  Page | 3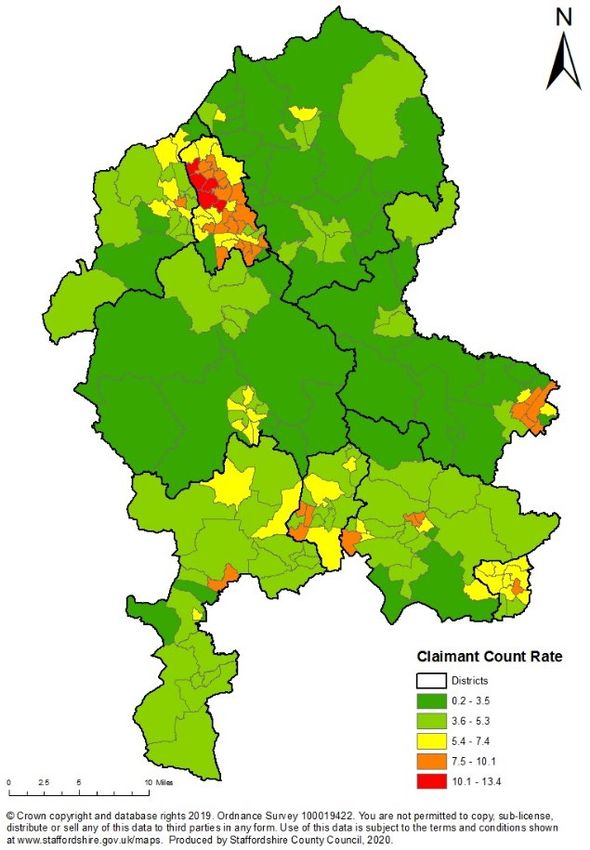
o     Around 1,800 packs of Personal Protective Equipment (PPE) have been given away
            to businesses through the PPE Start-Back Scheme to support them in operating
            under Covid-Secure guidelines, whilst also offering advice on how to use PPE and
            where to buy safe, cost-effective PPE from trusted suppliers.

      o     Over 50 people have already signed-up for the Staffordshire start-up support
            scheme.

      o     Additional funding to support the recovery of the businesses within the tourism
            sector and Small & Medium Enterprises more broadly has recently been
            announced, with schemes to go live through the Growth Hub next month.

Staffordshire & Stoke-on-Trent Economic Bulletin – August 2020                 Page | 4
Local Picture – Residents on Government Support Schemes
During this period it is important to be able to understand how local businesses are
responding to the gradual reopening of the economy and what impact COVID-19 has had
and continues to have on jobs. A key aspect of this is monitoring the number of people
claiming Universal Credit (Claimant Count), and the number of people on the Coronavirus
Job Retention (CJRS) and Self-Employment Income Support Schemes (SEISS), as seen
below.

Overall Number of Residents on Government Support Schemes

In line with the Claimant Count rate which shows the proportion of the working age
population claiming Universal Credit we have calculated the proportion of the working age
population which may be on the furloughed or have accessed SEISS support.

In total there are potentially just over 252,000 residents in the SSLEP area on Government
support, equivalent to around 36% of the working age population which is similar to
regional and national averages. Tamworth (42%) and Cannock Chase (40%) have the
highest rates while Newcastle-under-Lyme and Stafford (both 32%) have the lowest.

 SSLEP Working Age Population                                                                                694,954
 Jobs in High Risk Sectors                                                                                   221,000
 Claimant Count July 2020                                                                                     39,440
 Coronavirus Job Retention Scheme (CJRS) Furloughed job claims up to 31st July                               173,800
 Self-Employment Income Support Scheme (SEISS) claims up to 31st July                                         39,000
 Potential workers on Government support                                                                     252,240
 Potential % of working age population on Government support                                                  36.3%
Note: Important to recognise that there may be some workers which are accessing more than one support scheme and there
may be some double counting due to jobs moving on and off the furlough scheme

Staffordshire & Stoke-on-Trent Economic Bulletin – August 2020                                          Page | 5
Detailed Breakdown
     Claimant Count 1
     The following table highlights the level of claimant unemployment in the Staffordshire
     Districts and each of the Strategic Authorities in the West Midlands Region:

                                 Claimant Count (Universal Credit) Statistics: July 2020

                                                                                            Monthly     Monthly     Change in     Change in
                                 Claimant       Claimant   Claimant         Number of
                                                                                           Change in   Change in    Claimants     Claimants
Area                            Count Rate     Count Rate Count Rate1        Claimants
                                                                                           Claimants   Claimants   since March   since March
                                (July 2019)   (June 2020) (July 2020)       (July 2020)
                                                                                          (Numbers)       (%)      (Numbers)         (%)

England                              2.7           6.3            6.5        2,273,600      72,985       3.3%       1,210,095      113.8%
West Midlands                        3.5           7.1            7.3         266,830       7,625        2.9%        122,480        84.8%

SSLEP                                2.4           5.5            5.7          39,440        885         2.3%        20,070        103.6%

Birmingham                          6.2            10.6          10.9         80,165        2,235        2.9%        30,795         62.4%
Wolverhampton                       5.8            10.3          10.4         17,025         280         1.7%         6,645         64.0%
Sandwell                            4.5            9.0           9.3          18,995         595         3.2%         8,215         76.2%
Walsall                             4.3            8.6           8.8          15,150         315         2.1%         6,545         76.1%
Stoke-on-Trent                      4.1            8.0           8.1          12,975        180          1.4%        5,655         77.3%
Dudley                              4.1            7.3           7.5          14,530         495         3.5%         6,015         70.6%
Coventry                            2.8            6.5           6.7          16,310         485         3.1%         8,310        103.9%
Telford and Wrekin                  2.6            6.2           6.4           7,110         190         2.7%         3,680        107.3%
Solihull                            2.7            5.7           5.9           7,475         260         3.6%         3,825        104.8%
Worcestershire                      2.1            5.2           5.4          19,120         610         3.3%        10,815        130.2%
Warwickshire                        2.0            4.8           5.0          17,490         675         4.0%         9,660        123.4%
Staffordshire                       1.8            4.8           4.9          26,465        705          2.7%        14,415        119.6%
Shropshire                          1.9            4.6           4.8           9,080         395         4.5%         5,070        126.4%
Herefordshire                       1.7            4.2           4.4           4,935         205         4.3%         2,825        133.9%

Tamworth                             2.7           5.9            6.2          2,940         120         4.3%         1,450         97.3%
Cannock Chase                        2.0           5.7            5.8          3,660          70         1.9%         2,005        121.1%
East Staffordshire                   1.9           5.4            5.4          3,915          10         0.3%         2,195        127.6%
Lichfield                            1.7           4.8            5.0          3,055         110         3.7%         1,735        131.4%
Newcastle-under-Lyme                 2.1           4.8            4.9          3,980          70         1.8%         2,000        101.0%
South Staffordshire                  1.7           4.5            4.7          3,140         140         4.7%         1,830        139.7%
Stafford                             1.5           4.2            4.4          3,590         95          2.7%         1,935        116.9%
Staffordshire Moorlands              1.4           3.6            3.8          2,185         95          4.5%         1,265        137.5%
1
    The claimant rate is the proportion of the working age population claiming benefits

     •     The Claimant Count in Staffordshire saw a slight rise of 705 between June 2020 and July
           2020 to a total of 26,465 claimants. Stoke-on-Trent also saw a small increase of 180
           over the same period with a total of 12,975 claimants in July.

     •     These slight increases in July are similar to the trend seen nationally and reflects what
           we have seen through HR1s notifications early in the crisis and some potential
           redundancies in SMEs.

    1
        Source: https://www.nomisweb.co.uk/

    Staffordshire & Stoke-on-Trent Economic Bulletin – August 2020                                                      Page | 6
• It is also important to look at the change in the Claimant Count seen since March 2020
(pre-COVID) where the number of claimants in Staffordshire has more than doubled
with an increase of 14,415 claimants and in Stoke-on-Trent there has been an increase
of 5,655.
• Ultimately, the full effect of COVID-19 on employment will not be felt until the furlough
and SEISS schemes come to an end.
• The increases in the Claimant Count also need to be viewed in the context of the move
to Universal Credit. Before Universal Credit, the Claimant Count was based upon
Jobseeker’s Allowance claimants, i.e. people out of work but looking for a job. A
proportion of claimants currently will have a job but claiming Universal Credit due to
having a low income - the reasons for the increase in claimants are still to fully emerge
but evidence suggests there will be a combination of factors such as:
o New Job Starters/PT employees/Self-employed with no income claiming Universal
Credit because they are not eligible for the CJRS;
o Self-employed ceased trading or have very low income claiming Universal Credit
(and are either not eligible for, or not yet been paid, income under the SEISS);
o Working part-time low-income workers claiming Universal Credit and may be
furloughed;
o Potential Redundancies within Small & Medium Enterprises laying off staff in the
short-term.
• Unfortunately, due to data limitations it is not currently possible to quantify the
proportion of people that fall into these cohorts at a local level.
• Given the comparatively strong position of Staffordshire going into the pandemic and
the fact that COVID-19 has impacted much of the economy during lockdown, even with
the significant increase in claimants the proportion of working age residents on such
benefits remains comparatively low in Staffordshire with a rate of 4.9% in July compared
to 7.3% regionally and 6.5% nationally. In Stoke-on-Trent the Claimant Count rate
remains above both the regional and national averages at 8.1%.
• As well as workers across sectors being impacted differently, there are also signs that it
is the lowest paid, part-time workers and young people (particularly apprentices) that
are being hardest hit. These groups are more likely to work in sectors that have shut
down or reduced activity, such as hospitality and non-essential retail. They are also less
likely to be able to work from home.
Staffordshire & Stoke-on-Trent Economic Bulletin – August 2020 Page | 7• As previously reported young people aged 18-24 are being disproportionately
impacted by unemployment where the claimant rate for young people in Staffordshire
has increased from 3.7% in March to 8.3% in July compared to a rise from 2.3% to 4.9%
for all working-age residents, while in Stoke-on-Trent the rate has risen from 5.9% in
March to 11.0% in July. This means there are now 5,510 young people claiming work
related benefits in Staffordshire and a further 2,605 in Stoke-on-Trent.
• All Staffordshire Districts have seen slight increases in the number of claimants in July,
with South Staffordshire seeing the highest increase of 140 followed by Tamworth with
120. Tamworth and Cannock Chase continue to record the highest rates in Staffordshire,
although Newcastle-under-Lyme and East Staffordshire have the largest caseloads.
However, it’s important to note all Districts remain lower than the current national and
regional rates.
Claimant Counts and Rates in Staffordshire & Stoke-on-Trent Wards
• The following maps and tables provide the latest breakdown of the claimant count by
wards in Staffordshire & Stoke-on-Trent.
Claimant Count Rate July 2020
Out of the 201 wards in Staffordshire
& Stoke-on-Trent, 58 were at or
above the England average of 6.5%
for the number of claimants as a
proportion of the working age
population in July.
The top 10 wards with the highest
claimant count rate were all in Stoke-
on-Trent with Etruria and Hanley
(13.4% or 675 claimants), Joiner’s
Square (13.3% or 585), and Moorcroft
(12.7%) having the highest rates.
In Staffordshire, Burton in East
Staffordshire and Glascote in
Tamworth had the joint highest
claimant count rate (9.1%).
Staffordshire & Stoke-on-Trent Economic Bulletin – August 2020 Page | 8Change in Claimant Count since March 2020
The top 4 wards with the highest
change in the number of claimants
since March 2020 were all in Stoke-
on-Trent and included Birches Head
and Central Forest Park (345
increase to 735 in total), Etruria and
Hanley (320 rise to 675 in total),
Bentilee and Ubberley (285 increase
to 685 in total) and Baddeley,
Milton and Norton (285 rise to 615
in total).
Youth Claimant Counts and Rates in Staffordshire & Stoke-on-Trent Wards
The following maps and tables provide the latest breakdown of the youth claimant count by
wards in Staffordshire & Stoke-on-Trent.
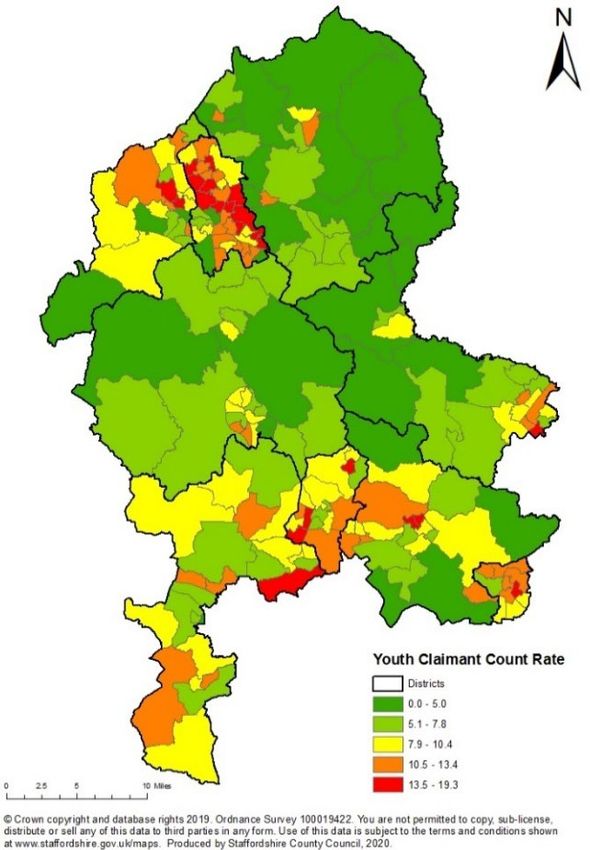
Youth Claimant Count Rate July 2020
Out of the 201 wards in Staffordshire &
Stoke-on-Trent, 82 were at or above the
England average of 9.4% for the number of
claimants aged 18-24 as a proportion of the
18-24 population.
Of the top 10 wards with the highest youth
claimant count rate 5 were in Stoke-on-
Trent including Joiner’s Square (19.3% - the
highest in SSLEP area), Moorcroft (17.2%),
Bentilee and Ubberley (15.9%), Abbey
Hulton and Townsend (15.9%) and Eaton
Park (15.2%).
In Staffordshire, the highest rate was
Glascote in Tamworth with 17.2%, followed
by Cannock South (16.5%), Stapenhill in East
Staffordshire (15.4%), Curborough in
Lichfield (15.4%) and Cross Heath in
Newcastle-under-Lyme (15.2%).
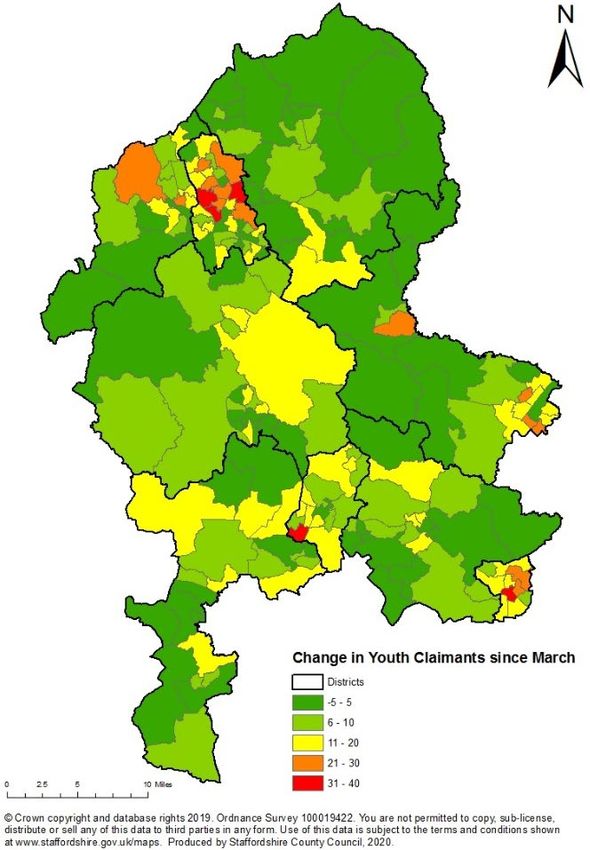
Staffordshire & Stoke-on-Trent Economic Bulletin – August 2020 Page | 9Change in Youth Claimant Count since March 2020
The top 3 wards with the highest change
in the number of youth claimants since
March 2020 were all in Stoke-on-Trent
and included Etruria and Hanley (75 rise
to 120 in total), and Abbey Hulton and
Townsend ward and Birches Head and
Central Forest Park ward (both with an
increase of 60 to 130 in total).
Staffordshire & Stoke-on-Trent Economic Bulletin – August 2020 Page | 10Coronavirus Job Retention Scheme (CJRS) Furloughed Jobs 2
• Staffordshire had the 2nd highest number of furloughed job claims up to the end
of July in the WM with 135,700 behind only Birmingham and equivalent to just over
a third (34%) of eligible workers. This is to be expected given Staffordshire is the 2nd
largest strategic authority area in the region.
• Staffordshire’s rate of furlough is in-line with the regional average and slightly
above the national (32%) average.
• Stoke-on-Trent had 38,100 jobs furloughed, also equivalent to 34% of eligible jobs.
Coronavirus Job Retention Scheme (CJRS) Statistics: July 2020
Total number
Take-up
Area of Jobs Eligible Jobs
rate
Furloughed
Cannock Chase 17,600 46,400 38%
Tamworth 14,400 38,400 37%
Staffordshire Moorlands 14,800 42,300 35%
SSLEP 173,800 510,800 34%
East Staffordshire 20,100 58,400 34%
Lichfield 16,300 47,300 34%
South Staffordshire 16,500 48,300 34%
West Midlands Region 866,400 2,580,400 34%
Stoke-on-Trent 38,100 112,600 34%
Staffordshire 135,700 398,200 34%
Newcastle-under-Lyme 17,700 55,200 32%
England 8,067,700 25,577,800 32%
Stafford 18,400 61,900 30%
Source: HMRC CJRS and PAYE Real Time Information
• Nationally, the identified high-risk sectors are amongst the highest for the number of
jobs that have been furloughed:
2
Source: HMRC - https://www.gov.uk/government/statistics/self-employment-income-support-scheme-
statistics-july-2020
Staffordshire & Stoke-on-Trent Economic Bulletin – August 2020 Page | 11Coronavirus Job Retention Scheme (CJRS) Claims by Sector: July 2020
Employers Employments
Employers
furloughing Employments Value of claims
Sector staff Take-up rate furloughed Take-up rate made (£million)
Wholesale and retail; repair of motor vehicles 178,600 74% 1,906,100 42% 6,071
Accommodation & food services 110,700 87% 1,693,600 77% 4,773
Manufacturing 74,800 76% 1,021,500 42% 3,840
Business administration and support services 102,000 62% 890,500 32% 2,806
Construction 174,000 76% 769,300 60% 2,931
Professional, scientific & technical 150,900 49% 632,900 29% 2,203
Arts, entertainment, recreation and other servi 30,100 76% 474,300 70% 1,339
Transport & storage (inc postal) 43,100 60% 424,100 32% 1,680
Health 55,100 55% 423,200 10% 1,065
Education 24,400 63% 341,700 10% 864
Trade union, religious, political and repair 71,200 77% 315,000 55% 893
Information & communication 59,400 38% 227,500 18% 843
Property 28,600 62% 157,800 37% 543
Unknown and other 23,300 * 101,300 * 239
Finance & insurance 14,500 42% 76,800 7% 276
Waste and Recycling 4,000 72% 43,700 25% 168
Agriculture, forestry & fishing 9,700 29% 36,600 20% 96
Energy Production 700 53% 20,800 16% 85
Public administration & defence 500 7% 20,400 2% 65
Mining, quarrying & utilities 600 54% 14,800 28% 77
Domestic employers 8,200 11% 10,100 8% 30
Total 1,164,400 61% 9,601,700 32% 30,886
Source: HMRC CJRS and PAYE Real Time Information
• Beyond the short-term, specific industrial sectors and the associated labour market may
continue to be adversely affected, particularly due to changes to economic support
measures and market conditions. A particular risk is the ongoing changes to the
Government’s Job Retention Scheme (JRS) which has enabled many people to remain
in employment but furloughed during the lockdown. Whilst the scheme has been
extended to October, it is being gradually withdrawn from August onwards and this
may lead to potential further increases in unemployment.
Staffordshire & Stoke-on-Trent Economic Bulletin – August 2020 Page | 12Self-Employment Income Support Scheme (SEISS) 3
• Staffordshire has seen 30,600 self-employed workers claim through SEISS up to
the end of July and a take-up rate of over three quarters (77%) for those eligible
through the scheme, the same as the regional average and just above the national
average of 76%.
• Stoke-on-Trent had 8,300 SEISS claims up to the end of July, equivalent to 80% of
those eligible. This is the joint highest rate the West Midlands Region upper-tier
authorities.
Self-Employment Income Support Scheme (SEISS) Statistics: July 2020
Total Total no. of
Total value of Average value
County and district / potentially claims made
claims made to of claims made Take-Up Rate
unitary authority eligible to 31/7/20
31/7/20 (£) to 31/7/20 (£)
population
Cannock Chase 5,000 4,100 12,900,000 3,100 81%
Stoke-on-Trent 10,500 8,400 21,800,000 2,600 80%
Newcastle-under-Lyme 5,200 4,100 11,900,000 2,900 78%
Tamworth 3,000 2,300 6,700,000 2,900 78%
SSLEP 50,100 39,000 112,500,000 2,885 78%
Lichfield 4,800 3,700 11,600,000 3,100 77%
South Staffordshire 5,300 4,100 12,300,000 3,000 77%
West Midlands Region 263,000 202,000 565,000,000 2,800 77%
Staffordshire 39,600 30,600 90,700,000 3,000 77%
East Staffordshire 5,300 4,000 10,700,000 2,700 76%
Staffordshire Moorlands 5,400 4,100 12,100,000 2,900 76%
England 2,946,000 2,251,000 6,577,000,000 2,900 76%
Stafford 5,600 4,200 12,600,000 3,000 75%
3
Source: HMRC - https://www.gov.uk/government/statistics/self-employment-income-support-scheme-
statistics-july-2020
Staffordshire & Stoke-on-Trent Economic Bulletin – August 2020 Page | 13The Coronavirus Business Interruption Loan Scheme (CBILS) and the Bounce Back
Loan Scheme (BBLS) 4
• New data published by the British Business Bank shows that businesses in all parts of
the UK are making use of and benefiting from Coronavirus loan schemes.
• The data shows the regional distribution of loans under the Coronavirus Business
Interruption Loan Scheme (CBILS) and the Bounce Back Loan Scheme (BBLS), which are
schemes designed to provide financial support to businesses across the UK that are
losing revenue and seeing their cashflow disrupted, as a result of the Covid-19 outbreak.
• As at the 2nd August, there were 3,770 CBILS loans in the West Midlands for a total of
just over £871m. This represented 9% of the total number of CBILS loans UK-wide and
is one of the highest usage of CBILS outside of London and the South East (33%).
• While for BBLS loans the West Midlands is also demonstrating strong use with a total of
84,773 loans for a total of just under £2.6bn and represented 8% of all UK loans, behind
only the North West and East of England outside of London and the South East (34%).
• Generally, the proportion of loans in each region is equivalent to their share of the
business population across the UK.
• The Wholesale and Retail sector has accessed a significantly higher proportion of CBILS
loans (19%) than its share of the business population (9%), with Manufacturing (13% v
5%) and Accommodation and Food Services (9% v 3%) following a similar pattern.
• The Wholesale and Retail sector also accessed a relatively high proportion of Bounce
Back Loans compared to its business population share (16% v 9%), as did businesses in
Accommodation and Food Services (8% v 3%) and Real Estate Services (6% v 2%).
• The British Business Bank has also released constituency level data for CBILS and BBLS.
The following table shows the breakdown for Staffordshire and Stoke-on-Trent
constituencies:
4
Source: British Business Bank - https://www.british-business-bank.co.uk/coronavirus-loan-schemes-
benefiting-businesses-in-all-corners-of-uk-reveals-new-analysis-from-british-business-bank/
Staffordshire & Stoke-on-Trent Economic Bulletin – August 2020 Page | 14Coronavirus Business Interruption Loan Scheme (CBILS) and the Bounce Back Loan
Scheme (BBLS) Statistics: 2nd August 2020
CBILS BBLS TOTAL
Number Value of Number Value of Number Value of % of
Area of Loans Loans Offered of Loans Loans Offered of Loans Loans Offered SSLEP % of SSLEP
Offered (£m) Offered (£m) Offered (£m) Loans Businesses
Burton 82 17,931,933 1,501 44,561,837 1,583 62,493,770 10% 10%
Lichfield 76 13,808,681 1,476 42,142,939 1,552 55,951,620 10% 11%
Tamworth 99 32,024,097 1,328 39,285,979 1,427 71,310,076 9% 9%
Cannock Chase 73 16,160,169 1,338 39,486,802 1,411 55,646,971 9% 9%
Stone 44 7,802,001 1,322 39,200,793 1,366 47,002,794 9% 10%
South Staffordshire 57 12,517,757 1,296 38,818,503 1,353 51,336,260 9% 10%
Stafford 55 7,420,953 1,227 36,222,492 1,282 43,643,445 8% 9%
Stoke-on-Trent Central 46 10,605,935 1,149 35,168,237 1,195 45,774,172 8% 6%
Newcastle‐under‐Lyme 55 14,329,503 1,078 33,381,146 1,133 47,710,649 7% 6%
Stoke‐on‐Trent North 49 10,623,719 1,040 30,573,493 1,089 41,197,212 7% 6%
Staffordshire Moorlands 40 5,414,157 1,008 29,115,881 1,048 34,530,038 7% 9%
Stoke‐on‐Trent South 38 10,653,126 861 26,011,673 899 36,664,799 6% 5%
Staffordshire 564 123,732,874 11,357 334,846,899 11,921 458,579,773 78% 84%
Stoke-on-Trent 150 35,559,157 3,267 99,122,876 3,417 134,682,033 22% 16%
SSLEP 714 159,292,031 14,624 433,969,775 15,338 593,261,806 100% 100%
West Midlands 3,770 871,365,361 84,773 2,593,303,126 88,543 3,464,668,487
UK 45,621 10,486,585,419 1,042,668 31,659,691,546 1,088,289 42,146,276,965
• As at the 2nd August, there were a combined 15,338 CBILS and BBLS loans in the SSLEP
area equivalent to £593m, this represented 17% of the total loans in the West Midlands.
The proportion of loans in the SSLEP area is largely in-line with areas share of the
business population in the West Midlands (18%).
• In terms of local constituencies, Burton had the highest number of loans with 1,583 while
Tamworth had the highest value of all loans with just over £71.3m.
• For most constituencies the proportion of loans in the SSLEP area is largely in-line with
their share of the business population in the SSLEP. However, the constituencies in the
north including Stoke-on-Trent Central, Newcastle-under-Lyme, Stoke-on-Trent North
and Stoke-on-Trent South all have higher proportions of the total loans in the SSLEP
compared to their share of the business population.
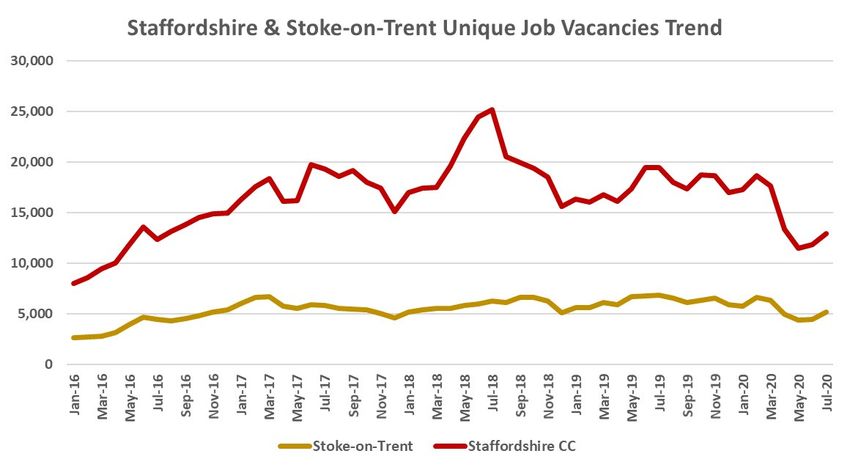
Staffordshire & Stoke-on-Trent Economic Bulletin – August 2020 Page | 15Job Vacancies 5
• Following a period of declining job vacancies, demand for labour in Staffordshire is
starting to pick back up, where between June 2020 and July 2020 there was an increase
in job vacancies of 9% equivalent to over 1,000 more job vacancies which is in-line
with the growth seen regionally and nationally.
• Stoke-on-Trent saw a 17% growth with just over 750 more vacancies in July
compared to June.
• Staffordshire’s year-on-year decline in July stood at 34% which was greater than
the 28% decline seen nationally, this likely reflects Staffordshire’s economic structure
where sectors and occupations hardest hit by COVID-19 make up more of our local
economy and therefore recruitment has declined more substantially. Stoke-on-Trent
witnessed a below average year-on-year decline of 24% in July.
• Although we have seen a decline in vacancies for most occupations since the crisis
started, particularly within sectors and roles hardest hit by the lockdown, we are starting
to see some growth again.
• The main recruitment growth occupations (although relatively low numbers)
between Feb (pre-COVID) and July have been residential, day and domiciliary care
managers and proprietors; packers, bottlers, canners and fillers; and health services
and public health managers and directors.
5
Source: EMSI
Staffordshire & Stoke-on-Trent Economic Bulletin – August 2020 Page | 16• While demand for nurses and social care workers and home carers remains by far the
strongest of all occupations.
Staffordshire & Stoke-on-Trent Economic Bulletin – August 2020 Page | 17• The overall fall in the number of job vacancies suggests that those unfortunate enough
to lose their jobs may struggle to find new ones at least in the short-term, although
there are still opportunities available.
Job Vacancies Summary Table
June-July July 2019-
June-July Feb-July Feb-July July 2019-
July 2019 Feb 2020 Apr 2020 May 2020 June 2020 July 2020 2020 July 2020
2020 2020 (Month 2020 July 2020
Area / SSLEP Occupational Group Unique Unique Unique Unique Unique Unique (Month on (Year on
Monthly on Month Monthly % Annual %
Postings Postings Postings Postings Postings Postings Month Year
% Change Change) Change Change
Change) Change)
Staffordshire CC 19,438 18,675 13,346 11,456 11,795 12,885 1,090 9% -5,790 -31% -6,553 -34%
Stoke-on-Trent 6,848 6,635 4,962 4,336 4,427 5,182 755 17% -1,453 -22% -1,666 -24%
SSLEP 26,286 25,310 18,308 15,792 16,222 18,067 1,845 11% -7,243 -29% -8,219 -31%
West Midlands 189,604 169,792 128,323 111,004 109,144 118,754 9,610 9% -51,038 -30% -70,850 -37%
England 2,060,854 1,955,292 1,572,921 1,380,005 1,371,112 1,487,781 116,669 9% -467,511 -24% -573,073 -28%
Staffordshire Moorlands 1,695 1,884 1,333 1,047 915 864 -51 -6% -1,020 -54% -831 -49%
Tamworth 2,858 2,740 1,844 1,519 1,439 1,554 115 8% -1,186 -43% -1,304 -46%
East Staffordshire 3,055 3,172 2,126 1,846 1,903 2,206 303 16% -966 -30% -849 -28%
Cannock Chase 2,732 2,188 1,677 1,459 1,494 1,585 91 6% -603 -28% -1,147 -42%
Stafford 4,493 4,321 3,070 2,635 2,850 3,247 397 14% -1,074 -25% -1,246 -28%
Newcastle-under-Lyme 1,539 1,687 1,254 1,131 1,205 1,275 70 6% -412 -24% -264 -17%
Lichfield 2,551 2,042 1,554 1,382 1,485 1,572 87 6% -470 -23% -979 -38%
South Staffordshire 515 641 488 437 504 582 78 15% -59 -9% 67 13%
Sales and Customer Service Occupations 1,104 1,048 606 456 529 537 8 2% -511 -49% -567 -51%
Administrative and Secretarial Occupations 3,179 2,580 1,535 1,168 1,272 1,399 127 10% -1,181 -46% -1,780 -56%
Skilled Trades Occupations 2,406 2,272 1,504 1,098 1,115 1,321 206 18% -951 -42% -1,085 -45%
Associate Professional and Technical Occupations 5,386 4,900 3,305 2,576 2,566 2,994 428 17% -1,906 -39% -2,392 -44%
Process, Plant and Machine Operatives 2,158 2,036 1,097 812 919 1,263 344 37% -773 -38% -895 -41%
Elementary Occupations 2,259 2,117 1,504 1,396 1,453 1,735 282 19% -382 -18% -524 -23%
Professional Occupations 5,899 6,295 5,260 4,907 4,950 5,269 319 6% -1,026 -16% -630 -11%
Managers, Directors and Senior Officials 1,624 1,672 1,226 1,126 1,229 1,432 203 17% -240 -14% -192 -12%
Caring, Leisure and Other Service Occupations 2,271 2,390 2,271 2,253 2,189 2,117 -72 -3% -273 -11% -154 -7%
Staffordshire & Stoke-on-Trent Economic Bulletin – August 2020 Page | 18Notes Claimant Count and ILO Unemployment Definitions The Claimant Count is a measure of the number of working age people claiming benefits principally for the reason of being unemployed, including those claiming Jobseeker's Allowance plus those who claim Universal Credit and are required to seek work and be available for work. ILO unemployment data is obtained from the national Labour Force Survey. The definition for unemployment is those without a job, want a job, have actively sought work in the last four weeks and are available to start work in the next two weeks, or; are out of work, have found a job and are waiting to start work in the next two weeks. Understanding the differences between the Claimant Count and ILO Unemployment According to the UK Claimant Count for May, claimant unemployment increased to 2.8 million and a rate of 7.8% – a rise of 125% in just two months, the fastest rate of growth on record. However, the ILO measure shows that unemployment has remained largely unchanged at around 1.3 million and a rate of 3.9%. Understanding the reasons why there is this difference is important for policymakers trying to determine whether we are currently in the middle of an unemployment crisis or whether this is to come as the Job Retention Scheme (JRS) is gradually withdrawn. The following section tries to explain this incredibly confusing, complicated and often contradictory data. The main reasons for the difference between the Claimant Count and ILO measures include: • The two measures describe different periods – for claimant unemployment, the numbers refer to claimants on a specific ‘count date’ with the last three being 12 March, 9 April and 14 May. Therefore these are point-in-time estimates, and handily we can compare what the situation was about a week before the crisis (12 March) with how things were two months later (14 May). The ILO measure is a three-month average of survey responses between early February and late April 2020. This means that two months pre-date the crisis, while one month (April) is since the crisis began. However, ONS does release single month estimates (latest available April 2020) which show a drop in employment in April of 320,000 explained almost entirely by fewer people self-employed but only slight increase of 40,000 unemployed. Instead there is a steep rise in ‘economic inactivity’ which is those who are out of work but are not looking and/ or available for work. Staffordshire & Stoke-on-Trent Economic Bulletin – August 2020 Page | 19
•   Difference in measuring economic inactivity/worklessness - the Claimant Count
    measures those who are required to look/be available for work as a condition of benefit,
    while the ILO measure is those who say that they actually are actively seeking and
    available for work. The Labour Force Survey is recording a single-month increase in the
    number of people out of work (unemployed and economically inactive) of 330,000, but
    nearly 290,000 of these people are not looking for work (economically inactive). The
    majority of this rise is people previously self-employed and are either not eligible for, or
    not yet been paid, income under the Self-Employed Income Support Scheme (SEISS).

•   Claimant Count now includes more workers on low-income - In the Claimant Count,
    people with earned income can be counted as claimant unemployed if their earnings in
    the reference month are below a set threshold (£338 per month for a single person, or
    £541 per month for a couple). Before Universal Credit (UC), short-hours working was
    penalised and so these numbers were generally low. However, UC incentivises short-
    hours work, and so we’ve seen a growth in recent years in the number of people treated
    as being unemployed but who have some earnings. The detailed data for UC suggests
    that 190,000 of the 1 million increase between March and April was accounted for by
    working claimants – so around one fifth of the rise.

•   Difference in recording people who are ‘in work’ – in the Labour Force Survey you are
    recorded as in employment even if you have not done any work that week but ‘have a
    job or business that you were away from… (and that you expect to return to)”. Obviously
    this category of workers ‘away’ from work now captures about 9 million people
    furloughed under the Job Retention Scheme (JRS) who are continuing to earn, but it also
    includes people who consider themselves to be employees or self-employed but who
    have no earnings. ‘Real time’ Pay As You Earn data suggests that this may be mainly
    employees, with the number of paid employees falling by 450,000 between March and
    April. This 450,000 could include a large number of people who may have been due to
    start a job in March or April but have been told that they job isn’t available yet and may
    also be people who had very few or irregular hours before the JRS was introduced and
    whom employers have not submitted a JRS claim. These people may be describing
    themselves as being workers with a job that they are away from, rather than as being
    actively seeking a new job.

•   Benefit take-up/eligibility impact on the Claimant Count – given that the claimant
    count only counts those who claim benefit it may be under-stating the growth in
    worklessness. We know that many unemployed people do not claim, and particularly
    young people (usually due to eligibility). Under UC, there have been on average 450,000
    more ILO unemployed young people than claimant unemployed and even if that gap
    narrows in the crisis, as tends to happen in recessions, it’s possible that ILO youth
    unemployment will remain significantly higher than the claimant measure.

Staffordshire & Stoke-on-Trent Economic Bulletin – August 2020                   Page | 20
Summary table outlining the potential estimates for the Claimant Count rise in April:
Potential
Proportion of Potential
Labour Force Survey
Claimant Count Number of Potential Reasons for being a Claimant
Categorisation
Change Mar-20 Claimants
to Apr-20
44% 450,000 New Job Starters/PT employees/Self- In Employment - even if not done any
employed with no income claiming work that week but ‘have a job or
Universal Credit not supported by JRS business that were away from… (and
that expect to return to)” – rather than
unemployed
28% 292,500 Self-employed ceased trading or have very Economically inactive - people out
low income claiming Universal Credit (and of work but are not looking for work -
are either not eligible for, or not yet been paid, majority people previously self-
income under the SEISS) employed
18% 190,000 Working part-time low income workers In Employment
claiming Universal Credit
10% 100,000 Potential Redundancies
100% 1,032,500 Claimant Count Increase Mar-20 to Apr-20
• It is hoped that this analysis has provided further clarity as to why we have seen such a
spike in the number of claimants early in the crisis. What is clear is that we have seen a
record fall between March and April in the number of people working and not being
supported by JRS. We have also seen worklessness rising at a faster rate than at any time
before. Although very few of the decline in the numbers ‘working’ had translated into
higher unemployment in April, it is envisaged that this may be the case if people are
unable to get back into work quickly.
• Looking forward, the growth in claims for UC is slowing and so the growth in the Claimant
Count is also likely to slow as well. That said claimant unemployment is currently at the
highest level on record. The main concern now is what happens to many workers as JRS
is gradually withdrawn and it is important that we are thinking now about how to support
people that are made redundant and what policy interventions are needed.
Staffordshire & Stoke-on-Trent Economic Bulletin – August 2020 Page | 21You can also read