NEW MEXICO PRISON POPULATION FORECAST: FY 2021-FY 2030
←
→
Page content transcription
If your browser does not render page correctly, please read the page content below
NEW MEXICO PRISON
                             POPULATION FORECAST:
                                                  FY 2021—FY 2030
Prepared by NMSC Staff								                                                                             *Updated July 2020 with Q4 data

While we tried to simulate the downward            the male inmate population is 5,976.       INTRODUCTION
trend in prison population that started in FY    • In FY 2022, the projected high count for
2018 in our forecast, the ongoing COVID-19         the male inmate population is 5,937.       This prison population forecast was prepared
pandemic will continue to impact prison pop-
                                                 Females:                                     by the Bureau of Business and Economic
ulation. From the time of New Mexico’s first                                                  Research (BBER) at the University of New
positive case in March 2020 to June 21, 2020,
                                                 • In FY 2021, the projected high count for
the men’s total population has decreased           the female inmate population is 656.       Mexico for the New Mexico Sentencing
6.1% and the female total population has         • In FY 2022, the projected high count for   Commission (NMSC). The forecast is designed
decreased 7.8%. Given these dramatic popu-         the female inmate population is 623.       to assist the New Mexico Corrections
lation changes, we will review our forecast on                                                Department (NMCD) in assessing immediate
a quarterly basis.
                                                  National Trends
                                           • The total U.S. prison population (state          and future inmate populations. This report also
New Mexico Trends                            and federal) totaled 1,465,200 at                includes information that may be of interest
Females: The New Mexico female inmate        yearend 2018. This was a decrease of             to policy makers who are involved with the
population has entered an unusual            approximately 24,000 prisoners over              correctional system.
period of decline beginning in Nov 2018,     yearend 2017.
although patterns of increase/decrease     • The federal prison population
                                                                                              This report applies historical observations of
have been ongoing since 2015. Prior          decreased in size for the sixth year in a        prison population data to generate the figures
to that, stable growth in the female         row. There were 3,160 fewer prisoners            included in the forecasts. NMSC maintains
population began at the start of 2010.       under the jurisdiction of federal prisons        a dataset of daily totals for male and female
As of June 28, 2020, females comprised       in 2018 than 2017. At yearend 2017,              prisoners in New Mexico. Monthly high counts
approximately 9.7% of the total inmate       the number of inmates held in federal            are extracted from those data to produce a
population in the state.                     prisons was 179,900.                             complete sample spanning January 2001 to
To date in FY 2020, the high count for the • The aggregate state prison population            the current month.
female inmate population is 742 inmates      decreased again in 2018. There were
                                             20,870 fewer prisoners under the                 It is understood that many factors drive prison
FY 2019 high count: 794 female inmates;      jurisdiction of state prisons in 2018            populations, including demographic trends,
FY 2018 high count: 797 female inmates;      than 2017. At yearend 2018, the                  arrest rates, the number of criminal cases
FY 2017 high count: 764 female inmates;      number of inmates held in state prisons          filed in district courts, conviction rates, the
FY 2016 high count: 791 female inmates;      was 1,285,260.                                   availability of diversion programs, sentence
FY 2015 high count: 782 female inmates.    • For sentenced prisoners, the                     lengths, admission and release rates, the
Males: High counts for male prison           imprisonment rate at yearend 2018
                                                                                              availability of earned meritorious deductions,
populations have been sharply decreasing     was the lowest since 1996, with 431
                                             prisoners per 100,000 U.S. residents             and parole readiness. The observed prison
since August 2018.
                                             of all ages and 555 per 100,000 U.S.             population is a result of all those factors
To date in FY 2020, the high count for the   residents age 18 or older.                       and others. When new laws or polices
New Mexico male inmate population is       • In 2018, the imprisonment rate of                come to bear which significantly affect the
6,331 inmates.                               Black residents (1,134 sentenced Black           prison population, it is recommended that
FY 2019 high count: 6,634 male inmates;      prisoners per 100,000 Black residents)           a new long-term forecast be produced to
FY 2018 high count: 6,616 male inmates;      was the lowest since 1989 (1,050 per             incorporates new data that reflects those
FY 2017 high count: 6,639 male inmates;      100,000).                                        changes.
FY 2016 high count: 6,727 male inmates;    • On December 31, 2018, female inmates
FY 2015 high count: 6,558 male inmates.      comprised 7.6% of the population in all          Time series forecasting consists of examining
Short-Term Forecast                          state or federal prisons.                        historical prison population data, identifying
Males:                                                                                        potential methodologies, fitting the data,
• In FY 2021, the projected high count for                                                    and testing the model. Testing includes a

MSC02 1625 | Albuquerque, NM 87131 | (505) 277-3494 | nmsc.unm.edu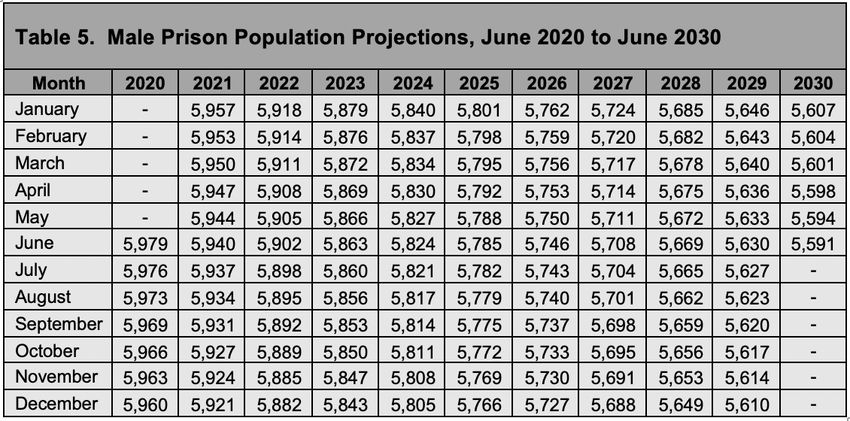
comparison of descriptive statistics for each model to               There were approximately 3,160 fewer prisoners under
establish the best-fitting specification. Then, projections          the jurisdiction of federal prisons in 2018 than in 2017.
are evaluated against actual observations to determine the           At yearend 2018, the number of inmates held in federal
accuracy of each model. Diagnostic checks are applied to             prisons was about 179,900.
the differences between forecast estimates and observed            • The aggregate state prison population also decreased
values to ensure that a model adequately explains trends in          in 2018 (the current decline in state populations began
the data.                                                            in 2014). There were 20,870 fewer prisoners under the
It is possible for historical trends to be well-represented          jurisdiction of state prisons in 2018 than in 2017. At
by more than one model. Though diagnostic checks are                 yearend 2018, the number of inmates held in state prisons
imperative for selecting the most precise specification, the         was 1,285,260.
present methodology requires augmentations at various              • Adult correctional systems in the United States supervised
steps to incorporate details from conversations with                 an estimated 6,613,500 persons at yearend 2016.
Sentencing Commission staff which detail upcoming issues
that may influence prison populations/patterns.                    • The imprisonment rate for sentenced prisoners saw
                                                                     another reduction from 2017 to 2018. At yearend 2018 it
As of June 25, 2020, the male forecast has been within               was the lowest since 1996, with 431 prisoners per 100,000
the 3% range for 4 of 12 months. The female forecast was             U.S. residents of all ages and 555 per 100,000 U.S. residents
within the 3% range for 2 of 12 months. In fall of 2019, as          age 18 or older.
the population continued to drop, NMSC and BBER decided
to redo the projection. In late January 2020, the projection       • Compared to other state prisons, New Mexico houses a
was redone. As we were writing up the new report, the                higher percentage of male inmates convicted of violent
population continued to decline. Declines continued in               offenses and drug offenses. According to the Bureau of
the third quarter of FY20 leading up to first confirmed              Justice Statistics, on December 31, 2018, the percentage
COVID-19 case in New Mexico. On March 11, 2020, the total            of male inmates confined in all 50 state prisons convicted
male prison population was 6,121 and the total female                of a violent offense was 57.1%. In New Mexico on June
prison population was 667. On June 21, 2020, the male                30, 2019, 66% of male inmates were convicted of a
total population had dropped 6.1% and the female total               violent offense (Figure 1). Likewise, the percentage of
population dropped 7.8% from pre-COVID-19 levels (376                New Mexico males convicted of a drug offense was 17%
and 51 respectively).                                                compared to the national average of 13.6% (Figure 1).
In June 2020, new forecasts were created that took into
account the decline in the male population since September
2019 and the decline in the female population since July
2019.
While we tried to simulate the downward trend in prison
population that started in FY 2018 in our forecast, the
ongoing COVID-19 pandemic will continue to impact prison
population. Given these dramatic population changes, we
will review our forecast on a quarterly basis.
NATIONAL TRENDS
The U.S. Department of Justice publishes several annual
reports that detail trends in the U.S. prison population.
Those reports are based on data collected pursuant to the
National Prisoner Statistics Program. Data has been collected
on an annual basis since 1926. The most recent full-year
report, titled Prisoners in 2018, was released in April 2020. It   • The percentage of confined women in New Mexico
provides data on prisoners under the jurisdiction of federal         convicted of a violent offense is also larger than the
and state correctional authorities from yearend 2017 to              national percentage (Figure 2). In New Mexico on June
yearend 2018. Another annual publication is Correctional             30, 2019, 42% of female inmates were convicted of a
Populations in the United States, but the 2019 edition is still      violent offense. On December 31, 2018, the percentage of
pending release. The following are included in those reports:        female inmates confined in all state prisons convicted of
• The total U.S. prison population (state and federal) totaled       a violent offense was 37.8%. As with the male inmates in
  nearly 1,465,200 at yearend 2018. This was a decrease of           New Mexico, female inmates also had a higher conviction
  24,000 prisoners from yearend 2017.                                rate for drug offenses than the national average, with
                                                                     New Mexico female inmates at 35% compared to 25%
• The federal prison population decreased in size for the
                                                                     nationally.
  sixth year in a row; this trend was first identified in 2013.

                                                                                               New Mexico Sentencing Commission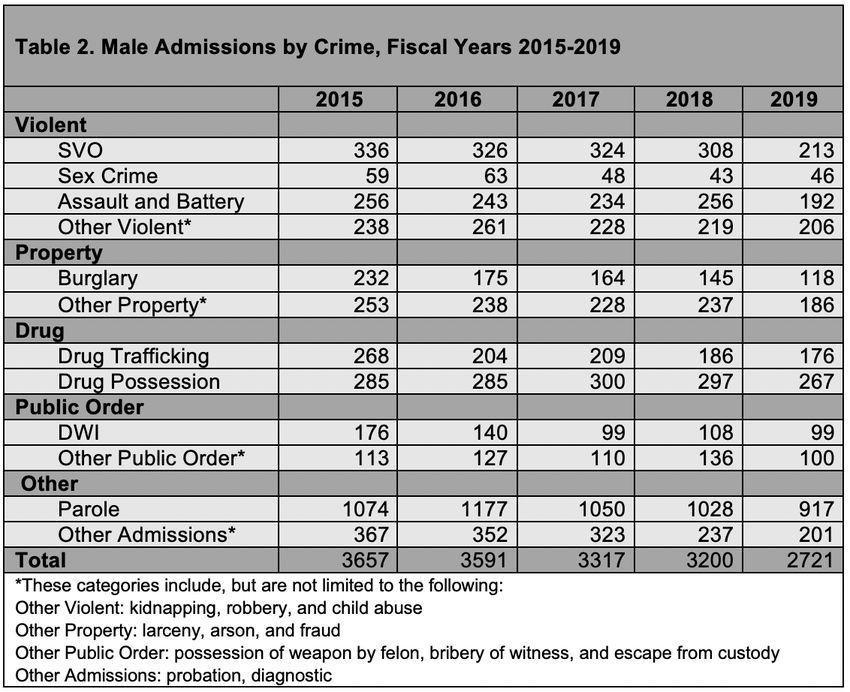
downward.
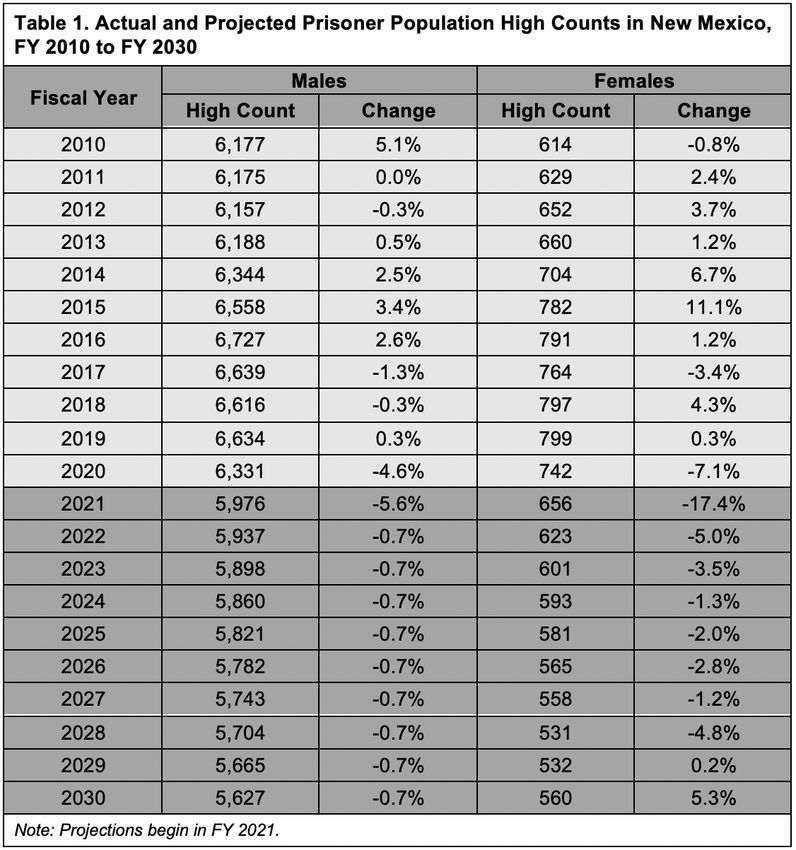
High counts for male prison populations within the most
recent five fiscal years are listed below. Table 1 provides
these data since FY 2004. Between FY 2016 and FY 2020
male inmate high counts decreased 6.1%.
FY 2020 high count: 6,331 male inmates;
FY 2019 high count: 6,634 male inmates;
FY 2018 high count: 6,616 male inmates;
FY 2017 high count: 6,639 male inmates;
FY 2016 high count: 6,727 male inmates.
FEMALES:
In FY 2020, females comprise approximately 9.7% of the
total inmate population for New Mexico. The most notable
trend in the state is the mirrored decrease in overall prison
populations. At 742, the current FY 2020 high count for
female inmates is 6.5% under the FY 2019 high count of
794. The downtrend in female prison populations has been
NEW MEXICO TRENDS ongoing since November 2018.
MALES: Historical female totals for the last five fiscal years are
The male high count for FY 2020 occurred in September presented below (see Table 1 for complete female and male
2019 at 6,331; it is currently at 5,861 as of June 2020. Total inmate high counts, beginning FY 2010). Yearly high counts
prisoner populations in New Mexico have been trending increased between FY 2017 through FY 2019, but have
downward since 2018, and the current male populations decreased since the peak high count in November 2018,
have seen a -4.6% decrease from the FY 2019 high.
Male high counts have traditionally been more volatile FY 2020 high count: 742 female inmates;
than female counts, with marked fluctuations between FY 2019 high count: 794 female inmates;
population losses and gains throughout the years. However, FY 2018 high count: 797 female inmates;
since August 2018, the overall trend has been consistently FY 2017 high count: 764 female inmates;
3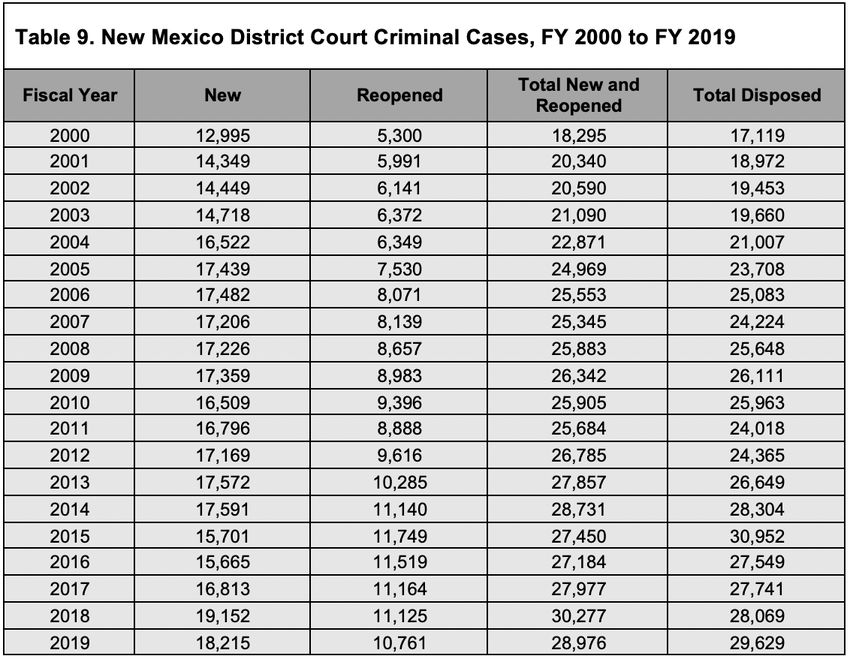
FY 2016 high count: 791 female inmates.                         population trends and discuss factors that may affect
                                                                current forecasts. Discussions have included the following
FACTORS INFLUENCING PRISON POPULATION
                                                                subjects, which may impact future prison populations:
In 2015, the New Mexico Statistical Analysis Center/Institute
                                                                •   NMCD continues to work with the Pew-MacArthur
for Social Research published the study Prison Program
                                                                    Foundation, the Legislative Finance Committee, and
Utilization and Recidivism Among Female Inmates in New
                                                                    NMSC on implementation of the Results First Initiative.
Mexico (Kristine Denman, April 2015). Findings set forth in
                                                                    The initiative employs an evaluation model to identify
the report include the following:
                                                                    cost effective programs that reduce recidivism. Also,
•   Women who participated in educational programming               NMCD is working directly with Pew staff on an inventory
    were less likely to re-offend.                                  of inmate programming in facilities and offender
•   Matching, recommending, and promoting                           programming in communities.
    programming appropriate to criminogenic needs may           •   In 2017, NMCD implemented the use of the COMPAS
    decrease future offending.                                      assessment throughout Adult Prisons Division and
•   Post-release supervision was associated with decreased          Probation Parole Division. NMCD has now completed
    adjudications and incarcerations for new offenses.              enough assessments that a validation study is
                                                                    underway.
The continued downtrend in male and female prison
populations is not presently well understood. However, they     •   In 2018-2019, the Legislature convened the Criminal
are likely due to several factors, including:                       Justice Reform Subcommittee of the interim Courts,
                                                                    Corrections, and Justice Committee. This subcommittee
•   In FY 2018, new filings for criminal cases in the state’s       was tasked with analyzing the state’s criminal justice
    district courts increased to almost 19,200—the largest          system with an eye towards implementing criminal
    number of new filings in the time period spanning FY            justice reforms across the system.
    2000 to FY 2020. In fiscal year 2019, however, decreased
    to 18,215, a drop of 5% (see Appendix A, Figure 15 and      •   From FY 2019 to FY 2020, the annual high count of
    Tables 9-11).                                                   release eligible inmates (REI) has dropped by 11% (FY
                                                                    2019 REI high count was 200 while FY 2020 REI high
•   Felony drug court programs and other specialty courts           count was 178). On June 30, 2020 the REI count was 95.
    are established throughout New Mexico. Drug courts
    and other specialty courts are not a direct diversion       •   In 2019, the Legislature passed HB 342 (Laws 2019,
    from prison in most cases, but successful participation         Chapter 211), a package of criminal justice reform
    in specialty court programs may break the cycle of              initiatives. Among these reforms were changes to
    contact with the criminal justice system and eventual           when parole shall be imposed for felony offenses,
    imprisonment.                                                   and changes in the conduct and use of eyewitness
                                                                    identifications.
•   New Mexico is among a small number of states where
    the size of jail populations is comparable to prison        •   In 2020, NMSC began implementing responsibilities
    populations. On June 30, 2019, the jail census in New           pursuant to the Crime Reduction Grant Act. Grants were
    Mexico was 6,078 while approximately 6,840 inmates              made to 11 local Criminal Justice Coordinating Councils.
    were held in state prisons.                                     NMSC also partnered with New Mexico Technical
                                                                    Institute for Complex Additive Systems Analysis (ICASA)
•   The adult parole board may impose sanctions other               to begin work on implementing the usage of a state
    than a return to prison for parole violators whose              identification number. Both of these initiatives aim
    infractions are technical in nature.                            to improve the quality and timeliness of data sharing
Every year, NMSC issues reports to describe current trends in       among criminal justice agencies, which will improve our
earned meritorious deductions (EMD) and controlled release          ability to understand prison population trends.
eligible inmates. These briefs provide additional detail that   •   The Legislature passed SB 323 (Laws 2019, Chapter 217)
may inform legislation and policy:                                  in 2019, which decreased penalties for the possession of
•   The EMD report provides information on the average              marijuana and drug paraphernalia.
    proportion of time an individual serves in both their
                                                                CURRENT OPERATIONAL CAPACITY
    prison and total sentences. This information is presented
    by gender and the EMD type of the individual.               Operational capacity is defined as the total number of beds
                                                                available in a prison. In New Mexico, the current operational
•   The Controlled Release report provides information on
                                                                capacity equals the rated capacity, which measures the
    inmates who might be eligible for controlled release.
                                                                number of beds by prisoner classification a prison can
    This report details controlled release by gender, final
                                                                reasonably maintain, given limitations like staffing and
    custody level assignment, and type of offense.
                                                                maintenance.
NMSC staff meet regularly with NMCD staff to review inmate

4                                                                                           New Mexico Sentencing Commission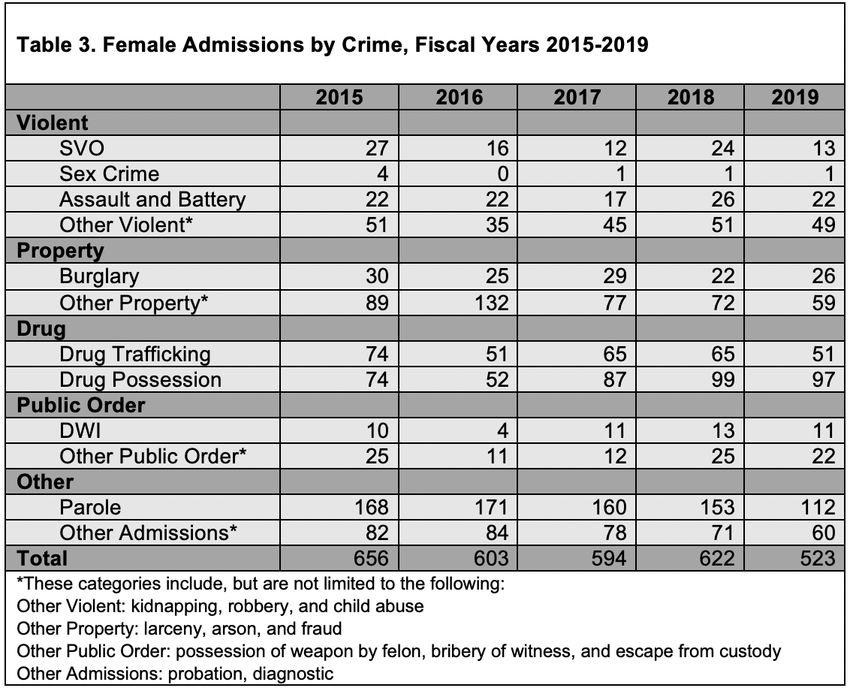
On June 22, 2020, the capacity for male inmates in NMCD is       MALES:
7,059 beds. Correctional facilities for male inmates and their   In FY 2030, the projected high count for the male prison
respective operational capacities are as follows:                population is 5,627. This expected high count is within the
•   Penitentiary of New Mexico, Santa Fe (864)                   current operational capacity for the male prison population
•   Southern New Mexico Correctional Facility, Las Cruces        of 7,099.
    (768)                                                        FEMALES:
•   Central New Mexico Correctional Facility, Los Lunas          In FY 2030, the projected high count for the female prison
    (1,221)                                                      population is 560. This expected high count is within the
•   Roswell Correctional Center, Roswell (340)                   current operational capacity for the female population of
                                                                 860.
•   Lea County Correctional Facility, Hobbs (1,293)
                                                                 PRISON POPULATION AGE
•   Guadalupe County Correctional Facility, Santa Rosa
    (590)                                                        Prisons in the U.S. are constitutionally required to provide
                                                                 health care for prisoners. As the confined population
•   Northeast New Mexico Detention Facility (628)                ages, the cost to maintain the health of that population
•   Otero County Prison Facility (647)                           will increase. If inmate health needs are not adequately
•   Northwestern NM Correctional Facility, Grants (708)          addressed in prisons, there can be greater burdens upon
                                                                 communities to care for those released (Ahalt et al., 2014).
On the same date, the operational capacity for female
inmates is 879 beds:                                             In 2014, the Pew Charitable Trusts counted 144,500 state
                                                                 and federal prisoners with ages 55 years or older. In 2018,
•   Springer Correctional Center, Springer (437)                 a follow-up report indicates that the inmate population
•   Western NM Correctional Facility, Grants (442)               within that age group had increased to 164,400. An increase
                                                                 in the prevalence of older prisoners is important to policy
SHORT TERM FORECAST                                              makers because older populations incur substantially larger
The short-term forecast estimates male and female inmate         health care costs (Kim and Peterson, 2014). Specifically,
populations for the next two fiscal years (FY 2021 and FY        some estimates determine that the health care costs of
2022).                                                           inmates 55 years or older are two to three times larger than
MALES:                                                           that for inmates of average age (Luallen and Kling, 2014).
                                                                 To appropriately fund NMCD, the issue of an aging prison
In FY 2021, the projected high count for the male inmate         population in New Mexico may require further study.
population is 5,976.
                                                                 In the next section, Figures 3 and 4 compare the national
In FY 2022, the projected high count for the male inmate         prisoner age demographics against those for institutions
population is 5,937.                                             within New Mexico. Figures 5 and 6 expand on those data,
The FY 2022 estimate is lower than the current operational       illustrating the change in age demographics for prisoners in
capacity for male inmates of 7,099 beds.                         New Mexico across the last three fiscal years.
FEMALES:                                                         CONFINED AGE: NATIONAL COMPARISON
In FY 2021, the projected high count for the female inmate       The most recent national prisoner age data is from Prisoners
population is 656.                                               in 2018, published by the U.S. Department of Justice in 2020.
In FY 2022, the projected high count for the female inmate       New Mexico data is now almost two years ahead—the most
population is 623.                                               recent data is from June 30, 2019. Figures 3 and 4 illustrate
                                                                 differences in prisoner age between New Mexico and the
The FY 2022 estimate is lower than the current operational       nation for those years.
capacity for female inmates of 860 beds.
                                                                 Compared to the national level, the percent of confined
LONG-TERM FORECAST                                               males in New Mexico is greater for the age groups 30-34 and
Long-term forecasts are based upon current sentencing            35-39 (Figure 3). For age groups 18-19 through 25-29, 45-49,
statutes and current NMCD policies and practices. It is not      50-54, 60-64, and 65+, national percentages are larger. For
difficult to imagine that statutes, policies and practices may   age groups 40-44 and 55-59, confinement percentages are
be different ten years from the publication of this report.      similar.
Nevertheless, the long-term forecasts may contribute to
useful discussions among policy makers and criminal justice
professionals.

                                                                                                                                5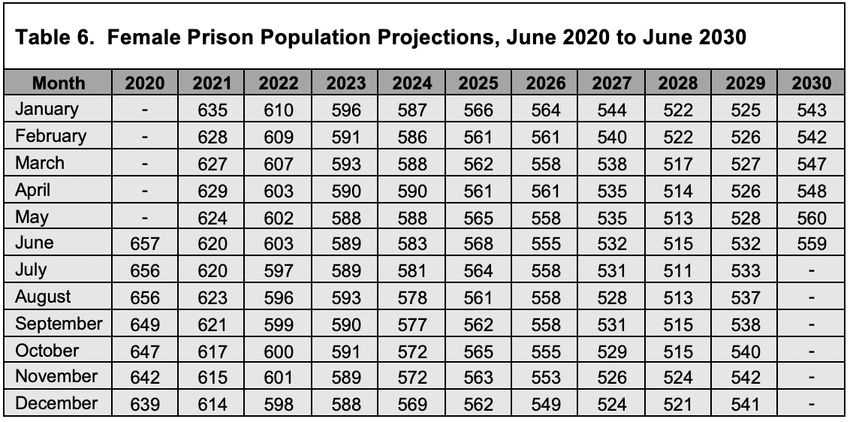
Confined female percentages (Figure 4) show that for           Figure 6 charts the same data for confined females. The
females, the largest percentage of inmates rest in the 30-34   largest percentage of female prisoners in FY 2019 are in
age group. From the 25-29 through 40-44 age groups, New        the 30-34 age group, though group percentages are below
Mexico confined female percentages outpace national            those recorded in FY 2017. Female age groups 20-24, 25-29,
levels. For age groups 18-19 and for 60-64 and 65+, New        and 40-44 saw an increase from FY 2017, relative to the total
Mexico and national values are similar. The remaining age      population. The percent of females in the 65+ group has
groups, 20-24 and 45-49 through 55-59, show national           remained relatively stable for the past three fiscal years.
percentages that are larger than those for New Mexico.         Confinement percentages by age and gender across the
                                                               three fiscal years are in Appendix A, Table 8.

For confinement percentages by age and gender see
Appendix A, Tables 7 and 8.                                    ADMISSIONS AND RELEASES
                                                               Figure 7 shows the relationship between admissions and
CONFINED AGE: NEW MEXICO
                                                               releases for male inmates relative to the monthly high
Figures 5 and 6 show age trends in New Mexico                  population for each month from April 2014 to March 2020.
confined populations, as measured on June 30 for the           Positive percentages indicate that admissions overtook
fiscal years 2017-2019. The greatest concentration of          releases during that month. Negative percentages indicate
inmates is in the age group 30-34 and 35-39, both with         that released outpaced admissions during that month.
19% of male inmates. The confined male populations             Historically, male admissions have outpaced releases, but
from 45-49 through 65+ years has remained relatively           there is an increase in months with net greater releases
stable throughout the FY 2017-FY 2019 time period.             beginning around April 2016. From March 2018 and
Confined percentages for 20-24 and 25-29 years                 continuing to present, the months showing greater net
of age have varied over the last three fiscal years.           releases became the majority over months with greater net
                                                               intake.

6                                                                                         New Mexico Sentencing Commission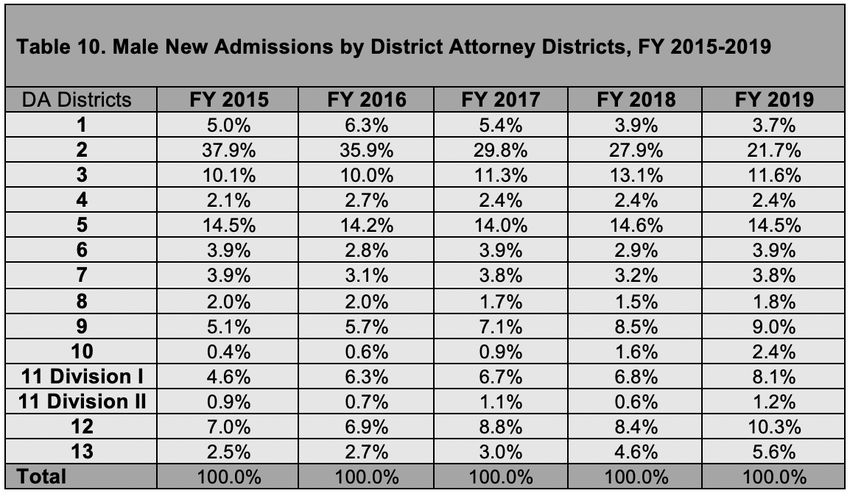
Figure 8 illustrates the same relationship between
admissions and releases for female inmates. Net admissions
are the majority for female populations up to about June
2018, although we do see more months in the female
population where net releases are higher compared to the
male population. Net releases overtake admissions during
the final four months of 2018. Admisions and releases
occur at similar rates for most of 2019. Despite an influx of
admissions in January 2020, net releases remained the norm
through most of 2019 and 2020.

                                                                NEW ADMISSIONS BY CHARGE TYPE
                                                                Figure 11 illustrates new male admissions by charge type
                                                                for fiscal years 2015 through 2019. That information is
                                                                presented for female new admissions in Figure 12. Tables 2
                                                                and 3, in Appendix A, provide additional details on charge
                                                                types for both genders.
                                                                The bulk of male new admissions result from violent, drug,
                                                                and property crimes. Admissions resulting from drug and
                                                                property crimes are at 5-year lows in FY 2019 across all
                                                                categories. Admissions for serious violent offenses (SVO)
NEW ADMISSIONS AND PAROLE ADMISSIONS                            have been decreasing steadily throughout the time period.
Figures 9 and 10 identify trends between new and parole-        After a high point in male public order charges in FY 2018,
related admissions for male and female inmates. Admissions      they have also reached a low point in FY 2019. Following
for new offenses outpace parole admissions throughout           a 3-year period of decline, charges for DWI experienced a
the time period, for both sexes. However irregular at the       slight bump in FY 2018, but have declined to the same level
start, variations between male new and parole admissions        as FY 2017, a 5-year low, in FY 2019.
begin to mirror one another in Q3 FY 2015. A similar trend is
present in Figure 10 beginning Q1 FY 2015.

 *Updated July 2020                                                                                                           7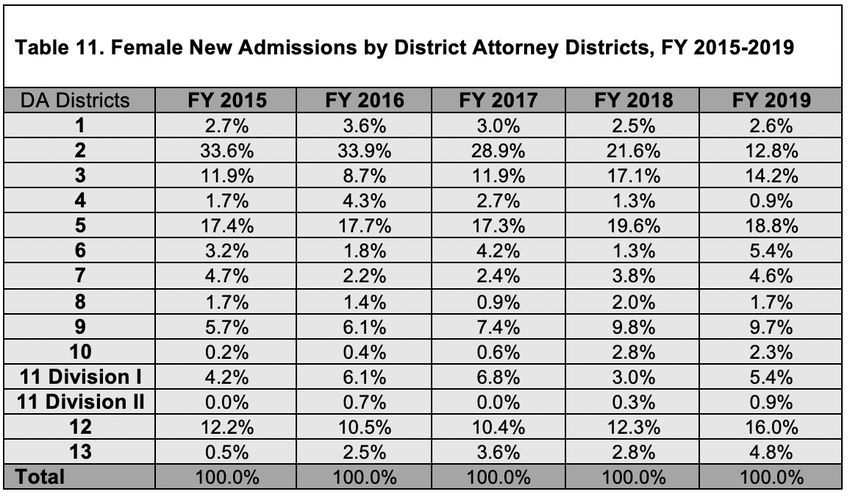
NEW ADMISSIONS BY RACE/ETHNICITY
                                                               Figure 13 shows the percentage of new admissions in FY
                                                               2019 by race/ethnicity. The majority of new admissions
                                                               in FY 2019 were Hispanic. There were proportionately
                                                               more female than male new admissions reported as White
                                                               non-Hispanic at 37% and 24% respectively. Black and Native
                                                               American new admissions were below 10% for both males
                                                               and females. Less than 1% of new admissions for both male
                                                               and female inmates are Asian/Pacific Islander.

Female new admissions are reduced in drug and property
crimes. In FY 2019, new admissions across all categories
are down from their levels in FY 2018. Charges for property
crimes are at their lowest after a downward trend over the
past five years. Violent crime charges amongst female new
admissions and SVO charges had been trending upwards
since FY 2016, but have declined, though not to new records.

New admissions by gender and charge type available for five
fiscal years are in Appendix A, Table 2 and 3.

8                                                                                        New Mexico Sentencing Commission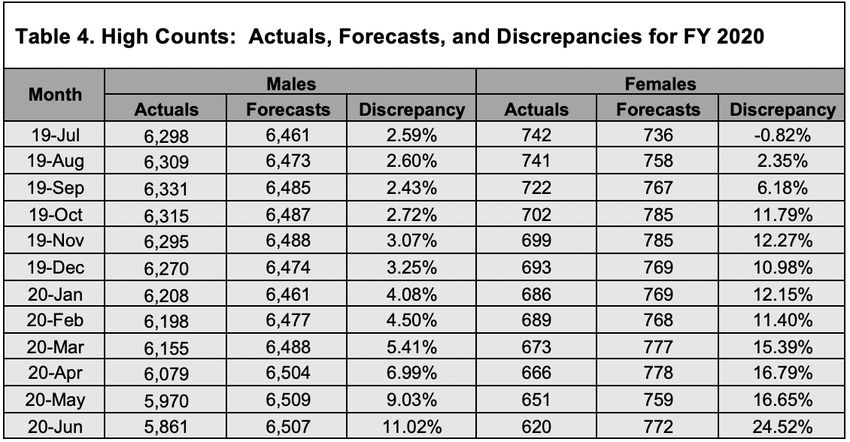
APPENDIX A
Appendix A contains tables and figures to supplement the Prison Population Forecast, as follows:
Table 2. Male Admissions by Crime, Fiscal Years 2015-2019
Table 3. Female Admissions by Crime, Fiscal Years 2015-2019
Table 4. High Counts: Actuals, Forecasts, and Discrepancies for FY 2020
Figure 14. Actual Male Prison Population and Forecast, July 2016 to July 2022
Table 5. Male Prison Population Projections, June 2020 to June 2030
Figure 15. Actual Female Prison Population and Forecast, July 2016 to July 2022
Table 6. Female Prison Population Projections, June 2020 to June 2030
Table 7. Percentage of Confined Population by Age: New Mexico (FY 2019) and Nationally (2018)
Table 8. Percentage of Confined Population by Age in New Mexico Across Time, FY 2017 to FY 2019
Figure 16. Total NM District Court Criminal Cases: New, Reopened, and Disposed from FY 2001 to FY 2019
Table 9. New Mexico District Court Criminal Cases, FY 2000 to FY 2019
Table 10. Male New Admissions by District Attorney Districts, FY 2015-2019
Table 11. Female New Admissions by District Attorney Districts, FY 2015-2019

                                                                                                         9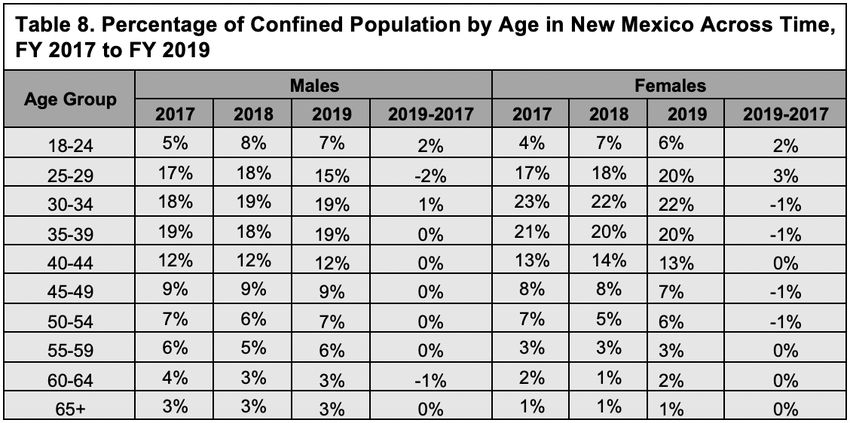
10 New Mexico Sentencing Commission
11
12 New Mexico Sentencing Commission
13
NEW MEXICO JUDICIARY DATA

14                          New Mexico Sentencing Commission
15
APPENDIX B: METHODOLOGY
This report applies historical observations of prison            MALES
population data to generate the figures included in the          High counts for male prison populations have been
forecasts. NMSC maintains a dataset of daily totals for male     decreasing sharply since August 2018. The current forecast
and female prisoners in New Mexico. Monthly high counts          captures that trend with a historical sample that begins in
are extracted from those data to produce a complete sample       July 2016 and ends in May 2020. Forecasts are generated
spanning January 2001 to the current month.                      through a model specified with a two-month lag in new
It is understood that many factors drive prison populations,     admissions, one- and zero-month lags of parole-related
including demographic trends, arrest rates, the number           admissions, and an AR(3) term. Between July 2018 and May
of criminal cases filed in district courts, conviction rates,    2020, all prisoner population forecasts are within 3% of
the availability of diversion programs, sentence lengths,        actual observations.
admission and release rates, the availability of earned          FEMALES
meritorious deductions, and parole readiness. The observed
prison population is a result of all those factors and others.   Female prison populations have also entered an unusual
When new laws or polices come to bear which significantly        period of decline, beginning in November 2018. There are,
affect the prison population, it is recommended that a new       however, similar patterns of increase/decrease that have
long-term forecast be produced to incorporates new data          been ongoing since August 2015, where population highs
that reflects those changes.                                     reach near-800 female prisoners before quickly dropping to
                                                                 near-750. Prior to that, a section of stable growth begins at
Time series forecasting consists of examining historical         the start of 2010.
prison population data, identifying potential methodologies,
fitting the data, and testing the model. Testing includes        To represent historical growth trends and recent
a comparison of descriptive statistics for each model to         fluctuations, the female forecast sample begins in January
establish the best-fitting specification. Then, projections      2014 and terminates in May 2020. This model applies one-
are evaluated against actual observations to determine the       and zero-month lags of new admissions, one- and two-
accuracy of each model. Diagnostic checks are applied to         month lags of parole-related admissions, a contemporary
the differences between forecast estimates and observed          (zero-month lag) median sentence length term, AR terms
values to ensure that a model adequately explains trends in      at 1, 2, and, 3, and a MA(5) term. Furthermore, a dummy
the data.                                                        variable was included to capture the trend marked by an
                                                                 increase of prisoners, beginning in June 2014, and the
It is possible for historical trends to be well-represented      decline that has followed. Between July 2018 and May 2020,
by more than one model. Though diagnostic checks are             forecast populations are within 3% of observed figures in all
imperative for selecting the most precise specification, the     but three instances.
present methodology requires augmentations at various
steps to incorporate details from conversations with
Sentencing Commission staff which detail upcoming issues
that may influence prison populations/patterns.
Historical observations in male and female datasets are
differenced once to induce stationarity. Male and female
forecasts are then modeled separately using linear transfer
functions employing new admissions, parole-related
admissions, and median sentence lengths as regressors.
Cross-correlation functions between dependent and
independent variables are generated to help specify lag
structures. Autocorrelation functions are then applied to
determine autoregressive (AR) and moving average (MA)
terms.
New admissions, parole-related admissions, and median
sentence lengths are forecast to June 2030 to complete total
prison population projections up to that date. Historical
data for new and parole-related admissions begins in July
2004 and terminates in March 2020. Median sentence length
observations span from January 2014 to March 2020. As
stationary series, averages from each regressor’s entire data
set are applied as the forecast value ranging from April 2020
to June 2030.

16                                                                                           New Mexico Sentencing Commission
REFERENCES
Denman, K. (2015). Prison Program Utilization and Recidivism Among Female Inmates in New Mexico.
U.S. Department of Justice. (2020). Prisoners in 2018 (Bureau of Justice Statistics Bulletin NCJ253516). Washington, DC: Govern-
ment Printing Office.
U.S. Department of Justice. (2018). Correctional Populations in the United States, 2016 (Bureau of Justice Statistics Bulletin NCJ
251211). Washington, DC: Government Printing Office.
Ahalt, Cyrus, et al. (2013) “Paying the price: the pressing need for quality, cost, and outcomes data to improve correctional health
care for older prisoners.” Journal of the American Geriatrics Society 61.11.
Luallen, Jeremy, and Ryan Kling. (2014) “A method for analyzing changing prison populations: explaining the growth of the elderly
in prison.” Evaluation review 38.6: 459-486.
Kim, KiDeuk, and Bryce Peterson. (2014). “Aging behind bars: trends and implications of graying prisoners in the federal prison
system. Urban Institute.
Pew Charitable Trusts. 2014. Prison Population Continues to Age. Oct. 3. https://www.pewtrusts.org/en/research-and-analysis/arti-
cles/2014/10/03/prison-population-continues-to-age.
Pew Charitable Trusts. 2018. Aging Populations Drive Up Costs. Feb. 20. https://www.pewtrusts.org/en/research-and-analysis/arti-
cles/2018/02/20/aging-prison-populations-drive-up-costs.
17You can also read