Report: Vaccination and reopening in Canada - News 1130
←
→
Page content transcription
If your browser does not render page correctly, please read the page content below
Report: Vaccination and reopening in Canada

                     P. Tupper, Y. Song, N. Mulberry, C. Colijn

                                          April 2021

                                            Abstract

         In this report we provide modelling results for the question of when, and to what
     extent, Canada will be in a position to relax social distancing measures as a result
     of vaccination. We find that even after current vaccination plans are finished, we
     cannot reopen without substantial rises in cases and hospitalizations (500 per 100K
     populations over the first half of 2022) and deaths. Only a small portion of Canada
     is expected to have had COVID-19 and developed immunity naturally by this time.
     Furthermore, a substantial portion of the population will be unprotected by vaccina-
     tion at the end of current vaccination plans: children, adults who decline the vaccine,
     and those for whom the vaccine did not prevent infection (though they may be con-
     siderably protected from symptomatic disease and severe outcomes). This prevents
     herd immunity for realistic values of R without social distancing measures remaining
     in place. This is under optimistic assumptions that effective vaccination and natural
     immunity protect completely against reinfection, and that immunity does not wane
     over time. It also assumes that vaccine efficacy will remain as high as it is today (and
     will not be undermined by the existence and emergence of VOC that escape immu-
     nity). We explore the impact of vaccinating those aged 12-19 and the impact of VOC.
     We conclude with a series of recommendations. The situation can be improved by i)
     vaccinating children, ii) decreasing vaccine hesitancy, iii) maximizing vaccine efficacy.
     The situation is worsened if current vaccines are significantly less effective with the
     new variants.

Introduction

A variety of highly effective vaccines against COVID-19 have been developed and are be-
ing deployed in Canada. Under current vaccination plans all adult Canadians who want
the vaccine will get both doses by the end of summer 2021. In the meantime COVID-
19 numbers are kept under control in most of the country with a combination of social
distancing and other NPIs, including contact tracing. We investigate what are the conse-
quences of relaxing control measures at various points during the vaccine rollout as well

                                                1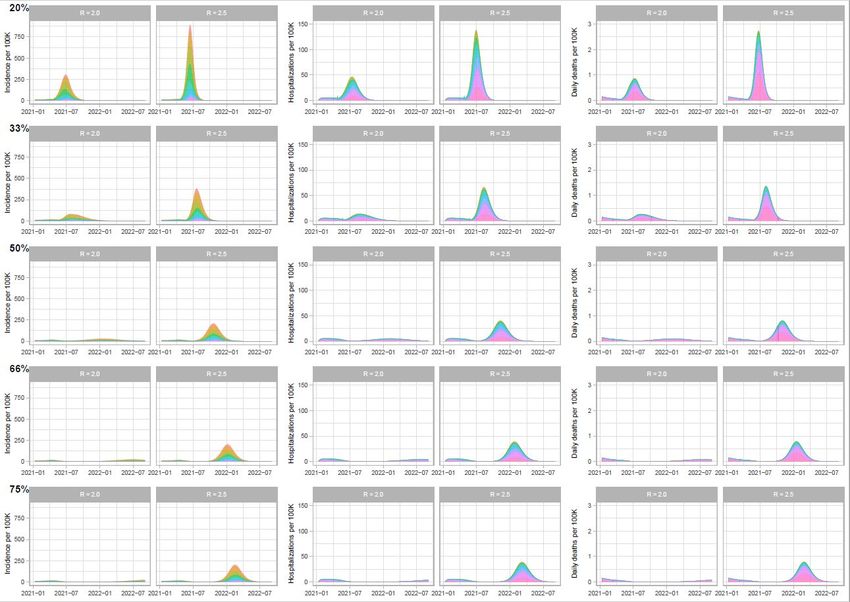
as after the rollout is complete. For scenarios of reopening after a complete rollout, we
explore the breakdown of the age groups and vaccination status of those who become
infected and hospitalized. We examine the impact of vaccinating those aged 12-19, and
of VOC for which vaccines have reduced efficacy. We then compare our results with sim-
ple calculations based on herd immunity in SIR models and find good agreement. The
simpler model allows us to investigate the impact that changes to vaccination plans, in-
cluding the possibility of vaccinating younger children, have on our results. Our study
is similar to one performed for the UK [1], and we obtain similar results, but investigate
several ways to overcome the generally pessimistic picture obtained there.

Methods

Model: We use the model presented in our work on vaccination [2]. We model a Canadian
population, presenting results per 100K population for infections, hospitalizations and
deaths.
Relaxation: We simulate relaxing restrictions to two levels: to R = 2 , (where R reflects the
effective reproductive number in the absence of vaccination) and to R = 2.5. We simulate
relaxing restrictions when we have immunized a given percent of the population, and
also in September when all adults who wish to be vaccinated have been.
Rationale for R = 2, 2.5: While we do not know the reproductive number for COVID-
19 in Canada in the absence of social distancing restrictions, estimates range from 2–
4 for non-VOC COVID-19. By September, the VOC B.1.1.7 will likely predominate in
Canada, unless other VOC have an advantage in immunized populations. B.1.1.7 has a
higher transmission rate than previously-predominant COVID-19, which would increase
R. However, we model the maintenance of symptomatic testing and contact tracing,
which can reduce R by 1/3 if done rapidly, optimally, and with the capacity to scale up as
cases rise [3].
Vaccine acceptance: We model acceptance of vaccination from 72% in the younger age
groups to 84.7% in the older age groups according to PHAC-provided summaries of two
Canadian surveys. We then explore higher acceptance.
Vaccine efficacy: In our model vaccine efficacy consists of two components: ve, efficacy
against infection (what fraction of infections are prevented) and vp, efficacy against symp-
toms when infection does occur (what fraction of cases infected after vaccination do not
have symptoms, including severe outcomes). To have a symptomatic case after vaccina-
tion, the vaccine has to both fail to prevent disease and symptoms, so efficacy against
symptomatic infection is vd = 1 − (1 − ve)(1 − vp). We take our baseline values from the
studies on the Pfizer vaccine, giving vd = 95% protective against symptomatic infection
[4] and ve = 80% protective against infection [5], implying a value of vp = 75%.
If the vaccine fails to protect against infection in an individual, but does prevent symp-
toms, in our model the individual is assumed to contract the virus and transmit to others

                                             2
at the same rate as an unvaccinated individual. It is likely that those who are vaccinated
but infected anyway are less infectious due to lower viral loads than those who are in-
fected without vaccination, and it is likely that they would not have symptoms. In a
framework where testing is driven by symptoms and those with symptoms are encour-
aged to isolate, asymptomatic individuals will not know they are ill and will likely remain
circulating and infectious for longer than those who develop symptoms. Thus, longer du-
ration of infectiousness (vaccinated-but-infected individuals may transmit more because
they do not have symptoms and therefore do not isolate), and lower per-unit-time trans-
mission (due to a reduced viral load) act in opposing directions. In our model we allow
these to balance out.
We explore the effect of the emergence of a vaccine escape variant that has substantially
lower efficacy against infection, with an alternate set of parameters ve = 50%, vp = 75%,
vd = 87.5%.
Infections vs Cases: Our model estimates the number of infections rather than the num-
ber of reported cases. In a mostly unvaccinated population, the number of cases is deter-
mined by the ascertainment fraction, which in turn depends on the fraction of infections
that are symptomatic (as well as test-seeking behaviour, test availability and testing el-
igibility). Among vaccinated individuals who still become infected, we expect a higher
fraction of asymptomatic individuals, and so there is not a straightforward relation be-
tween infections and cases over time. Our estimates of hospitalizations and deaths do
factor in imperfect ascertainment and varying rates of asymptomatic infection, and so
can be compared to publicly available data.
Vaccine rollout: Following the proposed rollout in the PHAC-provided document for ex-
ternal modellers, we vaccinate 80+ and LTC (not modelled explicitly, but hospitalization
and death rates are adjusted to reflect protection in LTC) in the first 60 days at which time
those 80+ are vaccinated up to acceptance, and we proceed at a faster pace of 0.45% /day
to vaccinate first those aged 70-79, then those aged 60-69 and essential workers (about
10% of the population). We proceed with an age-based rollout after that time.
Results
Reopening prior to completion of vaccine rollout
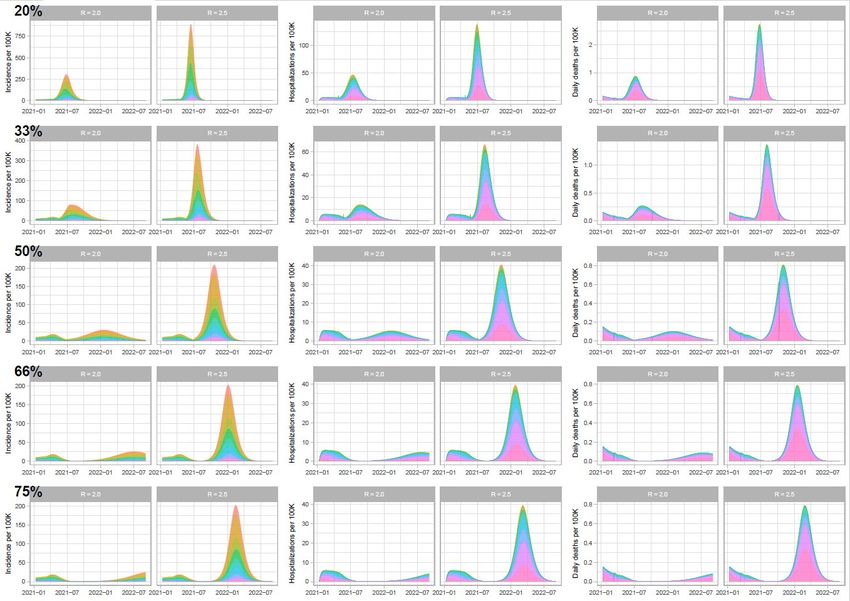
Figure 1 shows the simulated outcome if we relax measures to R = 2 or 2.5 when a
fixed percent of the population is vaccinated, according to the age- and contact-based
rollout. We find that reopening ”fully” to R = 2.5 before vaccination is complete leads
to rises in infections, hospitalizations and deaths. In each case, hospitalizations exceed
the capacity (just under 40 per 100K) but reopening when 75% are vaccinated does not
exceed this by much. After reopening when more than 50% are vaccinated, the 10-19
year age group experiences a higher portion of the infections (as they are not included
3in the current vaccine rollout). Reopening only to R = 2 is more optimistic and would
represent a substantial relaxation of measures compared to the current circumstance, but
distancing would likely still need to be in place. The mapping between social distancing
and R depends on the circulating variant, the use of tests for screening, the effectiveness
of contact tracing and other mitigation measures. In our estimates, the B.1.1.7 VOC would
likely have an R well above 3 in Canada (in the absence of vaccination), making 2.5 a more
realistic target to explore ”full reopening” than R = 2.
Figure 1: Reopening at the time when (from top to bottom) (20%, 33%, 50%, 66%, 75%)
of the population is vaccinated. We compare reopening to R = 2 (left panels) and R =
2.5 (right panels), and show predicted infections, hospitalizations and deaths per 100K
population. The colour fill represents age — colours represent age groups 0-10 (red),
10-19 (orange), and so on progressing to 80+ (pink). See Appendix for a version with
variable y axes for clarity.
4Reopening in September 2021 after rollout is complete
We turn to exploration of the severity and risk breakdown of the post-September peak
if we reopen after vaccination is complete up to vaccine acceptance. We find that under
our baseline vaccine efficiency assumptions, even after most of the rollout is complete,
we will not be in a position to reopen without seeing rising cases; in other words we will
not have reached ”herd immunity” to R = 2.5.
Figure 2 shows two reopening scenarios, one in which the R to which we reopen is 2, vs
2.5 in the other scenario. Reopening to R = 2 or R = 2.5 still leads to numerous cases,
hospitalizations and deaths after September. The impact of vaccination on hospitalization
and death is considerable under our baseline assumptions for the efficacy, and the peak in
hospitalizations may not exceed capacity (approximately 30-40 per 100K) by very much.
If we maintain controls that leave R at 2 indefinitely, the second peak happens much later.
On that time frame, however, we would need to consider waning immunity from natural
infection and from vaccination (not modelled here).
Reopen to R = 2 Reopen to R = 2.5 Reopen to R = 2 Reopen to R = 2.5 Reopen to R = 2 Reopen to R = 2.5
200 40
0.75
Hospitalizations per 100K
Daily deaths per 100K
Incidence per 100K
150 30
0.50
100 20
0.25
50 10
0 0 0.00
01−21 07−21 01−22 07−22 01−21 07−21 01−22 07−22 01−21 07−21 01−22 07−22 01−21 07−21 01−22 07−22 01−21 07−21 01−22 07−22 01−21 07−21 01−22 07−22
0−9 20−29 40−49 60−69 80+
age_band
10−19 30−39 50−59 70−79
Figure 2: Reopening in September, comparing reopening to R = 2 and R = 2.5. Both
permit later growth of infections, but the transient is very long when we reopen to R = 2
because it is near the critical threshold.
In the R = 2.5 case we show the distribution of infections and hospitalizations by age
and vaccination status in Figure 3. Overall, reopening to R = 2.5 would result in approx-
imately 500 hospitalizations per 100K population before the post-September 2021 peak
subsides. Since ages 0-19 are not vaccinated in the current plans, they are left unprotected
in this scenario and see rises in infection. Their rates of severe COVID-19 disease are
low, so they are not highly represented in hospitalizations. Those hospitalized are, unsur-
prisingly, primarily those who declined vaccination. There is some contribution from the
minority of those vaccinated whom vaccination did not protect, and from those who were
vaccinated after infection. We anticipate that the impact on those who declined the vac-
cine would be widely reported, and vaccine acceptance would likely increase as a result.
This modelling does not take that effect into account.
56000 100
Hospitalizations per 100K total pop
Infections per 100K total pop
75
4000
50
2000
25
0 0
0−9 10−19 20−29 30−39 40−49 50−59 60−69 70−79 80+ 0−9 10−19 20−29 30−39 40−49 50−59 60−69 70−79 80+
Protection Unvaccinated Vaccinated after exposure Vaccinated but not protected
Figure 3: If reopening to R = 2.5 in September proceeds, the model predicts substantial
hospitalizations and infections. Infections reflect the fact that ages 0-19 are not currently
in the vaccination rollout plan; hospitalizations reflect the impact of age-specific risk and
hesitancy. Numbers are taken from the post-September 2021 peak in the right hand panels
of Figure 2
.
6Vaccination of those aged 10–19
If we include children aged 10-19 in the vaccination we can reopen to R = 2.5 essentially
safely, under the assumption that we can reach only 70% of this age group (with Pfizer
currently explored in those over 12, for example). Figure 4’s top panels compare the
impact of vaccinating 70% of the 10-19 age group with not doing so (original rollout) if
we reopen to R = 2.5 in September. The model is not quite below the critical threshold, so
there is a very small rise in cases. As the model is so near the threshold, whether cases rise
or fall is sensitive to hesitancy, the contact matrix, the vaccine efficacy against infection
and other uncertainties. We note that these results depend on 10–19 year-olds being fully
vaccinated before reopening in September 2021. This may not be feasible given the time
it will take for vaccinating children in that age bracket to get regulatory approval.
Reopen R = 2.5 Reopen R = 2.5, w. 10−19 Reopen R = 2.5 Reopen R = 2.5, w. 10−19 Reopen R = 2.5 Reopen R = 2.5, w. 10−19
200 40
0.75
Hospitalizations per 100K
Daily deaths per 100K
Incidence per 100K
150 30
0.50
100 20
0.25
50 10
0 0 0.00
01−21 07−21 01−22 07−22 01−23
01−21 07−21 01−22 07−22 01−23 01−21 07−21 01−22 07−22 01−23
01−21 07−21 01−22 07−22 01−23 01−21 07−21 01−22 07−22 01−23
01−21 07−21 01−22 07−22 01−23
0−9 20−29 40−49 60−69 80+
age_band
10−19 30−39 50−59 70−79
Figure 4: If we can vaccinate 70% of those aged 10-19 we greatly reduce the negative
outcomes of reopening at R = 2.5, but we still see rising cases in the model. The peak
is approximately half the size (right vs left panels, top row). The lower panels illustrate
the breakdown of infections and hospitalization by age with vaccinating 10-19 year-olds,
among cases after July 2021 (the post-September peak).
.
7Variants of concern: the impact of reduced efficacy
We explore the impact of reduced efficacy against infection (ve= 0.5 instead of 0.75). As
expected this has a high impact, and threatens COVID-19 control even if those aged 10-19
are vaccinated. One rationale for considering lower efficacy is the continued emergence
and spread, in Canada, of variants of concern (VOC) that may undermine vaccination
as a COVID-19 control strategy. At the current time, evidence suggests that antibody
neutralization is not as effective for VOC B.1.351 [6] and P.1 [7] as it is for the SARS-CoV-2
variants we have seen to date (including B.1.1.7). Figure 5 illustrates the results.
0−9 20−29 40−49 60−69 80+
age_band
10−19 30−39 50−59 70−79
Reopen R = 2.5 Reopen R = 2.5 w VOC Reopen R = 2.5 Reopen R = 2.5 w VOC Reopen R = 2.5 Reopen R = 2.5 w VOC
3
100
400
Hospitalizations per 100K
Daily deaths per 100K
2
Incidence per 100K
200 50
1
0 0 0
01−21 07−21 01−22 07−22 01−21 07−21 01−22 07−22 01−21 07−21 01−22 07−22 01−21 07−21 01−22 07−22 01−21 07−21 01−22 07−22 01−21 07−21 01−22 07−22
Hospitalizations per 100K total pop
200
Infections per 100K total pop
4000
150
100
2000
50
0 0
0−9 10−19 20−29 30−39 40−49 50−59 60−69 70−79 80+ 0−9 10−19 20−29 30−39 40−49 50−59 60−69 70−79 80+
Protection Unvaccinated Vaccinated after exposure Vaccinated but not protected
Figure 5: VOC that result in lower vaccine efficacy seriously threaten the ability of vacci-
nation to control COVID-19. Top: we compare reopening in September 2021 without (left
panels) and with (right panels) a VOC whose efficacy against infection is 0.5 (instead of
0.75) and against disease is 0.8 (instead of 0.9). Despite vaccinating those 10-19, we are
now no longer resilient to reopening at R = 2.5. Note that there are more infections over-
all (in the VOC scenario - bottom panels), and more of them occur in those vaccinated but
unprotected, due to the reduced efficacy.
.
8Increasing vaccine acceptance
Finally, we explore the impact of reducing hesitancy by 50% in all age groups, so that at
least 85% of all eligible groups are vaccinated. We include those aged 10-19, and perform
the VOC simulation (lower efficacy against transmission but still an overall 87.5% efficacy
against symptomatic disease). Figure 6 shows the results.
0−9 20−29 40−49 60−69 80+
age_band
10−19 30−39 50−59 70−79
R = 2.5 w VOC R = 2.5 w VOC, low hes R = 2.5 w VOC R = 2.5 w VOC, low hes R = 2.5 w VOC R = 2.5 w VOC, low hes
3
100
400
Hospitalizations per 100K
Daily deaths per 100K
2
Incidence per 100K
200 50
1
0 0 0
01−21 07−21 01−22 07−22 01−21 07−21 01−22 07−22 01−21 07−21 01−22 07−22 01−21 07−21 01−22 07−22 01−21 07−21 01−22 07−22 01−21 07−21 01−22 07−22
4000
Hospitalizations per 100K total pop
Infections per 100K total pop
100
3000
2000
50
1000
0 0
0−9 10−19 20−29 30−39 40−49 50−59 60−69 70−79 80+ 0−9 10−19 20−29 30−39 40−49 50−59 60−69 70−79 80+
Protection Unvaccinated Vaccinated after exposure Vaccinated but not protected
Figure 6: If we reduce hesitancy by 50% and vaccinate those aged 10-19 (to 85%) this still
does not control a VOC with a 0.5 efficacy against infection (and a 0.8 efficacy against
symptomatic disease). Top row: left panels show the situation with a VOC as in Figure 5;
right panels show the same but with vaccine hesitancy only half the PHAC survey-based
estimates. The resulting case rises still exceed hospital capacity. If the efficacy against
severe outcomes were less than 0.8 it would exceed it further
.
9Herd Immunity Calculations
We compare the age- and contact-structured model’s results to what we obtain from a
simpler (SIR) model of herd immunity. This simple model can be used to quickly test
the effect of changing assumptions about vaccine acceptance, vaccine efficacy, and the
transmissibility of new variants. Figure 7 illustrates that the model’s requirements for the
fraction protected at the herd immunity threshold is similar to the theoretical prediction
for a simple model. Further details including the dependence of this relationship on the
rollout, in the time between now and completion of the rollout, can be found in [2].
We can estimate whether a given level of immunity obtained through vaccination is suffi-
cient to stop the spread of COVID-19 using the classic relationship in SIR models between
minimum herd immunity fraction f and reproductive number R: f = 1 − 1/R. In a juris-
diction where 20% of the population declines the vaccine, and 20% are under the age of
20, and we have a vaccine that is 80% effective against infection, the fraction of the popu-
lation that is immune from vaccination alone is f = (1 − 0.2)(1 − 0.2)0.8 = 51.2%. Given
a fraction that are immune (either by successful vaccination or via natural infection), we
can compute the R∗ to which that fraction confers herd immunity: R∗ = 1/(1 − f ). With
f = 51.2%, we would have herd immunity only up to R∗ = 2.05. Accounting for approxi-
mately 5% of Canadians having had COVID-19 prior to September, 2021, we would have
f = 56% and we would be resilient to R∗ ∼ 2.3. In a simple SIR model, if we wish to
reopen to a higher R without rises in cases, additional immunity will have to be attained
through natural infection, vaccination of some portion of those aged 0-19, higher efficacy
against transmission or higher vaccine acceptance.
On the other hand, if children aged 10 and up are vaccinated (approximately 90% of the
population in total), the fraction that obtains immunity from the vaccine is 0.9 × 0.8 ×
0.8 = 57.6%. This gives herd immunity at R∗ = 2.36, or 2.67 accounting for 5% natural
immunity through infection in the meantime. This is more likely to be attainable with-
out extensive social distancing, even with the new more transmissible variants. Reducing
hesitancy and finding a way to increase vaccine efficacy against infection will also raise f
and increase the value R∗ that we can open to without increased infection in the popula-
tion. For example, some recent results from the UK show vaccine acceptance rates as high
as 95% [8] among those aged 55 and up. If we could attain this in Canada for everyone
aged 10 and up, our estimate shows that we could reopen to an R∗ of 3.76 (assuming 5%
immunity through infection).
100.6
Proportion of Population
0.4
0.2
1.0 1.5 2.0 2.5 3.0 3.5
R
Age and contact model Theory
Figure 7: Our age- and contact-structured model is very similar to a simple SIR model in
terms of the fraction of the population that must either be infected naturally (in the E, I
or R classes) or vaccinated successfully in order for the number of infections to begin to
decline. This is the so-called ”herd immunity” fraction. The theoretical result (blue) is
simply 1 − 1/R. The model result is obtained by running a simulation at the given R, as
always defined in the absence of vaccination, detecting when infections begin to decline,
and obtaining the portion of the population either infected or successfully vaccinated at
that time.
11Conclusions and recommendations
Our simulations indicate that herd immunity (enough of the population protected from
infection for the incidence to drop without other interventions) is not attained with cur-
rent vaccination plans, and with realistic long-term values of R. This means that substan-
tially relaxing measures even after the vaccine rollout is complete will likely lead to rising
cases, hospitalizations and deaths. The difficulty is that children, adults who decline the
vaccine, and adults for whom the vaccine did not prevent infection are numerous enough
that the pandemic will unfold among them once restrictions are lifted. This is under opti-
mistic assumptions that immunity does not wane, that those who have recovered are not
at all susceptible to reinfection, and that VOC for which vaccines are less effective than
current estimates for the mRNA vaccines are not circulating.
Our models do not account for imported cases or long-term effects such as demograph-
ics and waning immunity. We assume that those who have recovered are completely
protected from reinfection (which is optimistic), as are those who are vaccinated success-
fully. This modelling also does not capture heterogeneity in contact (beyond essential
workers— for example congregate settings). Accounting for these, we would anticipate
that even after ”herd immunity” there would still be some low level of COVID-19 in
Canada. This level could rise again if immunity wanes.
Our results indicate that Canadian populations would benefit greatly from vaccinating
those aged 10-19 (we use 12 because that is the minimum age in the recent trials of the
Pfizer vaccine among adolescents [9]). This result would extend to younger groups if this
becomes an option. At current estimates of vaccine hesitancy and transmission, vaccinat-
ing the 12 − 19 age group makes a safe reopening to an R = 2.5 scenario possible (with R
measured in the absence of vaccination). Such reopening would combine a range of non-
distancing public health measures such as testing and contact tracing with the increased
transmissibility we anticipate due to the establishment of VOCs. Without a majority of
the 12-19 age group vaccinated, even after vaccine rollout is complete, substantial rises in
cases occur, reaching or exceeding hospital capacity.
If VOC like P.1, which emerged in Brazil and rapidly grew to become the predominant
type of COVID-19 there, lead to vaccination having a reduced efficacy this will challenge
vaccination’s ability to serve as a path out of the pandemic for Canada. Data suggest
that P.1 can reinfect those who have been infected naturally [10], but as vaccination has
not reached populations with large numbers of P.1 infections, and trials to estimate vac-
cine efficacy against P.1 have not been completed, the impact of vaccination on P.1 is not
established. This leaves Canada in the position of having allowed P.1 to establish itself
here, while we rely on vaccination as our leading pandemic exit strategy, without know-
ing how effective vaccination will be against this VOC. Data on effectiveness against the
B.1.1.7 VOC that emerged in the UK is better and the picture is more optimistic, with both
mRNA vaccines and the AstraZeneca vaccine showing good results.
Vaccination is relatively new to the SARS-CoV-2 virus, which has primarily experienced
selection in favour of enhanced transmission. Indeed, this selection played a role in the
12rapid emergence of several VOC including both B.1.1.7 and P.1. However, as populations
across the world become vaccinated, SARS-CoV-2 will face increased selection in favour
of immune escape, and decreased selection for higher transmissibility. SARS-CoV-2 re-
mains a relatively new virus, and we should anticipate that it will evolve further. Ac-
cordingly, P.1 and other known VOC at this time will not likely remain the key threats to
vaccination’s effectiveness in ending the pandemic.
Recommendations
1. Vaccinate children as soon as safely possible, starting with adolescents
2. Take steps to increase vaccine acceptance- for example, provide convenient access
to vaccination and outreach to communities, and provide clear and consistent mes-
saging addressing concerns.
3. Deploy vaccines and consider boosters so as to achieve the highest possible effi-
cacy, with attention to preventing infection (not only preventing disease and severe
outcomes)
4. Monitor VOC numbers and spread within Canada, pooling data at the national level
5. Act strongly to reduce transmission of those VOC for which we have reason to think
there is immune escape and for which we do not know the effectiveness of current
vaccines (e.g. P.1 and other potential immune escape variants)
6. Monitor the global situation for emerging immune/vaccine escape variants
7. If such variants arise, act at borders to prevent them from becoming established in
Canada
8. Recognize that (1)-(7) may not be feasible and we may face VOC for which vaccina-
tion is insufficiently effective
9. Develop alternative approaches to managing the pandemic as a backup plan. These
could include widespread use of rapid (possibly home) tests along with support for
heeding the tests’ results, and sustained measures to keep R < 1 for all variants
while relying on border measures to prevent introductions.
13Appendix
Figure 8: As in Figure 1 but with y axes left flexible instead of fixed as the percent vacci-
nated at the time of reopening increases. Reopening at the time when (from top to bot-
tom) (20%, 33%, 50%, 66%, 75%) of the population is vaccinated. We compare reopening
to R = 2 (left panels) and R = 2.5 (right panels), and show predicted infections, hos-
pitalizations and deaths per 100K population. The colour fill represents age — colours
represent age groups 0-10 (red), 10-19 (orange), and so on progressing to 80+ (pink).
References
[1] Moore S, Hill EM, Tildesley MJ, Dyson L, Keeling MJ. Vaccination and non-
pharmaceutical interventions for COVID-19: a mathematical modelling study.
Lancet Infect Dis. 2021 Mar.
[2] Mulberry N, Tupper P, Kirwin E, McCabe C, Colijn C. Vaccine Rollout Strategies:
The Case for Vaccinating Essential Workers Early. medRxiv. 2021. Available from:
https://www.medrxiv.org/content/early/2021/02/25/2021.02.23.21252309.
[3] Tupper P, Otto S, Colijn C. Fundamental Limitations of Contact Tracing for COVID-
19. medRxiv. 2020. Available from: https://www.medrxiv.org/content/early/
2020/12/18/2020.12.15.20248299.
14[4] Polack FP, Thomas SJ, Kitchin N, Absalon J, Gurtman A, Lockhart S, et al. Safety
and Efficacy of the BNT162b2 mRNA Covid-19 Vaccine. N Engl J Med. 2020
Dec;383(27):2603–2615.
[5] Tande AJ, Pollock BD, Shah ND, Farrugia G, Virk A, Swift M, et al. Impact of the
COVID-19 Vaccine on Asymptomatic Infection Among Patients Undergoing Pre-
Procedural COVID-19 Molecular Screening. Clin Infect Dis. 2021 Mar.
[6] Wu K, Werner AP, Koch M, Choi A, Narayanan E, Stewart-Jones GBE, et al. Serum
Neutralizing Activity Elicited by mRNA-1273 Vaccine. N Engl J Med. 2021 Mar.
[7] Dejnirattisai W, Zhou D, Supasa P, Liu C, Mentzer AJ, Ginn HM, et al. Antibody
evasion by the Brazilian P.1 strain of SARS-CoV-2; 2021. BioRxiv.
[8] Department of Health and Social Care. UK moves into next
phase of vaccine roll-out as government target hit early; 2021.
Accessed: 2021-4-15. https://www.gov.uk/government/news/
uk-moves-into-next-phase-of-vaccine-roll-out-as-government-target-hit-early.
[9] Chappell B. Pfizer Says COVID-19 Vaccine Shows ’100% Efficacy’ In Adolescents.
NPR. 2021 Mar.
[10] Sabino EC, Buss LF, Carvalho MPS, Prete CA Jr, Crispim MAE, Fraiji NA, et al. Resur-
gence of COVID-19 in Manaus, Brazil, despite high seroprevalence. Lancet. 2021
Feb;397(10273):452–455.
15You can also read