EUROPEAN FISCAL MONITOR - June 2021 - EU IFIs
←
→
Page content transcription
If your browser does not render page correctly, please read the page content below

EUROPEAN FISCAL MONITOR
                           June 2021

The Network of Independent Fiscal Institutions, Place du Congrès 1, 1000, Brussels
         Tel: +32 (0) 2 229 39 87, www.euifis.eu, secretariat@euifis.eu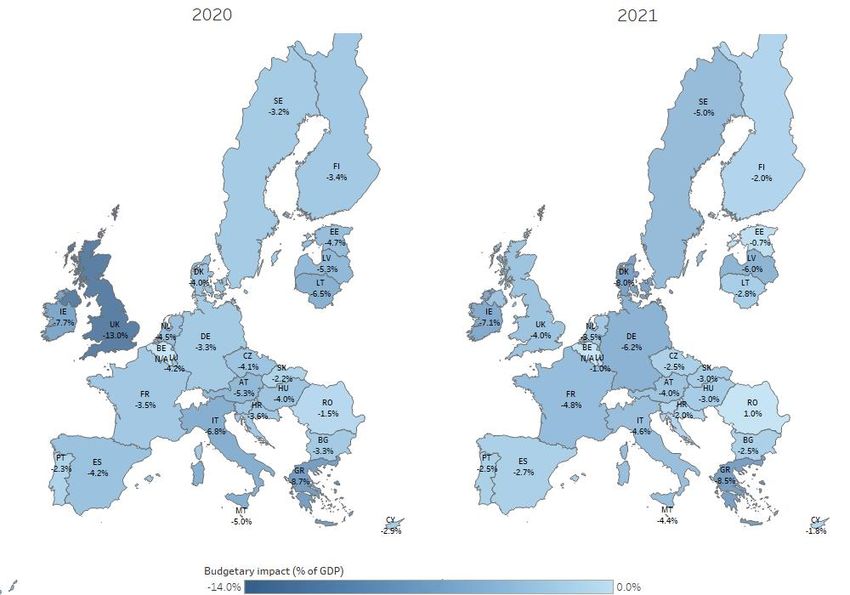
Executive summary
Short-term outlook for public finances
   •    European economies expect a strong economic recovery in 2021 from the Covid-19 crisis.
        According to spring 2021 forecasts, real GDP is expected to grow on average by around 3% in 2021.
   •    Covid-19-related fiscal measures and automatic stabilisers are having a large impact on
        government deficits in 2021. General government deficits are expected to average 7% GDP in 2021.
   •    Public finances in most European countries remain supportive in 2021 as countries are
        transitioning from first-aid fiscal measures to promoting economic recovery.
Medium-term outlook for public finances
   •    European economies expect a favourable growth scenario in the medium term. According to spring
        2021 forecasts, real GDP is expected to grow on average around 3% per annum between 2021 and
        2024.
   •    Public deficits in most countries will remain at or above the 3% reference value in 2024.
   •    Some of the national independent fiscal institutions (IFIs) that assessed national stability and
        convergence programmes (SCPs) raised concerns about medium-term projections, notably
        regarding assumptions underlying macroeconomic and fiscal forecasts, absence of realistic fiscal
        strategies, insufficient consolidation efforts and unattainable targets.
Impact of Covid-19 fiscal response to public deficits
   •    The 27 European countries covered in this report introduced over 1,000 budgetary measures to
        counter the effects of the pandemic in 2020 and 2021. Fiscal measures amounted to an average of
        5% of GDP in 2020 and 4% of GDP in 2021. The fiscal stimulus could further increase in 2021, as
        new measures are expected to be adopted and current support measures extended.
   •    In general, national IFIs that have expressed an opinion on the fiscal response to Covid-19 deem it
        appropriate. Nevertheless, some of these IFIs expressed concerns over the size of the fiscal
        stimulus, structural drawbacks in the design of the measures, measures with an unclear link to
        Covid-19, and a surge in permanent public spending.
Recovery and Resilience Plans
   •    Almost all EU member states have submitted their national Recovery and Resilience Plans (RRPs).
        Most of the spending is expected to occur in 2021 and 2022. RRPs are expected to boost
        economic recovery in EU countries.
   •    In general, national IFIs that have expressed an opinion on the RRPs deem them appropriate.
        Nevertheless, some warn that reforms outlined in the national RRPs are too ambitious, complex
        and highly dependent on the public sector’s administrative capacity and effective coordination with
        other stakeholders.
Impact on IFI activities
    •   The Covid-19 crisis continues to have a large impact on the activities of national IFIs. The main
        challenges that national IFIs face in executing their tasks include: i) a lot of uncertainty about the
        pandemic and political decisions, ii) lack of government transparency, iii) lack of clarity on fiscal
        measures and escape clause, and iv) insufficient resources.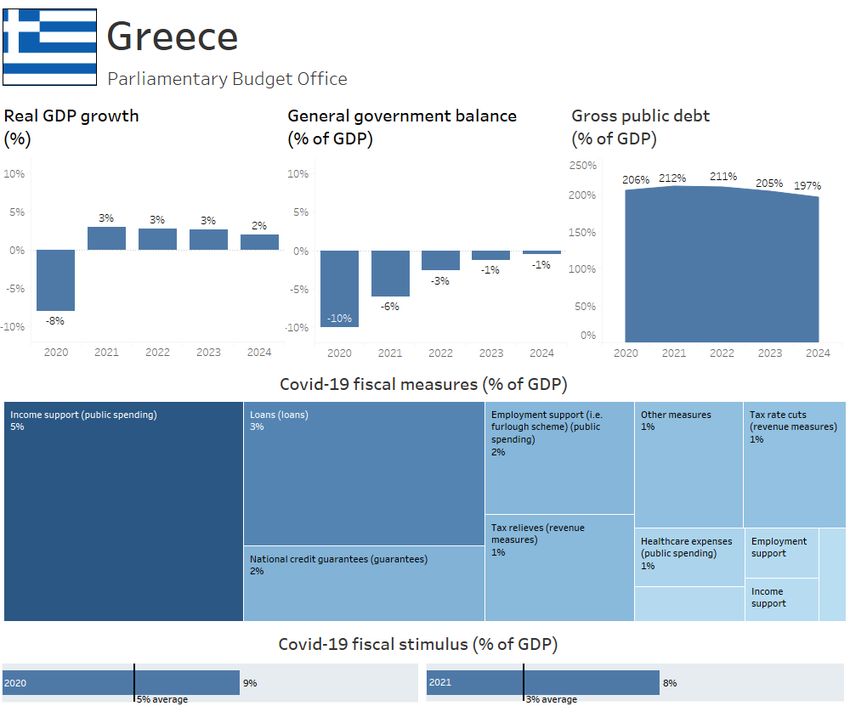
Network of EU Independent Fiscal Institutions

Foreword
The gradual phasing out of the Covid-19-related restrictions is spurring economic growth throughout
Europe. Governments have started phasing out the ‘first-aid’ fiscal stimulus and are introducing measures
to support economic recovery. The implementation of the EU-funded Recovery and Resilience Facility (RRF)
is expected to further boost economic growth.

Although the automatic stabilisers and special Covid-19-related measures have significantly increased the
public debt, fiscal support policies are broadly considered effective by the national independent fiscal
institutions (IFIs) in these extraordinary times. In the short run, the expansionary measures will continue to
dominate the public finances, with large deficits in most European countries in 2021. In the medium term,
progress against Covid-19 and economic recovery are expected to contribute to healthier fiscal indicators.

However, fiscal policy will need to move back towards ‘normal’ settings once the effects of the pandemic
have subsided. According to the assessments of national IFIs, a number of medium-term plans by national
governments have overly optimistic assumptions and too-expansionary fiscal stances. Many IFIs are
concerned about long-term fiscal pressures such as climate change and ageing population. Governments
must ensure that they have credible post-pandemic plans to deliver social and climate objectives within
the context of medium-term economic and budgetary stability.

The independent assessment of public finances by national IFIs will remain essential. Now that economies
are finding their ‘new’ normal, governments will face various challenges related to the sustainability of their
public finances. Independent fiscal surveillance is necessary to ensure that realistic and appropriate
medium and long-term plans are prepared and executed.

 Richard van Zwol                                              Sebastian Barnes
 Chair of the Network of EU Independent                        Deputy Chair of the Network of EU
 Fiscal Institutions and State Council at the                  Independent Fiscal Institutions and Chair at
 Netherlands Council of State                                  the Irish Fiscal Advisory Council

                                                                                                              3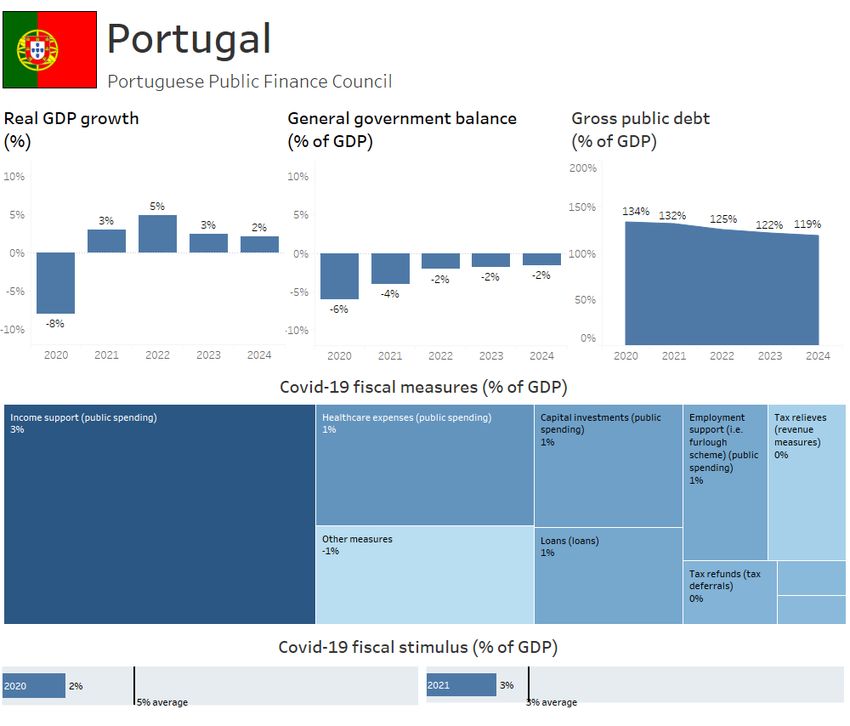
European Fiscal Monitor – June 2021

                                                                    Table of Contents
Executive summary................................................................................................................................................ 2
Foreword ............................................................................................................................................................... 3
1      Introduction .................................................................................................................................................. 5
2      Short-term outlook for public finances .......................................................................................................... 6
    2.1         Economic growth..........................................................................................................................................6
    2.2         Public balances .............................................................................................................................................6
    2.3         Public debt....................................................................................................................................................7
    2.4         Assessment by IFIs ........................................................................................................................................8
3      Medium-term outlook for public finances ..................................................................................................... 9
    3.1         Economic growth..........................................................................................................................................9
    3.2         Public balances .............................................................................................................................................9
    3.3         Public debt ..................................................................................................................................................10
    3.4         Assessment by IFIs ......................................................................................................................................11
4      Impact of Covid-19 fiscal response on public deficits ................................................................................... 13
    4.1         Fiscal response across countries.................................................................................................................13
    4.2         Fiscal response by instruments and beneficiaries ......................................................................................14
    4.3         Take-up rate of guarantees ........................................................................................................................15
    4.4         Assessment by IFIs ......................................................................................................................................16
5      Recovery and Resilience Plans ..................................................................................................................... 17
    5.1         Recovery and Resilience Plans across countries .........................................................................................17
    5.2         Recovery and Resilience Plans across years ...............................................................................................18
    5.3         Assessment by IFIs ......................................................................................................................................19
6      Impact on IFI activities ................................................................................................................................. 20
Annex - Country factsheets .................................................................................................................................. 22

Authors
This report was prepared by the Secretariat of the Network of EU Independent Fiscal Institutions comprising
Inna Oliinyk, Willem Pieter de Groen and Beatriz Pozo. It was reviewed by the Editorial Board of the Network
and members of the Network. The report is based on the survey responses from the members of the
Network.

The analysis and views expressed do not necessarily represent the positions of individual members of the
Network.

                                                                                                                                                                              4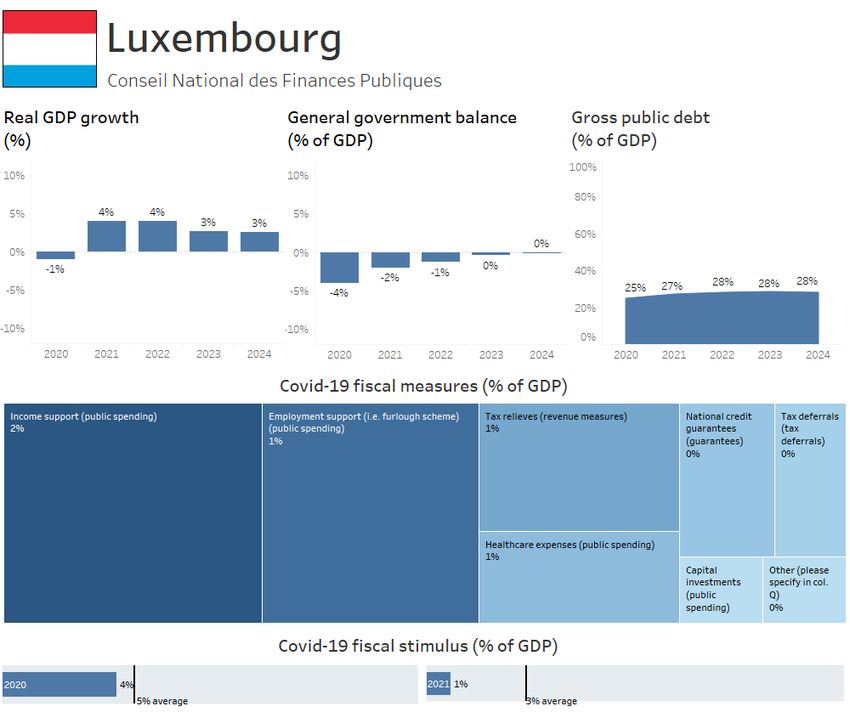
Network of EU Independent Fiscal Institutions

1 Introduction
As vaccines are rolled out and restrictions relaxed, European economies are recovering from the Covid-19
pandemic. Nevertheless, most recent projections for 2021 are less optimistic than earlier estimates, given
the further intense disruption caused by Covid-19 early this year.1 Both the projected real GDP growth and
public balances were revised downwards by on average 1 percentage point.2

All countries are expected to record positive economic growth in 2021 – the anticipated average real GDP
growth is 3%. The pace of economic recovery in Europe appears to be uneven, though, as some countries
are set to reach their pre-pandemic levels of GDP in 2021, while others expect to reach this level only in
2022 or 2023.

The fiscal stance in most countries remains expansionary, as governments are shifting from first aid to
supporting economic recovery. In the 27 countries3 covered by this European Fiscal Monitor (EFM), policy
measures cost on average about 5% of GDP in 2020 and 4% of GDP in 2021. The costs for the Covid-related
measures might further increase if new measures are adopted.

Over recent months the EU Recovery and Resilience Facility (RRF) Regulation has been adopted and nearly
all countries have prepared and submitted their Recovery and Resilience Plans (RRPs). The RRF amounts to
€673 billion and will be distributed through grants and loans in the next seven years, but most will be
distributed in 2021 and 2022. The European Commission (2021) estimates that the RRF will have an
accumulative contribution of around 1.2% of 2019 EU GDP to economic growth over 2021-22.

This EFM gives an overview of the activities of 32 national IFIs, and the fiscal measures adopted in response
to Covid-19 in 26 EU member states and the UK. The monitor is based on a survey of EU IFIs conducted in
May and June 2021, and is largely based on information linked to spring 2021 stability and convergence
programmes (SCPs).4 The information depends on the mandate of the national IFI, and is obtained from
these or from the national governments.5

IFIs are independently mandated by national governments to: i) monitor compliance with national and EU
fiscal rules, ii) produce or endorse macroeconomic and in several cases budgetary forecasts, and/or iii)
advise national governments on fiscal policies. This puts them in a good position to assess public finances
at national level.

1
  European Network of EU IFIs (2021), European Fiscal Monitor (March 2021).
2
  Average aggregation for all indicators is calculated as unweighted average of EU IFI Network members.
3
  AT, BE, BG, CY, CZ, DE, DK, EE, EL, ES, FI, FR, HR, HU, IE, IT, LT, LU, LV, MT, NL, PT, RO, SE, SI, SK, UK.
4 European Network of EU IFIs (2021), Survey of European Independent Fiscal Institutions, June 2021.
5
  For this reason, projects may not be fully comparable. Please see the Survey of European Independent Fiscal Institutions, June
2021 for more information about the cut-off date and source of projections.

                                                                                                                              5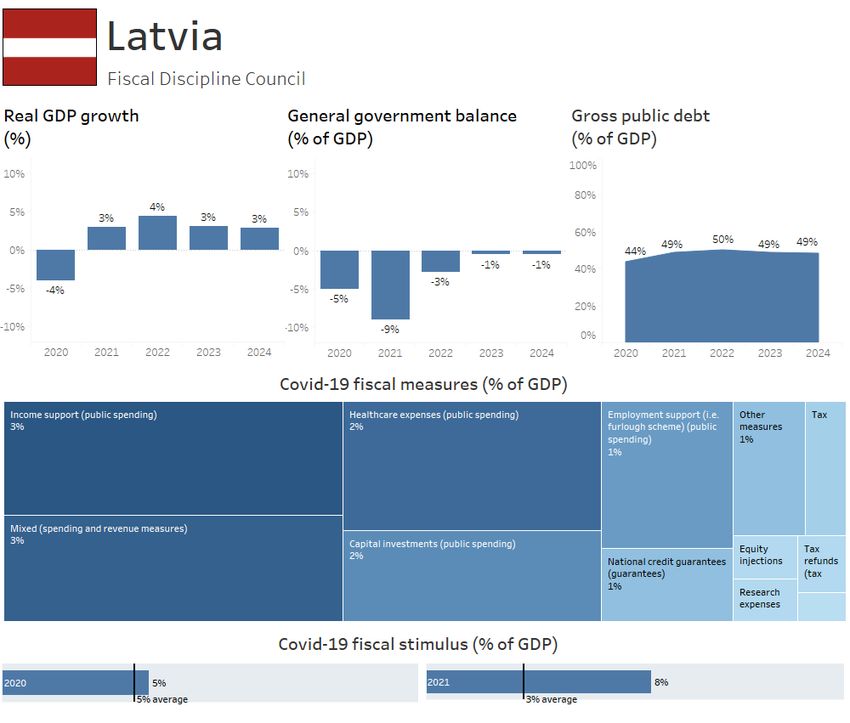
European Fiscal Monitor – June 2021

2 Short-term outlook for public finances
Real GDP growth, general government balance and gross public debt are key indicators used by national
IFIs to assess the short-term outlook for public finances. IFIs produce or assess these projections regularly
in the context of the budget endorsement or assessment.

2.1 Economic growth
In most countries economic growth projections have been revised downwards from the last EFM estimates
(see Figure 1).6 According to the government or IFI forecasts disclosed with the 2021 SCPs, average
economic growth in the 26 countries7 is expected to be 3% in 2021, one percentage point lower than
initially expected. Economic growth projections have only been revised upwards in six countries.8

According to the latest projections, the highest growth rate in 2021 is expected in Spain (7%), followed by
three countries9 that have an expected economic growth of 5%. The expected real GDP growth for the
remaining countries ranges between 2% and 4%. Only 6 out of 27 surveyed countries10 are expected to
reach their pre-pandemic levels during 2021.

Figure 1. Projected real GDP growth in 2021 (% of GDP)
15%
                                            Previous projections       Latest projections

10%
                                                                                                                                7%
                                                                                    5% 5%
                                                                        4% 4% 4% 5%
    5%               3% 3% 3% 3% 3% 3% 3% 3% 3% 3% 3% 4% 4% 4% 4% 4% 4%
                  3%
         2% 2% 2%

    0%
         AT IE NL EE FI FI LT BG EL DK LV CZ SE PT SK DE CY EL MT LU UK BE HU IT SI FR RO ES
               CPB   EPC NAO    PBO                         HFC         FPB     IMAD

Note: The figures show the projections produced (officially or internally) or assessed (with or without endorsement) by IFIs in line
with their mandates. The figures for Ireland relate to Modified GNI rather than GDP. The previous projection for Spain is based on
the medium of the three prepared scenarios.
Source: The Network of EU Independent Fiscal Institutions (2021).

2.2 Public balances
Automatic stabilisers and Covid-19-related fiscal measures are having a larger impact on 2021 government
budgets than the projections in the previous EFM published in March 2021 (see Figure 2). On average,
public deficits in 25 countries are expected to reach 7% in 2021, one percentage point above previous

6
  However, since the spring of the current year, consensus forecast of real GDP growth has stabilised for the euro area or even
improved for a number of countries.
7
  Projections were unavailable for Croatia.
8
  BE, BG, CZ, FI, RO, SI.
9 FR, RO, SI.
10
   DK, IE, LT, LU, RO, SE.

                                                                                                                                  6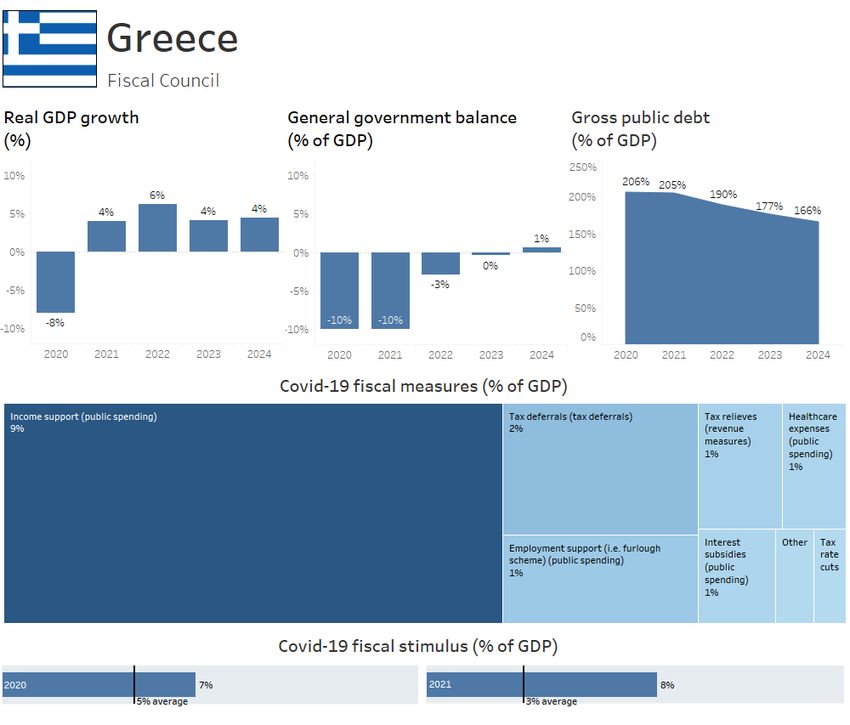
Network of EU Independent Fiscal Institutions

projections. In eight countries,11 public deficits are expected to be smaller than previous projections,
according to the figures shared by at least one national IFI.

Public deficits in nearly all 26 countries are expected to exceed the 3% reference value in 2021. Luxembourg
is the only exception, with a projected public deficit of 2% of GDP. Malta and Italy are projected to have
the largest public deficits (both 12% of GDP), followed by Greece (10%), and Latvia, France and Czechia (all
9%). The remaining countries are expected to have public deficits ranging between 3% and 8%.

Figure 2. Projected general government balance in 2021 (% of GDP)

                   EL                                   BE     EL NL         FI FI
            MT IT HFC LV FR CZ IE LT DE RO ES SK AT HU FPB EE PBO CPB BG CY EPC NAO SE PT DK LU UK
      0%                                                                                                                       N/A
     -5%                                                                                                                     -2%
                                                                                                 -5% -5% -5% -5%   -4% -3%
                                                                                 -6% -6% -6% -6%
 -10%                               -8% -8% -8%        -8% -8% -8% -8% -8% -7%
                    -10%-9% -9% -9%
 -15%       -12%-12%

                                                 Previous projections     Latest projections

Note: The figures show the projections produced (officially or internally) or assessed (with or without endorsement) by IFIs in line
with their mandates. The figures for Ireland relate to Modified GNI rather than GDP. The previous projection for Spain is based on
the medium of the three prepared scenarios.
Source: The Network of EU Independent Fiscal Institutions (2021).

2.3 Public debt
The substantial size of fiscal expansions in 2021 in response to Covid-19 is expected to have a large impact
on public debt. The increase in the debt-to-GDP ratio is also expected to be higher than previously
envisaged (see Figure 3). Higher public debt projections were reported by 14 out of 32 national IFIs,12
revised upwards by 3 percentage points on average. A dozen IFIs13 report the projected public debt in 2021
to be lower than originally envisaged, by about 2 percentage points. Other IFIs did not report updated
projections14 or do not have a mandate15 to produce/assess the projections. The debt levels of 15
countries16 are projected to be above the 60% debt reference value in 2021.

11
   BE, EE, EL, ES, FI, IE, LU, RO.
12
   AT, BE, CZ, CY, DE, EL PBO, ES, FI EPC, HU, LT, LV, MT, IT, SE.
13
   BG, DK, EE, EL HFC, FR, FI NAO, IE, LU, NL, PT, RO, SK.
14
     UK.
15
     HR, NL RVS, SI SFC.
16
     AT, BE, CY, DE, ES, EL, FI, FR, HU, IE, IT, MT, PT, SK, UK.

                                                                                                                                     7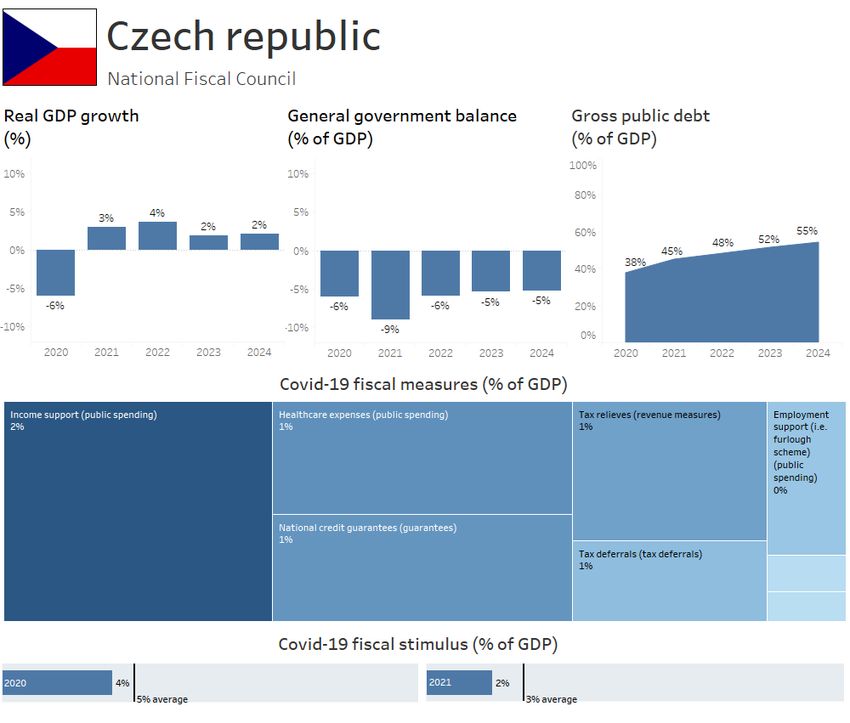
European Fiscal Monitor – June 2021

Figure 3. Projected gross public debt in 2021 (% of GDP)
 250%
                                               Previous projections       Latest projections                                    205% 212%
 200%
                                                                                                                         160%
 150%                                                                                                             132%
                                                                                          112%112%116% 118%119%
                                                                                    89%
 100%                                                          72% 72% 73%
                                                                           80%
                                               52% 59% 61% 65%
                                       49% 51%
                           40% 40% 45%
     50%     21% 27% 27%
                                                                                                                                            N/A
      0%
             EE LU BG DK SE CZ LV RO LT NL SK MT FI FI DE HU AT IE CY BE FR ES PT IT EL EL UK
                                        CPB     EPC NAO               FPB            HFC PBO

Note: The figures show the projections produced (officially or internally) or assessed (with or without endorsement) by IFIs in line
with their mandates. The figures for Ireland relate to Modified GNI rather than GDP. The previous projection for Spain is based on
the medium of the three prepared scenarios.
Source: The Network of EU Independent Fiscal Institutions (2021).

2.4 Assessment by IFIs
Most national IFIs with competences on the fiscal stance (21 out of 32 surveyed)17 consider the adopted
fiscal stance as appropriate for economic and budgetary stability in 2021. Public finances in most countries
are set to remain expansionary in 2021. This is deemed reasonable given that the Covid-19 impact on the
economy remains significant in most countries. Nevertheless, many IFIs warn that as social restrictions are
gradually relaxed and vaccination rates rise, it is appropriate to speed up the phasing out the emergency
support measures and focus on more targeted measures to support the recovery of the economy.

The fiscal stance was deemed too expansionary in only one country, where national fiscal rules had been
significantly loosened and fiscal consolidation plans were insufficient.

17
     Eleven national IFIs did not report a view as this is outside their mandate or for other reasons.

                                                                                                                                                  8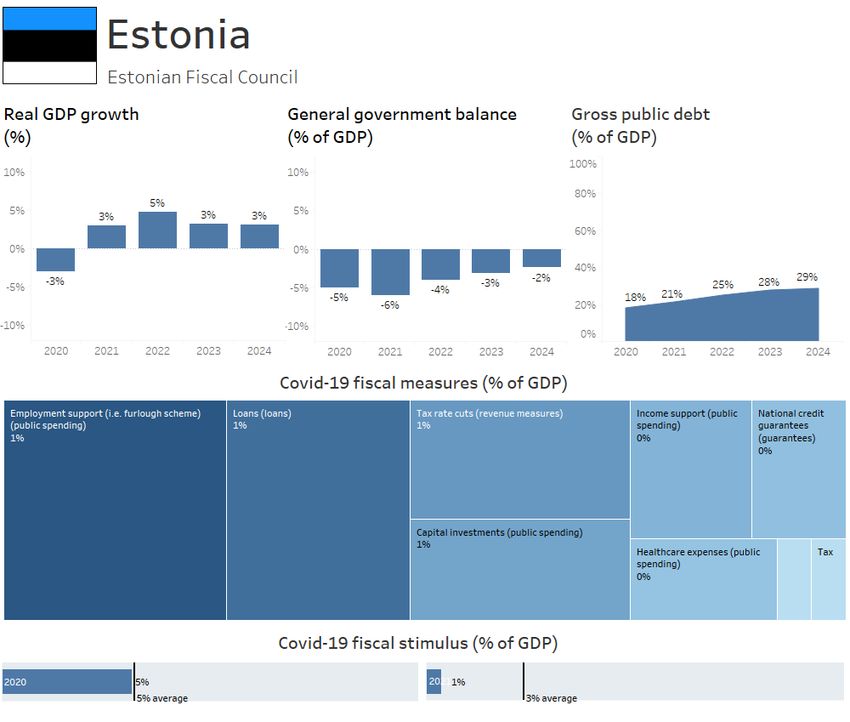
Network of EU Independent Fiscal Institutions

3 Medium-term outlook for public finances
Real GDP growth, general government balance and gross public debt on the Maastricht basis are also key
indicators used by national IFIs to assess the medium-term outlook for public finances. IFIs produce or
assess projections as part of the assessment of the medium-term budgetary plans of governments. In the
EU, SCPs set out the medium-term path for public finances.

3.1 Economic growth
In most countries, strong growth is expected in the medium term (see Figure 4). According to national IFIs,
six countries18 are projected to reach their pre-pandemic growth levels this year, but most are expected to
reach them in 202219 or 2023.20

According to the most recent official projections, 26 countries21 are expected to grow by an average 3%
between 2021 and 2024. According to at least one national IFI, Romania, Malta and Greece are projected
to reach the highest average growth over this period (5%). Five other countries22 are projected to grow on
average 4% over 2021-24. The projected real GDP growth for the remaining countries ranges between 2%
and 3%.

Figure 4. Projected average real GDP growth over 2021-24

 6%
                                                                                                                    5% 5%
 5%                                                                                                        4% 4% 5%
                                                                                 4% 4%
 4%                                                                  3% 3% 3% 4%
                                                3% 3% 3% 3% 3% 3% 3%
                       3% 3% 3% 3%
 3%     2% 2% 2% 2% 2%
 2%
 1%
 0%
        FI NL DE DK AT EL SE BE CZ BG LT IT SK PT FR LU CY LV EE UK SI IE HU ES EL MT RO
       NAO CPB        PBO    FPB                                   IMAD         HFC

Note: The figures show the projections produced (officially or internally) or assessed (with or without endorsement) by IFIs in line
with their mandates. The unweighted average is computed based on real GDP projections for 2021-24. The figures for Ireland
relate to Modified GNI rather than GDP.
Source: The Network of EU Independent Fiscal Institutions (2021).

3.2 Public balances
Government deficits are projected to remain substantial from 2021 to 2024 even as temporary Covid-19-
related effects unwind (see Figure 5). As most countries are planning to implement fiscal consolidation and
GDP growth rates are set to recover, 17 of them23 expect deficits to remain at or above the 3% public deficit
reference value in 2024. According to the latest projections, Cyprus, Finland, Greece, Luxembourg and

18
   DK, IE, LT, LU, RO, SE.
19
   BE, BG, CY, CZ, DE, EE, EL HFC, ES, FI EPC, FI NAO, FR, HU, LV, MT, NL, PT, SI IMAD, SK, UK.
20
   AT, EL PBO, IT.
21
   Projections were unavailable for Croatia.
22
   ES, HU, IE, SI, UK.
23
   AT, CY, HU, DE, DK, EE, EL, FI EPC, IE, LT, LV, LU, MT, NL CPB, PT, RO, SE.

                                                                                                                                  9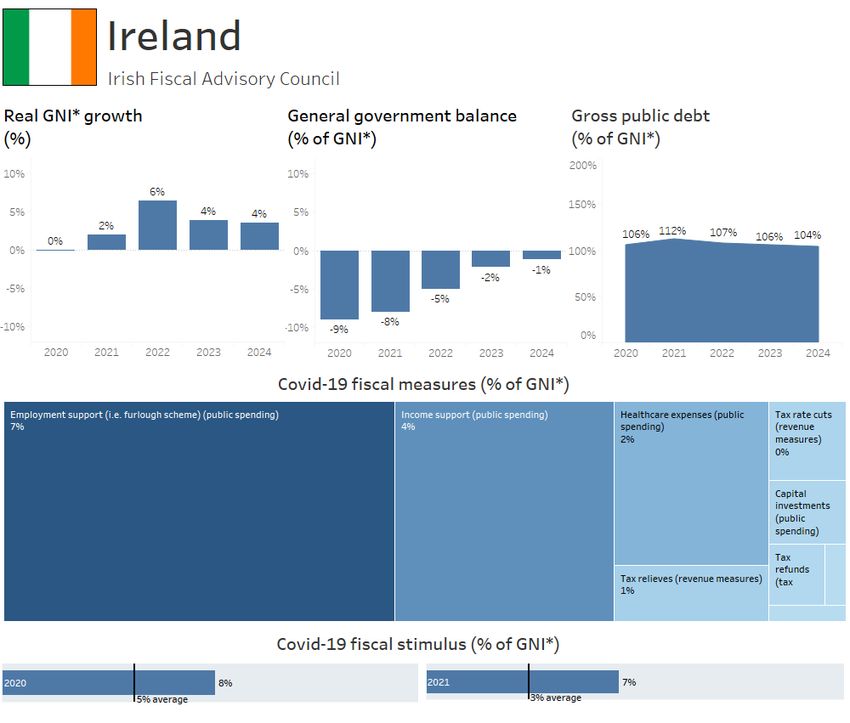
European Fiscal Monitor – June 2021

Sweden are the only countries expected to record neutral or positive public balances in 2024. The
remaining countries are expected to have public deficits below 3%. Czechia and Belgium are projected to
have the largest public deficits (about 5% of GDP) in 2024, with France, Slovakia and Spain forecasting
around 4% the same year.

Figure 5. Projected general government balance in 2024 (% of GDP)
                                                                                                                                               2%
     2%                                                                                                                                   1%
                                                                                                                                     1%
                                                                                                                                0%
     0%
                                                                                                                      0%   0%
                                                                                                          -1%   -1%
 -2%                                                                                    -2%
                                                                                              -1%   -1%
                                                                                                                                3% reference value
                                                                            -2%   -2%
                                                                      -2%
 -4%                                          -3%   -3%   -3%   -3%
                                  -4%   -3%
                      -4%   -4%

 -6%      -5%   -5%
          CZ BE FR SK             ES    IT HU MT LT RO EE AT                       FI PT      IE    NL EL LV DE DK LU EL SE                    CY
             FPB                                                                  EPC               CPB PBO           HFC

Note: The figures show the projections produced (officially or internally) or assessed (with or without endorsement) by IFIs in line
with their mandates. The figures for Ireland relate to Modified GNI rather than GDP.
Source: The Network of EU Independent Fiscal Institutions (2021).

3.3 Public debt
In the medium term, public debt levels in most countries are set to increase from 2019 levels (see Figure
6). National IFIs in 21 countries24 project an increase in the public debt-to-GDP ratio up to 2024. This
increase is mostly due to the large size of adopted Covid-related fiscal stimulus. The largest increases in
debt-to-GDP ratios between 2019 and 2024 are projected in Czechia (+24%), Malta (+24%), Lithuania
(+21%), Belgium (+21%), France (+20%) and Estonia (+20%).

National IFIs project the debt level to decrease over that same period in only three countries. The largest
decreases in the debt-to-GDP ratio are projected in Greece (-14%),25 Sweden (-4%), and Cyprus (-1%). By
2024, public debt is projected to be above the 60% reference value in 14 countries.26

24AT, BE FPB, CZ, DE, DK, EE, EL PBO, ES, FI EPC, FR, HU, IE, IT, LT, LU, LV, MT, NL SPB, MT, RO, SK.
25
   According to projections of the Hellenic Fiscal Council.
26
   AT, BE, CY, DE, DE, SK, MT, DE, ES, FI, FR, HU, IE, PT, IT.

                                                                                                                                                     10
Network of EU Independent Fiscal Institutions
Figure 6. Projected gross public debt on Maastricht basis (% of GDP)
250%
2019 2024
197%
200%
166%
153%
150%
112% 118% 119% 119%
104%
93%
100% 85%
70% 75% 76%
62% 66%
Reference value 49% 52% 55% 55% 57%
42%
50% 28% 29% 31%
0%
LU EE SE DK LV RO CZ NL LT SK MT DE FI HU AT CY IE ES FR BE PT IT EL EL
CPB EPC FPB HFC PBO
Note: The 2019 figures are taken from AMECO. The 2024 figures show the projections produced (officially or internally) or assessed
(with or without endorsement) by IFIs in line with their mandates. The figures for Ireland relate to Modified GNI rather than GDP.
Source: The Network of EU Independent Fiscal Institutions (2021), AMECO (2021).
3.4 Assessment by IFIs
In general, the national IFIs that have assessed SCPs27 consider the underlying macroeconomic forecasts to
be plausible, realistic and consistent with current macroeconomic conditions. However, many IFIs warn
that macroeconomic forecasts are plausible only assuming that certain conditions (e.g. effectiveness of
vaccination, effective usage of RRF funds) are met. The IFIs emphasise that uncertainty remains significant
and the risks of the pandemic evolving may affect the economic situation.
Fiscal forecasts underlying national SCPs have been or will be assessed by 20 national IFIs.28 Most national
IFIs found the fiscal forecasts to be plausible, though slightly conservative and pessimistic in some
countries, and two29 have found them to be implausible because of overestimation of spending and
unrealistic assumptions about public finance developments.
Most national IFIs30 that assessed the medium-term fiscal planning of their national governments consider
the medium-term path for public finances attainable or reasonable. However, two IFIs31 deem their national
medium-term fiscal plans not attainable because of unrealistic underlying assumptions, notably those used
to project government revenue and expenditure.
Only 10 national IFIs have assessed or are planning to assess the long-term sustainability of public finances
in the fiscal plans. Most of them consider long-term fiscal plans attainable or reasonable. Only in the
Netherlands do both national IFIs32 consider the long-term plans unattainable. National IFIs in the
Netherlands estimate the gap between current trajectory and sustainability targets to be around 1.8% of
GDP.
27 AT, BG, CY, DE, EE, EL HFC, EL PBO, ES, FI EPC, FI NAO, FR, HR, IE, IT, LT, LU, LV, MT, NL RVS, PT, SE.
28
AT, BU, CY, DE, EE, EL HFC, EL PBO, ES, FI EPC, FI NAO, IE, IT, LT, LU, LV, MT, NL RVS, PT, SE, SI SFC, SK.
29
DE, SI SFC.
30
AT, DE, EE, ES, FI EPC, FI NAO, EL PBO, IE, LT, LV, PT, SE.
31
CZ, SI SFC.
32
Council of State and CPB Bureau for Economic Policy Analysis
11European Fiscal Monitor – June 2021
Despite the extraordinary situation created by the pandemic, most national IFIs reporting their view on the
survey consider the fiscal stance in the 2021 SCP to be broadly appropriate. The public finances in the years
ahead are set to remain supportive in most countries, which amounts to a countercyclical fiscal stance. The
domestic fiscal stimulus will be complemented by the resources from the RRF to reinforce economic growth
in the medium term. Some national IFIs even warn that a strong economic recovery might turn the policies
procyclical. Currently, however, only one IFI considers the fiscal stance to be too expansionary.
Nevertheless, nearly a third (12 out of 32) of national IFIs have raised concerns about the 2021 SCPs. These
mostly relate to: i) unrealistic assumptions underlying macroeconomic and fiscal forecasts, ii) violated
procedures, iii) the absence of realistic medium-term fiscal strategies, iv) insufficient medium-term
consolidation efforts, and v) unattainable medium-term targets.
12Network of EU Independent Fiscal Institutions
4 Impact of Covid-19 fiscal response on public deficits
4.1 Fiscal response across countries
In addition to automatic stabilisers, the 27 countries covered by this report have introduced over a
thousand budgetary measures to counter the effects of the pandemic. The impact of adopted measures on
public deficit in 2020 is substantially larger than in 2021 because of the winding down of some Covid-related
emergency measures linked to the relaxation of restrictions, expected RRF transfers, and the roll out of
revenue-generating measures in some countries.
The size of the adopted fiscal response is significant in terms of GDP (see Figure 7). On average, according
to IFIs, the impact on public deficits of adopted fiscal measures33 amounted to 5% of GDP in 2020 and 4%
of GDP in 2021. The latter figure might still increase if current support measures are extended or new
measures adopted.
There are substantial differences across countries. According to updated estimates, the UK had the largest
relative number of fiscal measures in place (about 13% of GDP) in 2020. Greece (8%), Ireland (8%), Slovenia
(7%) and Hungary (7%) also incurred deficit impact of 7% or more of GDP in 2020. The countries with the
smallest fiscal stimulus in 2020 were Romania (2%) and Slovakia (2%).
The impact of Covid-related fiscal measures is expected to be lower in 2021, mostly because of the gradual
phasing out of income support measures and the rolling out of revenue-generating measures in some
countries. Greece is projected to have the highest cost of fiscal stimulus in 2021 (about 9% of GDP). In
Denmark and Ireland the fiscal measures are projected to have a deficit impact of about 8% and 7% of GDP
respectively. According to the latest projections, the impact of adopted measures on the deficit ranges
from 1% to 5% of GDP in the remaining countries.
33
Discretionary measures and liquidity ones for the part that national accountants deem unrecoverable.
13European Fiscal Monitor – June 2021
Figure 7. Size of adopted Covid-19-related fiscal measures (% of GDP)
Note: The total size of adopted fiscal measures in 2020 and 2021 is shown. Fiscal stimulus is measured as a first-round effect in
general government (ESA2010) terms. The figures for Ireland relate to Modified GNI rather than GDP.
Source: The Network of EU Independent Fiscal Institutions (2021).
4.2 Fiscal response by instruments and beneficiaries
Public spending accounts for the largest share of the adopted fiscal measures (about 7% of GDP) and
foregone revenues (1%) (see Figure 8). The deficit impact of the liquidity measures34 (loans and guarantees)
is smaller and about 0.5% of GDP on average. Tax deferrals have an even smaller impact (about 0.3%).
Non-financial corporations are the largest direct beneficiaries, benefiting from support measures with a
size equivalent to about 3% of GDP. Since most of these measures provide subsidies and grants to
companies severely hit by the Covid-19 crisis, they may indirectly also benefit employees and thus
households.35
Households are the second largest group of direct beneficiaries, receiving about 2% of GDP. Additionally,
the non-profit institutions serving households (1%) also received significant amounts of the measures.
34
The deficit impact of liquidity measures consists of defaults on loans and loans as guarantees by the government.
35Employment support measures target companies and the self-employed in several countries, despite households being the
ultimate beneficiaries.
14Network of EU Independent Fiscal Institutions
Finally, there are substantial measures (about 2% of GDP) targeting several categories of other beneficiaries
at once.
Figure 8. Cumulative size of fiscal measures by main instrument and beneficiaries (% of GDP)
Note: Fiscal measures are measured as a first-round effect in general government (ESA2010) terms in 2020 and 2021. The figures
were rounded up to the first decimal.
Source: The Network of EU Independent Fiscal Institutions (2021).
4.3 Take-up rate of guarantees
Government guarantees are widely used to ensure the continued access to credit of companies and the
self-employed. Guarantees do not imply immediate cost for governments, as long as the guarantees are
not called. The chance of default and impact on the budget over the next few years can be estimated and
included in budgetary projections.
According to national IFIs, many countries have announced guarantees of substantial size (see Figure 9).
Hungary guaranteed total loans equivalent to about 30% of GDP. Portugal announced about 23% of GDP in
liquidity measures. In Czechia (15%), Spain (14%) and France (13%), the total amount of announced
guarantees represents more than one tenth of GDP. In the remaining countries, the total estimated value
of guarantees ranges from 1% to 7% of GDP.
Despite the large size of announced guarantees, the take-up of guaranteed loans has been lower. In Greece
(100%) nearly all of the announced guarantees have been used. By contrast, in Spain (69%), the Netherlands
(64%), Hungary (59%) and Denmark (50%), little over half of the estimated value of guaranteed loans have
been taken up. In France, less than half (45%) and in Malta (37%) only about one third of all announced
guaranteed loans have been used. In other countries the take-up value of guarantees has been marginal,
with less than 10% of the announced loans being used. Data on the take-up of guarantees in eight other
countries is not yet available.36
36
CZ, ES, FI, IE, LT, LV, PT, RO.
15European Fiscal Monitor – June 2021
Figure 9. Total estimated value and take-up value of adopted guarantees by country by end of May 2021
(% of GDP)
35%
Take-up value Total estimated value 30%
30%
25% 23%
20%
15%
15% 14% 14%
10% 7%
5% 6%
5% 3% 3% 3% 3%
1% 1% 1% 3%
N/A N/A N/A N/A N/A N/A N/A N/A
0%
IE EL RO LV MT AT LT DK SI FI NL ES FR CZ PT HU
Note: The information on total estimated value and take-up of guarantees is available only for the specified countries. For other
countries the information was not available. Total estimated value of guarantees is measured in cash terms for 2020 and 2021.
Source: The Network of EU Independent Fiscal Institutions (2021).
4.4 Assessment by IFIs
Most national IFIs (20 out of 32)37 consider the government fiscal and budgetary actions taken in response
to the pandemic in 2021 appropriate in general. The IFIs have noted a smooth transition from the first-aid
fiscal measures to supporting economic recovery. The composition of new and extended fiscal measures
has generally been found effective in addressing the crisis. Nevertheless, some IFIs assess that some of the
measures were rather poorly designed.
Moreover, national IFIs in four countries deem the fiscal response to Covid-19 excessive because of the
large size of the fiscal stimulus, structural drawbacks in the design of the measures,38 measures with an
unclear link to Covid-19, or a surge in permanent public spending. IFIs in these countries warn that adopted
and announced fiscal measures aggravate medium-term fiscal sustainability risks. In turn, the national IFI
in one country assesses the fiscal response to Covid-19 to be insufficient and called for additional one-off
measures to stimulate the economy.
37A further six IFIs did not report a view as this is outside their mandate, or for other reasons.
38
Some IFIs reported adoption of measures that are not targeted at the right entities (e.g. significant changes in personal
income tax, etc.).
16Network of EU Independent Fiscal Institutions
5 Recovery and Resilience Plans
5.1 Recovery and Resilience Plans across countries
Twenty-four EU member states39 had submitted national RRPs by the end of June 2021. The total size of
the RRF amounts to €673 billion, of which about half (46%) is allocated in grants and the other half (54%)
in loans (EC, 2021). National governments can supplement the RRFs through national budgets. The funds
are allocated on a range of different criteria, such as magnitude of the economic recession due to the Covid-
19 pandemic, real GDP, population share, and unemployment.
The RRF is financed through debt issued by the EU, which is the largest ever euro-denominated issuance at
supranational level (ECB, 2021). The debt is measured as counting towards the EU accounts, which means
that it has no impact on measured national debts and deficits (Eurostat, 2020). However, loans will need to
be repaid over time and will appear as part of national government debt. Grants will not have a counterpart,
being instead partially financed from member states’ future EU contributions. This implies a financial
commitment, and RRF spending will not be included in the assessment of numerical benchmarks under the
EU fiscal rules (Eurostat, 2020).
According to the European Commission, RRPs are expected to have a total economic impact of 1.2% of
2019 EU real GDP over next two years. This figure reflects the direct impact of the RRF on GDP, channelled
primarily through domestic demand, in particular investment. The RRF is also expected to have an indirect
impact on economic growth through supply-side effects (EC, 2021). The RRP of Greece has the largest
relative size, representing about 18% of GDP. The RRPs of Italy (14%), Romania (13%) and Croatia (12%) are
also larger than one tenth of the GDP. Ireland (0.3%) and Luxembourg (0.3%) have the smallest relative
RRPs, representing less than 1% of GDP. In other countries the size of RRPs range between 1% and 7% of
GDP.
Figure 10. Recovery and Resilience Plans across countries by source of funding (% of GDP)
20%
National budget Loans Grants
18% 18%
16%
14%
14%
12% 13%
12%
10%
8%
7%
6% 5% 6% 6% 6% 6% 6%
4% 4% 4% 4%
4%
2% 2%
1% 1% 1%
0% 0% 1%
0%
IE LU DK FI AT BE MT EE CZ FR LT SI SK HU ES CY LV PT HR RO IT EL
39
AT, BE, CY, CZ, DK, DE, EE, EL, ES, FI, FR, HR, HU, IE, IT, LT, LU, LV, PT, PL, RO, SE, SI, SK.
17European Fiscal Monitor – June 2021
Note: The information on total size of RRPs and source of funding is only available for the 22 specified countries. For other countries
the information was not available. The UK is not eligible for RRF funding.
Source: The Network of EU Independent Fiscal Institutions (2021).
In many countries40 RRPs appear to cover measures that were predominantly included in the previous
legislation. In six EU member states41 national RRPs only cover measures that were already introduced in
the previous legislation (see Figure 11). In two EU member states42 new measures make up more than four
fifths of the total size of the national RRPs. In the remaining EU member states national RRPs either fully43
or substantially44 consist of new measures that were not included in the previous legislation.
Figure 11. Share of measures that were included in the previous legislation (% of total RRP size)
100%
75%
50% 100% 100% 100% 100% 100% 100%
93%
82%
25%
29% 33%
0% 0% 0%
0%
BE FI SK IT AT CY LT LV CZ DK ES HU HR
Previously included in the legislation Not previously included in the legislation
Note: The information on share of new measures under RRPs that were not previously included in 2021 budgets was only available
for the 14 specified countries. For other countries the information was not available. The UK is not eligible for RRF funding.
Source: The Network of EU Independent Fiscal Institutions (2021).
5.2 Recovery and Resilience Plans across years
The national RRPs cover six years in most countries. Austria and Czechia plan to implement the national
RRP in seven years, while in Denmark and Malta the timeline is five years, and four years in France.
Most RRPs are heavily front-loaded with the largest share of the expenditures incurred in the first two years
of the timeline (2021-22) (see Figure 12). In Denmark about 67% of the total size of the national RRP is
planned over the first two years. Moreover, in Spain (65%) and Malta (52%) more than half of funds should
40
9 out of 14 for which information was available.
41
CZ, DK, ES, HU, LV, HR.
42
CY, LT.
43
BE, FI, SK.
44
AT, IT.
18Network of EU Independent Fiscal Institutions
be spent in the first two years. In eight other countries,45 more than a third of the national RRP should be
spent in 2021 and 2022.
There are also a few countries where some of the 2020 measures are planned to be retroactively financed
though national RRPs, though the share is marginal (2% in Austria and less than 1% in Czechia, France and
Italy).
Figure 12. Total expected spending under national Recovery and Resilience Plans by year (% of total RRP
size)
100%
80%
65% 67%
60% 48% 52%
43%
38% 39%
40% 37%
34%
29% 30% 33%
23% 25% 26% 27%
20% 19%
12% 13%
0%
LV HR CY SK EE IT LT FR EL SI FI AT PT CZ HU BE MT ES DK
Spending in 2020 Spending in 2021 Spending in 2022
Source: The Network of EU Independent Fiscal Institutions (2021).
5.3 Assessment by IFIs
Only 7 out of 32 national IFIs46 had an official role in RRPs. The Belgian Federal Planning Bureau (FPB),
Estonian Fiscal Council (EFC) and Slovenian Institute of Macroeconomic Analysis and Development (IMAD)
were tasked with assessing the macroeconomic impact of the EU-financed component of the national
RRPs,47 and four others have provided or will provide an opinion on the national RRPs. Overall, national IFIs
deemed the RRPs to be appropriate. However, some have questioned the underlying assumptions and
overall fragmentation of the national RRPs.
Eight IFIs48 have raised concerns about the content, lack of information about the projected reforms, and
the implementation and prioritisation of the national RRPs.
National IFIs noted that the reforms outlined in the RRPs are ambitious, complex and highly dependent on
the capacity of the administration and effective coordination with other stakeholders when it comes to
implementation.
45
AT, BE, CZ, EL, FI, HU, PT, SI.
46
BE FPB, CZ, EE, FI EPC, EL HFC, LV, SI IMAD.
47
The NL CPB also has a mandate to assess the macroeconomic impact of the RRP and will likely do so once the government
submits it.
48
CZ, ES, EL HFC, IT, LV, NL CPB, PT, SK.
19European Fiscal Monitor – June 2021
6 Impact on IFI activities
Covid-19 is still affecting the activities of national IFIs. Most (21 out of 32)49 faced “important” or “very
important” challenges in executing their tasks in 2021 (see Figure 13). The four main challenges cited by
the 32 IFIs are outlined below.
1. Uncertainty about the pandemic and political decisions about related social restrictions remains high for
18 IFIs,50 which complicates the endorsement/assessment of the macroeconomic and budgetary
projections. Most national IFIs addressed this uncertainty through scenario analyses by including a
pessimistic and an optimistic scenario alongside their baseline forecasts. Some national IFIs have also opted
for new types (e.g. high frequency) of data and/or modified their approaches to build in the interplay
between Covid-19 infection, social restrictions, and macroeconomic conditions.
2. Lack of clarity from the national and/or EU-authorities formed an important obstacle to the work of 10
IFIs.51 National IFIs note that costings of major measures over the medium-term, revenue forecasts, and
assumed costs of Covid-19 schemes beyond expiration date lack transparency. Most IFIs also note that EU
authorities also lack clarity, in particular regarding the treatment of Covid-19-related discretionary
measures and interpretation, while the implementation and operationalisation of the general escape
clause remains an open issue.
3. Access to data has been a significant challenge for 10 IFIs.52 New and recent data are crucial for IFIs to
assess the budgetary impact and the take-up rate of, for example, Covid-19-related fiscal measures and
sectoral turnovers, and the consistency of the budgetary forecasts against the macroeconomic scenario
and the underlying policy measures. Better data-sharing arrangements are required to improve the
exchange of information between IFIs and national governments.
4. Insufficient resources formed a significant challenge for 4 IFIs.53 The resources available to IFIs differ
widely and an increased workload has raised the pressure on all of them, but especially on those whose
resources were already limited before the Covid-19 outbreak.
National IFIs also indicated further obstacles, including lack of governmental cooperation about the
projects commissioned for them, appointments of their heads, and organisational challenges caused by the
shift to teleworking.
While the EU ‘general escape clause’ has been important to manage the consequences of the Covid-19
pandemic, the reduced emphasis on the fiscal rules could limit the relevance of national IFI activity in
monitoring the public finances of many of the countries, thereby increasing the likelihood that
governments will undertake risky policies. The rules-based system must be reinstated once the exceptional
circumstances have passed.
49 AT, BU, CY, DE, DK, EL HFC, EL PBO, ES, FR, HR, IE, IT, LT, LU, MT, NL CPB, NL RVS, PT, RO, SE, SI SFC, SI IMAD, SK, UK.
50 Important: CY, IE, LT, MT, NL CPB, NL RVS, PT, SI SFC; very important: AT, BU, DE, EL HFC, HU, IT, RO, SK, UK.
51 Important: DE, LT, PT, RO, SI SFC ; very important: AT, IE, NL RVS, SI IMAD, UK.
52 Important: DE, IE, LT, LU, NL CPB, RO, SK, UK; very important: AT, BU.
53 Important: CY, LT, UK; very important: RO.
20Network of EU Independent Fiscal Institutions
Figure 13. Challenges faced by IFIs in the execution of their work in 2021 (number of respondents indicating
one or more challenges)
High uncertainty 10 8 3
Lack of clarity 5 5 11
Access to data 2 8 11
Insufficient resources 1 3 17
Other 2 1 18
Very important Important Less important
Note: The IFIs were asked “Did you face any important challenges in the execution of your work in 2021?”, to which 21 out of 32
respondents replied positively.
Source: The Network of EU Independent Fiscal Institutions (2021).
21European Fiscal Monitor – June 2021
Annex - Country factsheets
NOTE
Country factsheets provide a concise and comprehensive overview of the key fiscal indicators and fiscal
response to the Covid-19 outbreak, based on information provided by national IFIs. Key macroeconomic
indicators were produced (officially or internally) or assessed (with or without endorsement) by the IFIs
in line with their mandates. The factsheets show: i) projected real GDP growth between 2020 and 2024,
ii) general government deficit and gross public debt on Maastricht basis between 2020 and 2024, iii) the
size of the adopted fiscal stimulus in response to Covid-19 in 2020 and 2021, and iv) the total size of
fiscal stimulus measures in response to Covid-19. The total costs of measures in response to Covid-19
cover the impact in 2020 and 2021. Only significant measures (costing more than 0.05% of GDP) are
included.
22Network of EU Independent Fiscal Institutions
23European Fiscal Monitor – June 2021
24Network of EU Independent Fiscal Institutions
25European Fiscal Monitor – June 2021
26Network of EU Independent Fiscal Institutions
27European Fiscal Monitor – June 2021
28Network of EU Independent Fiscal Institutions
29European Fiscal Monitor – June 2021
30Network of EU Independent Fiscal Institutions
31European Fiscal Monitor – June 2021
32Network of EU Independent Fiscal Institutions
33European Fiscal Monitor – June 2021
34Network of EU Independent Fiscal Institutions
Note: GNI* = Modified Gross National Income.
35European Fiscal Monitor – June 2021
36Network of EU Independent Fiscal Institutions
37European Fiscal Monitor – June 2021
38Network of EU Independent Fiscal Institutions
39European Fiscal Monitor – June 2021
40Network of EU Independent Fiscal Institutions
41European Fiscal Monitor – June 2021
42Network of EU Independent Fiscal Institutions
43European Fiscal Monitor – June 2021
44Network of EU Independent Fiscal Institutions
45European Fiscal Monitor – June 2021
46Network of EU Independent Fiscal Institutions
47European Fiscal Monitor – June 2021
48Network of EU Independent Fiscal Institutions
The Network of EU Independent Fiscal Institutions
The Network is composed of 32 independent fiscal institutions representing 26 EU countries and the UK. It
is a voluntary and inclusive organisation, open to all independent fiscal oversight bodies operating in the
EU. It provides a platform to exchange views and expertise and to pool resources in areas of common
concern. The Network supports the efforts to review and reinforce the EU fiscal framework, seeking to
better exploit the synergies between rules and institutions, as well as between different levels of
administration, whilst respecting the principle of subsidiarity and enhancing local ownership and
accountability.
For further information, visit the website: www.euifis.eu.
49You can also read