FY19 Results Presentation Straker Translations (ASX.STG) 28 May 2019

Page created by Jeremy Carroll
 
CONTINUE READING
FY19 Results Presentation Straker Translations (ASX.STG) 28 May 2019
Contact

          FY19 Results Presentation
          Straker Translations
          (ASX.STG)
          28 May 2019

1
FY19 Results Presentation Straker Translations (ASX.STG) 28 May 2019
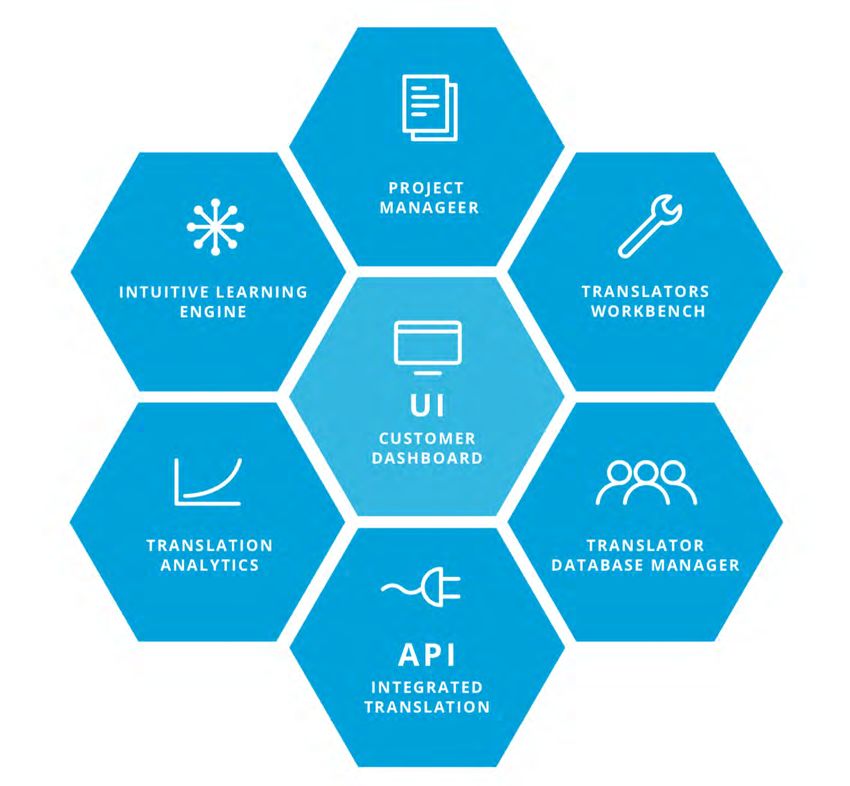
Straker is a world leading A.I.
data driven language translation
platform powering the global
growth of businesses

                                   !2
FY19 Results Presentation Straker Translations (ASX.STG) 28 May 2019
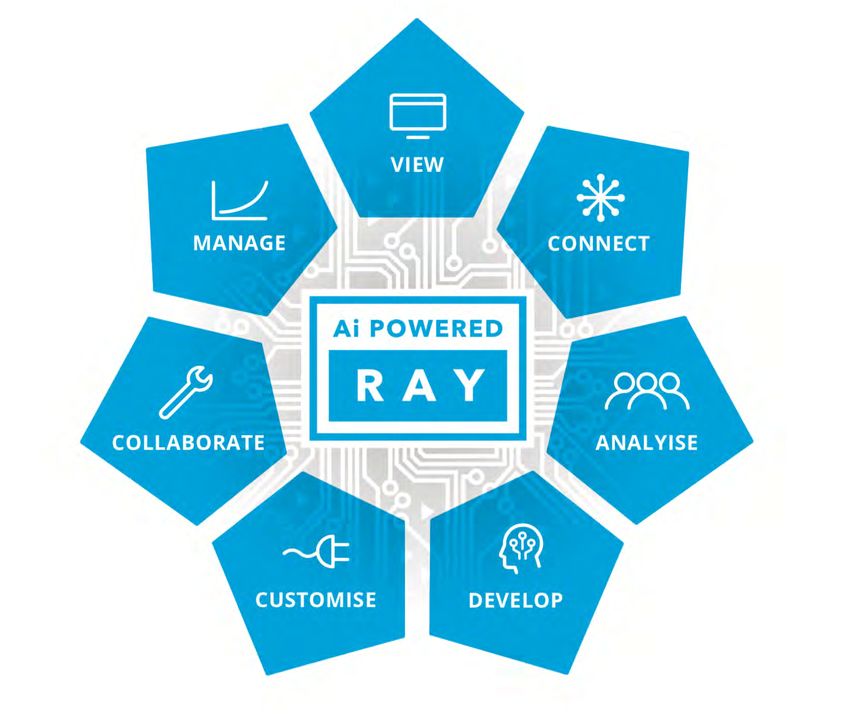
OUR ADVANTAGE THROUGH PROPRIETARY RAY PLATFORM

3
FY19 Results Presentation Straker Translations (ASX.STG) 28 May 2019
Delivering what we promised

Key operational achievements                          Key technology achievements

   Acquired three strategic bolt-on businesses            Built new platform connectors including Magento
                                                          where we now have the industry leading plugin

   Completed IPO, raising $20m (gross proceeds) for       RAY translator workbench version 4 released
   growth initiatives

                                                          100 Billion new A.I. data points collected
   Setup Hong Kong Office focused on lucrative Asian
   Legal market
                                                          New translator workbench using A.I.
                                                          driven translator selection
   Using our unique technology advantage to push
   into enterprise customers

   Exceeded Prospectus FY19 forecasts
                                                                                                        !4
FY19 Results Presentation Straker Translations (ASX.STG) 28 May 2019
Exceeded Prospectus FY19 forecasts

44%                          $25.8m
 YoY revenue                 Proforma
 growth                      revenues

                  ($0.48m)                  12.6%
                                            Organic revenue
                  Proforma                  growth
                  adjusted
                  EBITDA

83%                          $17.7m                           52.4m
 Repeat Revenue
                             Cash at bank                     Words
                                                              Translated

                                                                           !5
FY19 Results Presentation Straker Translations (ASX.STG) 28 May 2019
Successfully acquiring and integrating
  strategic acquisitions

         MSS                                                      EULE
                                                                                                                    $6.4m
Enterprise customer access                                 Enterprise customer
with larger footprint in                                   access with larger
Spanish market with easy                                   footprint into Europes
integration given location to                              largest market.                                $4.8m
Straker team in Barcelona.
                                                                   Kiel
      Barcelona                         COM
                                                                                                                           $1.6m
                                Key entry into the fast-                                       $2m
                                growing audio visual
                                market for localisation.
                                Access to major media
                                                                            Total Revenue of
                                companies in US/Europe                    acquired companies
                                                                           per calendar year    2016       2017     2018    2019
                                        Madrid
                                                                                               Eurotext    Elanex   MSS     COM
                                                                                                                    EULE

                                                                                                                              !6
FY19 Results Presentation Straker Translations (ASX.STG) 28 May 2019
FY19 delivered a strong
financial performance

                          !7
FY19 Results Presentation Straker Translations (ASX.STG) 28 May 2019
CONTINUED TO DELIVER STRONG GROWTH

          44% YOY Revenue
           Growth (NZ $m)
                                                                              54%
26
                                                                              Repeat Revenue
        44%             24.6    Actual 44%                                    Growth
23
                        23.5    Prospectus 38%

21
                                                 55%                                                   14%
18
                                                 Gross Margins                                         Operating
         17.0                                    Up 0.4% on a                                          Cashflow
15                                               constant currency
                                                 basis                                                 improves by
       FY-18          FY-19                                                                            14% YoY
 YoY revenue growth of 44%, driven both strong                       Adjusted EBITDA margin of -0.6%
                                                                     with adjusted EBITDA loss
 organically and by acquisition contributions                        improving by 89% on FY-18
                                                                                                              Note: Based on
                                                                                                              statutory results

8
FY19 Results Presentation Straker Translations (ASX.STG) 28 May 2019
Exceeded Prospectus Forecast                                                                 Pro-forma Pro-forma Prospectus             PF ^        PF ^
                                                                                             FY18        FY19        FY Mar-19          v FY18      v Prospectus
                                                                Revenue                      23.42       25.81       24.89              10.2%       3.7%
  Revenue growth of 10.2%, driven organically from
  enterprise customers in EMEA and APAC                         Gross Margin                 12.71       14.08       13.96              10.8%       0.8%

                                                                Gross Margin %               54%         55%         56%                0.3%        -1.5%
  Revenues ahead of Prospectus
  Forecast by 3.7%                                              Operating Costs              (14.24)     (14.61)     (14.47)            2.6%        1.0%

                                                                Other Income / Costs         0.01        0.06        (0.02)
  Gross margin 55%, up 0.7% on FY-18 on a constant
                                                                Adjusted EBITDA              (1.52)      (0.48)      (0.53)             68.8%       9.9%
  currency (CCY) basis, due to leverage gained from
  processing further work via Ray platform                      Adjusted EBITDA Margin % -6.5%           -1.8%       -2.1%              4.7%        0.3%
                                                                D&A                          (0.37)      (0.47)      (0.44)

  Gross margin down on prospectus forecast by –1.1% on          Adjusted EBIT                (1.90)      (0.95)      (0.97)             50.0%       2.2%
  CCY basis, due to delays of integrating additional work via
  workbench and due to the mix of work processed                Adjusted EBIT Margin %       -8.1%       -3.7%       -3.9%              4.4%        0.2%

  Costs under control and up by 2.6%. Scale benefits
  flowing with cost growth below revenue growth
  rate

  Adjusted EBITDA loss of ($0.48m) ahead of
  Prospectus Forecast by 9.9% and improving by
  69% on FY18                                                    Note: Earnings adjusted for non recurring costs and amortisation on acquired
                                                                 intangibles. Excludes Com acquisition which was not included prospectus forecast

  Adjusted EBIT loss of ($0.95m) ahead of                                                                                                                   !9
  Prospectus Forecast
FY19 Results Presentation Straker Translations (ASX.STG) 28 May 2019
Operating Cashflow
                                                                                              Pro-forma   Pro-forma   Prospectus    PF ^        PF ^
                                                                                                FY18        FY19      FY Mar-19    v FY18   v Prospectus
                                                          Adjusted EBITDA                      (1.52)      (0.48)       (0.53)     68.8%       9.9%
Improves 30% YoY                                          Non-cash items in EBITDA              0.05            -         -
                                                          Non-operating expenses                (0.24)          -       (0.06)
                                                          Changes in working capital            0.27        (0.53)      (0.51)
  Operating cashflow ahead of                              Operating cash flow                   (1.44)      (1.01)       (1.10)     29.8%       8.2%
  prospectus forecast                                     Payments for capitalised software
                                                                                                (0.66)      (0.80)      (0.72)
                                                          development

                                                          Payments for plant & equipment        (0.11)      (0.06)      (0.04)
 Straker continues to invest in the RAY platform, with    IPO costs                               -                       -
 15% of total costs R&D related and of this $0.8m is      Free cash flow                        (2.20)      (1.86)       (1.86)     15.5%       -0.1%
 capitalised                                              Income tax paid                       0.07        0.12         0.22

                                                          Net interest income / (expense)       0.03        (0.04)       0.02

                                                          Payment of deferred consideration       -             -         -
  DSOs strong at 63 days
                                                          Ordinary shares redeemed              (3.08)          -         -
                                                          Proceeds from issue of shares         11.27           -         -
                                                          Cost of share issue                   (0.49)          -         -
 Closed with $17.7m in bank and in strong
                                                          Net cash flow                          5.59       (1.78)       (1.61)     131.7%     -10.0%
 position to fund growth strategy

                                                          Cash & cash equivalents               7.8        17.7

                                                          DSO                                   57         63

                                                         DSO: Days Sales Outstanding
                                                                                                                                               !10
Well placed to continue
  growth trajectory

                          !11
TECHNOLOGY INVESTMENT IN OUR PLATFORM
We have made significant investments in our technology and R&D

           We have more than 20 highly efficient
                                                                Setup an office in Gisborne to give talented
           technology staff. Currently looking to grow
                                                                staff with families a lifestyle choice location
           tech team by 20% in FY20

                                                                 A.I. driven customer and translator
           52m words translated, 100 billion A.I. data           segmentation engines built and deliver A.I.
           points added to platform                              driven process decisions with 95% accuracy

                                                                 R&D investment focused on increasing margins,
           Platform has scaled effortlessly as load               simplifying content flow, unique offerings for
           has increased with growth                             Enterprise customers and speed of integration
                                                                 of acquired companies.

12
THE INDUSTRY THAT WE OPERATE IN
      70

                                                                         66B    Industry Size USD$

                                                                  56B
     52.5                                                                       Forecast to reach 66 Billion by 2022

                                                   47B
                                           43B                                  2018 - 2022 CAGR 7%*
                                    40B
      35                    37B
                     35B
             33B
                                                                                The translation industry
                                                                                facilitates trillions of dollars
     17.5
                                                                                of global trade annually

                                                             0B
       0
            2013    2014    2015   2016    2017   2018            2021   2022

            *nimdzi 2018 Language services market analysis

13
OUR GROWTH STRATEGY

                                  Five Point Growth Strategy

     Winning new                                                              Increased
                           Transactional          Integration into
      enterprise                                                          penetration with          Acquisitions
                             Revenue             content platforms
     customers                                                           existing customers

            Straker raised funds at its October 2018 IPO to continue its inorganic growth strategy and
                 the acquisition of COM Translations is the continued execution of this strategy

14
ORGANIC GROWTH

             Winning new                   Transactional             Integration into   Increased penetration
         enterprise customers                 revenue               content platforms   with existing customers

 • Secure large volume          •   Provides cash flow      •   Directly market to        •   Winning new divisions
     enterprise customers           benefits                    platforms’ broad              of existing customers
                                                               customer bases
 • Straker invested in          •   Drives smaller jobs
                                                                                         •   Expanding our
     global enterprise sales        that provide a range
                                                           •   Continue to invest in         relationships into
     team over the previous         of ancillary benefits       new integrations /            other geographies we
     two years
                                •   Driven by online           refining the                   have a presence
                                    advertising and            integrations
 • 20 enterprise
     salespeople across             content marketing
     seven countries                                       •   Medium term revenue
                                                               targets
 • Using our data-driven
     unique platform
     benefits

15
ACQUISITION OPPORTUNITY

                Fragmented Industry          Increase EBITDA %              Templated Acquisition Structure

   Language services market revenue – over
      18,500 language service providers      • Improve the target’s gross        • Compounding gains on
                                               margins                             each acquisition
Top 100 service providers =
  15% including Straker                      • Grow target’s customer            • Dedicated integration
                                               base and revenues                   team
                       15%
                                             • Cost synergies                    • Standard approach to
                                                                                   negotiation
                                             • Geographical footprint
                                                                                 • Continuous
                                             • Economies of scale                  identification and
                                                                                   engagement of targets
                              85%

  16
ACQUISITION STRATEGY
 The focus of our acquisition strategy is on Asia Pacific (specifically Japan and Australasia), USA, Spain, DACH region,
 Benelux and the UK. In all these regions (outside of Benelux) we have well functioning business units making integration
 easier and faster which will have the flow effect of getting operating leverage from our technology earlier.

        Benelux
          20                                      We estimate the total revenue of all the acquisition targets
                                                  we have identified and validated as being around $1.5bn

       AP      Germany                             Revenue range of target companies between $3-15m
       21         26
                          Spain
                           51
                                                   Majority of targets being below the $10m revenue range

     USA                                           Focus still on companies doing majority of translation
                          UK
     120                  55
                                                   Some potential in profitable audio-visual localisation related companies

17
KEY PRIORITIES FOR FY20

      Work on using our data-driven approach to win new enterprise customers especially around the need for
      translation data within A.I. engines

      Rationalise our global infrastructure as we grow and leverage economies of scale

      Focus on simplifying content on-ramps

       Continue to proactively look for quality bolt-on acquisitions

       Simplify the integration of acquisitions

 18
Appendix

           !19
PRO FORMA REVENUE BY REGION
Revenue mix in EMEA and APAC increase slightly in FY19
            FY-18 Composition                            FY-19 Composition

                     13%                                                14%
          36%                                        34%

                        51%                                               52%

         APAC         EMEA      NAM                 APAC                 EMEA                 NAM

                                                   Includes recent acquisition COM Translations

20
FY-19 PRO-FORMA REVENUE GROWS BY 10.2%

 Pro-forma revenues including COM increase to $27.4 (NZ$m)   Growth driven organically largely by repeat base (83% of mix) (NZ$m)

            FY-19 Pro-forma Revenue Growth                            FY-19 Pro-forma New v Repeat Growth
      26                                                     30
                                    25.8
                10.2%
     24.5                                                    25                         14.2%                4.4
                                                                              3.9
      23
                  23.4
                                                             20                                           21.4
                                                                                            9.4%
                                                                             19.5

     21.5                                                    15

      20                                                     10
                 FY-18              FY-19                                    FY-18                        FY-19
                                                                                      Proforma      Repeat

21
Year on Year                                                                              Pro-forma Pro-forma
                                                                                               FY18       FY19
                                                                                                                           PF ^
                                                                                                                         v FY18
                                                                                                                                          PF ^
                                                                                                                                  v Prospectus

Performance Improves
                                                     Adjusted EBITDA                           (1.52)    (0.48)          68.8%            9.9%
                                                     Non-operating                             (0.29)    (0.05)
                                                     EBITDA                                    (1.82)    (0.53)          70.9%            9.9%
                                                     EBITDA Margin %                          -7.8%      -2.0%             5.7%           0.3%
                                                     D&A                                       (0.37)    (0.47)
  After adding back non-operating costs, Straker
                                                     Amortisation on Acq Intangibles*          (0.38)    (0.68)
  has an EBITDA loss of ($0.53m), up 71% on prior
                                                     EBIT                                      (2.57)    (1.68)          34.4%            2.4%
  year and ahead of prospectus forecast              EBIT Margin %                           -11.0%      -6.5%             4.4%           0.4%

  Including amortisation on acquired intangibles
  the EBIT loss is ($1.7m), up 34% on FY-18 and up
  on prospectus forecast

                                                        Note: The company has recently valued customer relationship assets acquired from
                                                        MSS and Eule. As a result, there is an additional $303k of amortisation on acquired
 Pro-forma Reconciliation to non-                       intangibles included in the results that was not forecast in the prospectus. The
                                                        prospectus forecast has been updated accordingly.
 adjusted performance FY-19
                                                                                                                                         !22
Statutory Financials                                                                                   Stat     Stat      Stat ^
                                                                                                       FY18     FY19     v FY18
                                                    Revenue                                        17.03       24.59     44.4%
 Revenue growth of 44% on prior
                                                    Gross Margin                                       9.29    13.43     44.5%
 year, driven by both acquisitions and
                                                    Gross Margin %                                     55%      55%        0.0%
 organic activity
                                                    Operating Costs                               (10.72)     (13.67)    27.5%
                                                    Other Income / Costs                               0.01     0.08
  Gross Margin 55%, up 0.4% on FY-18 on a           Adjusted EBITDA                                (1.43)      (0.16)    88.8%
  constant currency basis                           Adjusted EBITDA Margin %                       -8.4%       -0.6%      7.7%
                                                    D&A                                            (0.31)      (0.46)
 Costs up by 27% due to impact of acquisitions      Adjusted EBIT                                  (1.73)      (0.62)    64.3%
 and due to investment in sales and R&D             Adjusted EBIT Margin %                        -10.2%       -2.5%       7.7%

                                                    Acquisition costs                              (0.20)      (0.59)
 Adjusted EBITDA loss of ($0.16m) up 89% on
                                                    Non-operating                                  (0.24)      (2.12)
 FY18
                                                    EBITDA                                         (1.86)      (2.88)    -54.9%
 EBITDA loss of ($2.88m) includes cost of IPO and   EBITDA Margin %                                -10.9%     -11.7%      -0.8%
 acquisition costs                                  D&A                                            (0.31)      (0.46)
                                                    Amortisation on Acq Intangibles*               (0.38)      (0.68)

 EBIT loss of ($4.02m) down -58% on prior year      EBIT                                           (2.54)      (4.02)    -58.3%

 due to above plus increased D&A costs              EBIT Margin %                                 -14.9%      -16.3%      -1.4%
                                                    Net Financing Costs                                0.91    (0.46)

 Net loss before tax of ($4.48m) after absorbing
                                                    PBT                                            (1.62)      (4.48)   -176.1%
 FX losses on proceeds of IPO

                                                       Note: Excludes COM acquisition for one month.
                                                                                                                              !23
Stat      Stat     Stat ^

Statutory Financials Cont..                          Adjusted EBITDA
                                                                                                      FY18
                                                                                                     (1.43)
                                                                                                                 FY19
                                                                                                                (0.16)
                                                                                                                          v FY18
                                                                                                                          88.8%
                                                     Non-cash items in EBITDA                           0.05
                                                     Non-operating expenses                          (0.24)     (0.17)
   Operating cashflow improves 14%                    Changes in working capital                         0.37    (0.73)
   on prior year                                     Operating cash flow                              (1.24)    (1.065)    14.0%
                                                     Payments for capitalised software development   (0.63)     (0.74)
   Underlying operating cashflow -$0.7m up 57%*       Payments for plant & equipment                  (0.05)     (0.10)
                                                     Free cash flow                                   (1.92)     (1.90)     0.7%

   Capitalised $0.74m of development costs           Payments for acquisitions of subsidiaries       (0.20)     (2.75)
                                                     Investing Cash Flow                             (0.20)     (2.75)   1308.0%
                                                     Proceeds from issue of shares                   11.27      20.07
   Invested $2.75m in acquisitions                   Ordinary shares redeemed                        (3.08)
                                                     Cost of share issue                             (0.54)     (3.25)
                                                     Payment of deferred consideration               (1.00)     (1.56)
   Successfully Executed IPO and raised net $16.8m   Financing Cash flow                                 6.65    15.27    129.5%

                                                     Net cash flow                                       4.54    10.62    133.9%
   Financed $1.56m of deferred consideration on
   prior acquisitions

                                                       *Note: Excludes Com acquisition for one month.
                                                                                                                           !24
Stat   Stat

Financial Position                           Cash & cash equililants
                                                                              FY18
                                                                               7.8
                                                                                     FY19
                                                                                     17.7
                                             Trade receivables and accruals    2.0    3.9

  DSOs increase to 67 days                   Other current assets              1.2    1.4
                                             Total Current Assets             11.0   22.9

  Closed with $17.7m in bank and in strong
                                             Intangibles                       5.1   10.3
  position to fund growth
                                             Non current assets                0.1    0.2
                                             Total Non Current Assets          5.2   10.5

                                             Trade payables and accruals       2.3    3.1
                                             Deferred consideration            0.8    1.3
                                             Other current assets              0.2    0.8
                                             Total Current Assets              3.3    5.2
                                             Deferred consideration            0.9    1.8
                                             Total Non current liabilities     0.9    1.8

                                             Net Assets                       12.1   26.4

                                             DSO                               55     67

                                                                                            !25
STATUTORY TO PRO-FORMA RECONCILIATION
                                                          Actual   Actual   Prospectus
                                                          FY18     FY19     FY19
     Statutory revenue                                    17.03    24.59    23.48
     Less: impact of Com. acquisition not in prospectus   -        (0.19)   -

     Net impact of MSS acquisition                        3.25     0.49     0.49
     Net impact of Eule acquisition                       3.15     0.92     0.92
     Po-forma revenue                                     23.42    25.81    24.89

     Statutory Adjusted EBITDA                            (1.43)   (0.16)   (0.20)
     Less: impact of Com acquisition not in prospectus    -        0.01     -
     Net impact of MSS acquisition                        0.48     0.00     0.00
     Net impact of Eule acquisition                       0.12     0.06     0.06
     Incremental public company costs                     (0.70)   (0.39)   (0.39)
     Pro-forma Adjusted EBITDA                            (1.52)   (0.48)   (0.53)

     Non-operating expenses                               (0.29)   (0.05)   (0.06)
     Pro-forma EBITDA                                     (1.82)   (0.53)   (0.59)

26
STRAKER’S INVESTMENT PROPOSITION
                        • Huge US$47 billion addressable market opportunity
 Huge Global TAM
                        • Industry is growing at over 7% pa

                       • Artificial Intelligence driven platform using more than 500 billion data points
 Unique Technology     • Proprietary “RAY Ai Translation Platform”
                       • Enterprise grade, end-to-end cloud-based platform that allows human translators to deliver
                         faster and more accurate translations via the capture of vast amounts of data and meta data

 Global Customers      Large and diverse customer base – approximately 8,400 customers serviced in FY18
                       88% of revenue is international

 Industry High Gross
                       Leveraging efficiency gains and improved economics from Strakers’ online platform
      Margins

27
The Problem
                                                             The speed of content change is
                                                               also increasing and traditional
Global content is expanding                                     translation providers cannot
 at an exponential rate and                                   deliver to customer timeframes
    traditional translation
 processes cannot deliver at
     scale for customers
                                         Content is moving into online
                                          systems and customers need
                                        solutions to automate the content
                                           flow for translatable content

                     It’s easy for companies to now push
                     into multiple regions but the cost of
                       large volume content into multiple
                             languages is prohibitive
                                                                                           !28
WHERE WE DO IT
                          UK/Europe
        North America      76 Staff
                         52% Revenue                         Asia
           14 Staff
                                                            6 Staff
        34% Revenue
                                                          3% Revenue

                                                               Australasia
                                                                38 Staff
                                                              11% Revenue

                        Straker Group Revenue by region
                             post COM acquisition

29
HOW WE DO IT
     We have a built a unique technology platform (RAY Ai) to leverage the advances in A.I and
     big data to give us a strong competitive advantage in the US$47 billion translation industry.

                                       A.I Data driven
                   Automation of          translation      Crowd of more
                                                                              Global sales and
                    the content        process using         than 12,000
                                                                              solutions team
                      process         more than 500         professionals
                                     Billion data points

30
REVOLUTIONARY DATA-DRIVEN PLATFORM

     Data-driven        Data-driven             Data-driven          Data-driven           Data-driven
       Speed              Quality               Production              value               security
 Using big data to
                     Rather than process         Using data to    Being able to offer       Using data to
   train machine
                         driven quality         streamline the        alternative       provide security and
 learning engines,
                      control we can use     production process     structures for       confidentiality to
 and give insights
                     machine learning to      by using previous       pricing and         projects even if
    into human
                        identify all the        project data to   delivering projects     using a remote
   efficiency and
                     variables to ensure      identify the most                              workforce
      continual
                      quality at the start   efficient method of
    refinements
                         of the project        processing a job

31
WHAT SUCCESS HAS PROVEN

         In 2011 we were the first company to develop a data driven approach to translation.

                       We have redefined how the translation process works and
                           aligned it to the business requirements of today

                         Unique                Variable cost            solutions that
                                                                                         83% of revenue
 Industry High        solutions for             base and                 give us tight
                                                                                            is repeat
 Gross Margins        world leading           efficient use of            relationships
                                                                                           customers
                       companies                  capital              with customers

32
WHAT WE DO

        Straker helps leading             Straker helps major
       technology companies               finance institutions
      streamline and scale the          deliver quarterly market
       ability to communicate              reports in multiple
            across regions                      languages

       Straker works with major
       e-commerce providers to          Straker enables global
         localise their product          media companies to
         websites into multiple       provide content in multiple
               languages              languages across multiple
                                               platforms

       Straker provides leading             Straker enables
      global manufacturers with         thousands of SME’s to
     the ability to easily push out      cost-effectively cross
      new products into multiple         border trade without
                markets                  language as a barrier

33
COMPANY HISTORY
                                                                                                                                          Acquired
     *$NZD FY19 Forecast Pro-forma Revenue                                                                                                 COM
                                                                                                                                $24.9m*
                                                                                                                          IPO

                                                                                                               Acquired
                                                                                               Acquired         MSS
                                                                                                Elanex
                                                                    Bailador                                   Acquired
                                                                  Investment                                    EULE
                                                                                    Acquired     $11.8m
                                                                                    Eurotext
                                                     Barcelona
 Technology Company                                  production          $8m
                                                       centre                                                                              Full Time
      Multi-lingual                Google driven                                                                                          Employees
 Content Management                  growth
                                                   $3m
 Software for websites                                                         30                         80                            140
                            $1m

      1999 - 2010           2011                   2013                   2015                    2017                           2019

34
Board of Directors

    Phil Norman                              Grant Straker                           Tim Williams                           Katrina Johnson                             Steve Donovan                          Paul Wilson
    Independent Non-Executive Chairman       Founder and Managing Director           Independent Non-Executive Director     Independent Non-Executive Director          Non-Executive Director                 Non-Executive Director

                                                                                  ▶Tim was appointed a Non-Executive      ▶Katrina was appointed a Non-             ▶Steve was appointed a Non-            ▶Paul was appointed a Non-
▶Phil was appointed the Non-             ▶Prior to founding Straker in 1999,
                                                                                  Director of Straker on 24 June 2015.    Executive Director of Straker on 3 July   Executive Director of Straker on 1     Executive Director of Straker on 22
Executive Chairman of Straker on 13      Grant served in the British Army as
                                                                                                                          2018.                                     December 2004.                         September 2015.
January 2014.                            an elite paratrooper.
                                                                                  ▶He founded ValueCommerce Co.            ▶Katrina has over 15 years of
▶He was the founding chairman of                                                  Ltd in 1996.                                                                      ▶He is a former partner of Ernst &     ▶He is a co-founder of ASX listed
                                         ▶As a co-founder of Straker, Grant                                               specialist in-house legal experience
                                                                                                                                                                    Young. He qualified as a Chartered      Bailador Technology Investments
Xero Limited, one of New Zealand’s       has extensive experience in the                                                  within technology
                                                                                  ▶Tim is one of the original pioneers                                              Accountant in the UK and has           (which is a major shareholder of
most successful listed technology        language translation market.
                                                                                  in the Japanese internet and            companies, including executive            operated within the IT and finance      Straker). He has had extensive private
companies, and retired from Xero’s
                                         ▶Grant was appointed to the board        advertising industry. His vision and    leadership and board member roles.        industry in New Zealand for a          equity investment experience as a
Board in July 2012 after five years’
                                         on 21 December 1999.                     record of achievement are                                                         number of years.                       director of CHAMP Private Equity in
service.
                                                                                  demonstrated by the success and         ▶Katrina joined Uber in April 2015,                                              Sydney and New York, with MetLife in
▶Phil’s other current director roles     ▶Grant’s wide ranging technical,         growth of ValueCommerce Co. Ltd.        after spending 12 years with the eBay     ▶Steve has significant experience as    London, and as executive director at
                                         sales and business skills, combined      Tim founded ValueCommerce, an           group of companies in Australia and       a director and investor in the SME
include the Independent                                                                                                                                                                                    media focussed investment group,
                                         with his strong entrepreneurial drive,   Internet affiliate marketing company,     the United States. She now leads          sector in New Zealand, including a
Chairmanship of Loyalty New Zealand                                                                                                                                                                        Illyria.
                                         have placed him in an ideal position     selling a 49% stake to Yahoo Japan in   Uber’s Legal Team for Asia Pacific and     Finance Director role at accounting
Limited (New Zealand’s largest loyalty
                                         to help accelerate the growth of         2005. Subsequently in 2007,             is a member of Uber’s APAC Regional       software provider, Greentree           ▶Paul is a director of SiteMinder,
company and operator of Fly Buys),
                                         Straker.                                 ValueCommerce was listed on the         Leadership Team.                          Software Group, which was sold to      Stackla, Yellow (NZ), the Rajasthan
Chair of NZX listed Plexure Group
                                                                                  Tokyo Stock Exchange.                                                             MYOB in 2016. Other current            Royals IPL cricket franchise and ASX
Limited (NZX:PLX) (a marketing
                                         ▶Grant is a member of the NZ                                                     ▶Katrina is also an independent non-      directorships include, Buro Seating    listed Vita Group Limited.
services software company) and
                                         Institute of Directors.                  ▶Tim is also a Director of The          executive director of Trade Me Group      Limited (office chair wholesaler) and
Chair of AUT Ventures Limited (the
                                                                                  Icehouse, The University of             Limited, and a member of its Audit        New Zealand Pure Dairy Products        ▶Paul holds a Bachelor of Business
commercialisation arm of AUT
                                         ▶Along with Merryn Straker, Grant        Auckland’s technology incubator, and    and Risk Management Committee.            Limited (infant formula                (Banking and Finance), from
University).
                                         was the winner of the 2018 master        is a General Partner in The Icehouse                                              manufacturer).                         Queensland University of Technology
                                         category for NZ Entrepreneur of the      linked fund Tuhua Ventures, which       ▶Katrina holds a Bachelor of Arts                                                and is a Fellow of the Financial
▶Phil is a past Chairman of the New
                                         Year.                                    invests in high-growth start-ups in     and Bachelor of Laws (Hons) from          ▶Steve is Straker’s former Chief       Services Institute of Australia, a
Zealand Private Equity and Venture
                                                                                  New Zealand.                            Macquarie University, and a Graduate      Financial Officer and has been           Member of the Institute of Chartered
Capital Association and was for six
                                                                                                                          Diploma of Legal Practice from the        working with technology companies      Accountants of Australia and a
years a member of New Zealand
Trade and Enterprise’s New Zealand
                                                                                  ▶Tim holds a Bachelor of Science        College of Law, New South Wales.          across a range of industries.          Member of the Australian Institute of
                                                                                  (Hons) in molecular genetics from the   Katrina is a member of the Australian                                            Company Directors.
Beachheads Advisory Board.                                                                                                                                          ▶Steve holds a Bachelor of
                                                                                  University of Canterbury.               Institute of Company Directors.
                                                                                                                                                                    Economics from the University of
▶Phil holds an MBA from the
                                                                                                                                                                    Lancaster and is a qualified
University of Auckland and is a

                                                                                                                                                                                                                                            !35
                                                                                                                                                                    Chartered Accountant and a current
Chartered Member of the New
                                                                                                                                                                    member of the Institute of Chartered
Zealand Institute of Directors.
                                                                                                                                                                    Accountants in England and Wales.
Executive Team

Grant Straker
Founder and Managing Director
                                   David Sowerby                            Haydn Marks                                    Indy Nagpal                              Merryn Straker                           Kim Andrews
                                   Chief Revenue Officer                      Chief Financial Officer                          Chief Technology Officer                   Chief Operating Officer                    Chief People Officer

As per above                    ▶David was appointed Chief Revenue                                                     ▶Indy was appointed Chief Technology       ▶Merryn was appointed Chief Operating
                                                                           ▶Haydn was appointed Chief Financial                                                                                            ▶Kim was appointed Chief
                                Officer in 2008 and is based in Ireland.     Officer in October 2016.                      Officer in 2005.                             Officer in 2000.                           People Officer in 2013.
                                ▶He was an early investor in Straker       ▶With more than 18 years’ financial          ▶He has over two decades of                ▶She was a co-founder of Straker.
                                and has supported the growth of the                                                    experience in the information                                                       ▶Prior to joining Straker, Kim
                                                                           management experience, Haydn has                                                                                                worked in the
                                business globally since the foundation                                                 technology industry, during which he       ▶Prior to co-founding Straker, Merryn
                                                                           worked                                                                                                                          telecommunications industry for
                                of the Company as a translation                                                        has consulted and worked for a range of    worked as a marketing executive in the
                                                                           in and around the technology sector, in                                                                                         16 years
                                provider.                                                                              companies across the globe.                pharmaceutical industry.
                                                                           London, for global companies such as
                                                                           Temenos (software), Credit Suisse and                                                  ▶She is a board member of the Cerebral   and has a strong background in
                                ▶David is responsible for global revenue                                               ▶At Straker, he is responsible for
                                including building out the team that       Visa Europe, as well as PKF (advisory) in                                              Palsy Society of New Zealand with        leadership, HR and credit
                                                                                                                       architecting and maintaining a reliable,
                                engages with customers, lifting the        NZ.                                                                                    NZ$28 million worth of assets and a      management.
                                                                                                                       scalable and secure platform. This
                                brand profile of the Company across                                                     includes building a robust team, web       board member of Te Tiro Toi
                                                                           ▶He has a keen interest in all                                                                                                  ▶Kim was in the HR Leadership
                                active markets and ensuring newly                                                      application development, database          Whakangaio, a NZ Government backed
                                                                           commercial aspects of the business,
                                acquired staff are retained.                                                                                                       Maori Technology business initiative.    team at Vodafone prior to joining
                                                                           including pricing and contract              management, data analytics, hardware,
                                                                                                                                                                                                           Straker.
                                                                           negotiations, is involved in planning,      network and security systems.
                                ▶David has an MBA from Trinity College,                                                                                           ▶Merryn has a Bachelor of
                                Dublin.                                    board reporting, capital raising, cash                                                 Management Studies (majoring in
                                                                                                                       ▶He has a Masters’ degree in Applied
                                                                           management and compliance.                                                             management and HR) from Waikato
                                                                                                                       Psychology and a Post Graduate
                                                                                                                       Diploma in Internet Management.            University.
                                                                           ▶He is a member of the Institute of
                                                                           Chartered Accountants Australia and
                                                                           New Zealand and holds a Bachelor of
                                                                           Business from Massey University.

                                                                                                                                                                                                                                  !36
DISCLOSURE STATEMENT
This presentation is given on behalf of Straker Translations Limited ASX:STG (Company number NZ: 1008867 / AU: ARBN 628 707 399)
Information in this presentation:

• Is for general information purposes only, and is not an offer or invitation for
  purchase, or recommendation of securities in Straker Translations Limited
                                                                                      All information in this presentation is current at 28 May 2019,
  (Straker)
                                                                                      unless otherwise stated.
• Should be read in conjunction with, and is subject to, Straker’s latest and prior
                                                                                      All currency amounts are in NZ dollars, unless otherwise stated.
  interim and annual reports, including Straker’s Appendix 4E Preliminary Final
  Report for the period ended 31 March 2019, and Straker’s market releases on
  the ASX

• Includes forward-looking statements about Straker and the environment in
  which Straker operates, which are subject to uncertainties and contingencies
  outside of Straker’s control - Straker’s actual results or performance may differ
  materially from these statements

• Includes statements relating to past performance, which should not be
  regarded as a reliable indicator of future performance

• May contain information from third parties believed to be reliable; however, no
  representations or warranties are made as to the accuracy or completeness of
  such information, and

37
Investor call
 Contact
       An investor call regarding the Company’s FY19 results will be held
       today at 10:30am Australia Eastern Time (12:30pm New Zealand
       Standard Time).

       For those wishing to dial into the call, please dial your respective
       local number below and provide the conference ID 10000399 to the
       operator:

       AUSTRALIA TOLL/INTERNATIONAL            +61 2 9007 3187
       AUSTRALIA TOLL-FREE                  1 800 558 698
       NEW ZEALAND TOLL-FREE                0800 453 055

     www.strakertranslations.com
      Grant Straker
      CEO
      grant@strakergroup.com

      Ronn Bechler
      Market Eye
      ronn.bechler@marketeye.com.au
38
You can also read