W. P. Carey Inc. Investor Presentation - 1Q21 Investing for the long run
←
→
Page content transcription
If your browser does not render page correctly, please read the page content below

W. P. Carey Inc.
                              Investor Presentation
                              1Q21

Investing for the long run®
Investing for the long run®

Table of Contents
1. Overview
2. Real Estate Portfolio
3. Balance Sheet
4. Investment Management
5. COVID-19 Update

        Unless otherwise noted, all data in this presentation is as of March 31, 2021. Amounts may not sum to totals due to rounding.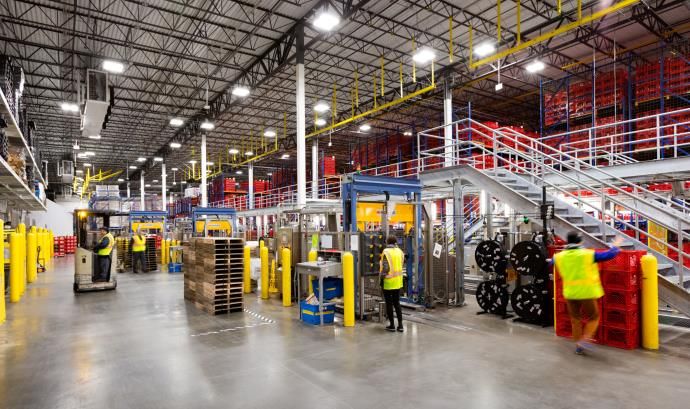
1. Overview
Company Highlights
W. P. Carey (NYSE: WPC) is a REIT that specializes in investing in net lease commercial real estate,
primarily in the U.S. and Northern and Western Europe

     One of the largest owners of net lease assets
     and among the top 25 REITs in the MSCI US REIT Index

     Highly diversified portfolio by geography, tenant, property type
     and tenant industry

     Successful track record of investing and operating through
     multiple economic cycles since 1973 led by an experienced             Orgill | Warehouse | Inwood, WV
     management team

     U.S. and Europe-based asset management teams

     Investment grade balance sheet with access to multiple
     forms of capital

     Executed on our strategy to become a pure-play net lease REIT,
     advanced through our 2018 merger with CPA:17 and 2020
     internalization of the CWI REITs, with earnings currently generated   Turkey Hill | Industrial | Conestoga, PA
     almost entirely from higher-quality real estate revenues
Investing for the Long Run® | 4
Business Model and Structure (1)
W. P. Carey is the largest diversified net lease REIT

                                 Public REIT (NYSE: WPC)
                              ~$19 billion of Enterprise Value (2)

                                       Real Estate Portfolio (3)                                                                        Advisor to $2.9 billion of AUM

      1,261 net lease properties / 146 million sq. ft. / 10.6 year WALT / $1.2 billion
      of ABR
                                                                                                                                     Corporate Property Associates 18 –
        • Primarily industrial, warehouse, office, retail and self-storage                                                         Global (CPA:18) – Diversified / Net lease
          (net lease)
        • 351 tenants; top 10 tenants represent 21.5% of ABR
        • Properties located primarily in U.S. and Europe
        • 98.3% occupancy
                                                                                                                                    Carey European Student Housing Fund
        • >99% of leases have contractual rent increases, including 61%                                                                   (CESH) Student Housing
          linked to CPI

(1)   Data as of or for the quarter ended March 31, 2021 unless otherwise noted.
(2)   Enterprise value represents equity market capitalization based on a stock price of $70.76 as of March 31, 2021, plus pro rata debt outstanding, less consolidated cash and cash equivalents.
(3)   Portfolio information reflects pro rata ownership of real estate assets, excluding operating properties. “WALT” represents we ighted average lease term and “ABR” represents pro rata contractual
      minimum annualized base rent (see definitions in Disclosures).
Investing for the Long Run® | 5
Investment Strategy
• Generate attractive risk-adjusted returns by             Transactions Evaluated on Four Key Factors
  identifying and investing in net-lease commercial
  real estate, primarily in the U.S. and Northern &                                 • Industry drivers and trends
  Western Europe
                                                             Creditworthiness       • Competitor analysis
• Protect downside by combining credit and real              of Tenant              • Company history
  estate underwriting with sophisticated structuring
  and direct origination                                                            • Financial wherewithal

• Acquire “mission-critical” assets essential to a                                  • Key distribution facility or profitable
  tenant’s operations                                                                 manufacturing plant

                                                             Criticality of Asset   • Critical R&D or data-center
• Create upside through lease escalations, credit
  improvements and real estate appreciation                                         • Top performing retail stores
                                                                                    • Corporate headquarters
• Capitalize on existing tenant relationships
  through accretive expansions, renovations and                                     • Local market analysis
  follow-on deals                                                                   • Property condition
                                                             Fundamental Value
                                                             of the Underlying      • 3rd party valuation /
• Hallmarks of our approach:
                                                                                      replacement cost
                                                             Real Estate
    – Diversification by tenant, industry, property type                            • Downside analysis / cost
      and geography                                                                   to re-lease

    – Disciplined                                                                   • Lease terms – rent growth and
                                                             Transaction              maturity
    – Opportunistic
                                                             Structure              • Financial covenants
    – Proactive asset management                             and Pricing            • Security deposits / letters
                                                                                      of credit
    – Conservative capital structure

Investing for the Long Run® | 6
Proactive Asset Management
Domestic and international asset management capabilities to address lease expirations, changing
tenant credit profiles and asset repositioning or dispositions
• Asset management offices in New York and Amsterdam
• W. P. Carey has proven experience repositioning assets through re-leasing, restructuring and strategic disposition
• Generates value creation opportunities within our existing portfolio
• Five-point internal rating scale used to assess and monitor tenant credit and the quality, location and criticality of each asset

   Asset Management Expertise                                   Asset Management Risk Analysis

 Transaction                      Operational
                                                              Tenant         Bankruptcy          Watch List       Stable       Implied IG
                                                                                                                                             Investment
 • Leasing                        • Lease compliance          Credit
                                                                                                                                                Grade

 • Dispositions                   • Insurance
                                                              Asset
                                                                             Obsolete           Residual Risk         Stable       Class B      Class A
                                                              Quality
 • Lease modifications            • Property inspections

 • Credit and real estate         • Non-triple net lease
   risk analysis                    administration            Asset                         Limited Tenant      Alternative
                                                                                                                                 Good
                                                                                                                                             Prime Location
                                                                            No Tenant          Demand /                        Location /
                                                                                                                  Tenant                      / High Tenant
                                                                             Demand          Challenging                        Active
                                                              Location                                           Demand
                                                                                                                                Market
                                                                                                                                                 Demand
 • Building expansions            • Real estate                                                Location

   and redevelopment                tax

 • Tenant distress and            • Projections and           Asset                              Non-           Possible        Critical-       Highly
                                                                             Not Critical                                       Renewal
   restructuring                    portfolio valuation                                         Renewal         Renewal                         Critical
                                                              Criticality                                                        Likely

Investing for the Long Run® | 7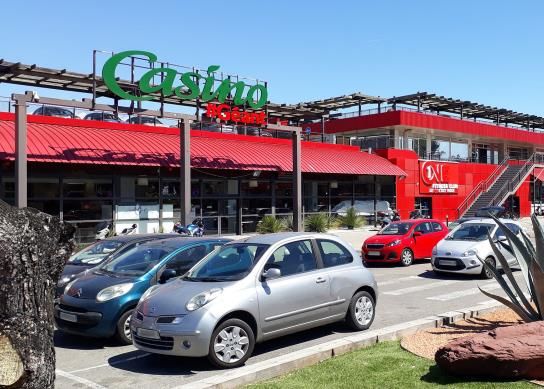
2. Real Estate Portfolio
Large Diversified Portfolio (1)

  Number of Properties                                                                                                                           1,261

  Number of Tenants                                                                                                                                351

  Square Footage                                                                                                                            146 million

  ABR                                                                                                                                       $1.2 billion

  US / Europe / Other (% of ABR)                                                                                                        62% / 36% / 2%

  Contractual Rent Escalation: CPI-linked / Fixed / Other                                                                               61% / 35% / 4%

  WALT                                                                                                                                      10.6 years

  Occupancy                                                                                                                                      98.3%

  Investment Grade Tenants (% of ABR)                                                                                                            29.7%

  Top 10 Tenant Concentration (% of ABR)                                                                                                         21.5%

(1)   Portfolio information reflects pro rata ownership of real estate assets (excluding operating properties) as of March 31, 2021 .
Investing for the Long Run® | 9

Property and Industry Diversification                                                         (1)

                  By Property Type (% of ABR)                                                                                             By Tenant Industry (% of ABR)

                                   8%                                                 47%
                                                                            Industrial / Warehouse                                                   15%
                        5%                                                                                                                                                          22%
                                                             25%
                                                                                                                                          3%
                                                                                                                                        3%
              18%                                                                                                                      3%
                                                                                                                                      3%
                                                                                                                                                                                               8%
                                                                                                                                       4%
                                                                                                                                         4%
                                                                                                                                                                                           7%
                                                              22%                                                                            4%
                                                                                                                                                  5%                                6%
                           22%
                                                                                                                                                         5%       5%       5%

                                                                                                                                               Retail Stores (2)                              22%
                                                                                                                                               Consumer Services                               8%
                                                                                                                                               Automotive                                      7%
                         Industrial                             25%                                                                            Grocery                                         6%
                                                                                                                                               Cargo Transportation                            5%
                         Warehouse                              22%
                                                                                                                                               Beverage and Food                               5%
                         Office                                 22%                                                                            Healthcare and Pharmaceuticals                  5%
                                  (2)                                                                                                          Business Services                               5%
                         Retail                                 18%
                                                                                                                                               Construction and Building                       4%
                         Self-storage (Net Lease)                5%                                                                            Capital Equipment                               4%
                         Other    (3)                            8%                                                                            Sovereign and Public Finance                    4%
                                                                                                                                               Hotel and Leisure                               3%
                                                                                                                                               Containers, Packaging, and Glass                3%
                                                                                                                                               Durable Consumer Goods                          3%
                                                                                                                                               High Tech Industries                            3%
(1)   Portfolio information reflects pro rata ownership of real estate assets (excluding operating properties) as of March 31, 2021 .          Other (4)                                      13%
(2)   Includes automotive dealerships.
(3)   Includes education facilities, hotel (net lease), laboratory, fitness facility, theater, student housing (net lease), restaurant and land.
(4)   Includes tenants in the following industries: insurance, banking, telecommunications, aerospace and defense, chemicals, plastics and rubber, media: advertising, printing and publishing, media:
      broadcasting and subscription, wholesale, non-durable consumer goods, oil and gas, metals and mining, environmental industries, electricity, consumer transportation, forest products and
      paper, real estate and finance.
Investing for the Long Run® | 10
Top Ten Tenants (1)
One of the lowest Top 10 concentrations among net lease peer group
Number of ABR WALT % of
Tenant Description
Properties ($ millions) (years) Total
Net lease self-storage properties in the U.S. 78 $39 3.1 3.3%
Do-it-yourself retail properties in Germany (2) 42 35 15.9 2.9%
Government office properties in Spain 70 31 13.7 2.6%
State of Andalucia
Business-to-business wholesale stores in Italy & Germany 20 28 6.0 2.4%
Automotive dealerships in the United Kingdom 69 24 9.2 2.0%
Net lease self-storage properties in the U.S. 27 21 23.1 1.7%
Distribution facilities in the U.S. 30 20 11.8 1.7%
Net lease hotel properties in the U.S. 18 20 2.6 1.7%
K-12 private schools in the U.S. 3 19 22.5 1.6%
Industrial properties in the U.S. and Canada 27 19 22.2 1.6%
Top 10 384 $255 12.1 yrs 21.5%
(1) Portfolio information reflects pro rata ownership of real estate assets (excluding operating properties) as of March 31, 2021 .
(2) In April 2021, we sold seven properties leased to this tenant with total ABR of $5.6 million as of March 31, 2021.
Investing for the Long Run® | 11Geographic Diversification (1)
W. P. Carey has been investing internationally for 22 years, primarily in Northern and Western Europe
Other (2), 2%,
$24MM
Europe, 36%,
$422 MM
United States,
62%, $739 MM
(1) Portfolio information reflects pro rata ownership of real estate assets (excluding operating properties) as of March 31, 2021 .
(2) Includes Canada (1.1%), Mexico (0.7%) and Japan (0.2%).
Investing for the Long Run® | 12Internal Growth from Contractual Rent Increases (1)
Over 99% of leases have contractual rent increases, including 61% linked to CPI
None, 0.5%
(2)
Other, 4%
Uncapped
CPI, 38%
Fixed, 35%
61% CPI-linked
CPI-based,
23%
(1) Portfolio information reflects pro rata ownership of real estate assets (excluding operating properties) as of March 31, 2021 .
(2) Represents leases with percentage rent (i.e., participation in the gross revenues of the tenant above a stated level) and other increases.
Investing for the Long Run® | 13Same-Store ABR Growth
Contractual same store growth of 1.6%
Contractual Same Store Growth
2.2%
2.2%
2.0%
2.0% 1.9%
1.8%
1.8%
1.6% 1.6% 1.6% 1.6%
1.6% 1.5% 1.5% 1.5%
1.4%
1.4%
1.2%
1.0%
0.8%
0.6%
0.4%
0.2%
0.0%
2Q18 3Q18 4Q18 1Q19 2Q19 3Q19 4Q19 1Q20 2Q20 3Q20 4Q20 1Q21
(1) Contractual same store portfolio includes leases that were continuously in place during the period from March 31, 2020 to March 31, 2021. Excludes leases for properties that were acquired, sold
or vacated, or were subject to lease renewals, extensions or modifications at any time that affected ABR during that period. For purposes of comparability, ABR is presented on a constant currency
basis using exchange rates as of March 31, 2021.
Investing for the Long Run® | 14Lease Expirations and Average Lease Term (1)
Weighted average lease term of 10.6 years
Lease Expirations (% ABR) (2)
50%
44.2%
40%
30%
20%
10%
8.2% 6.1%
5.3% 5.3% 5.3% 5.8% 6.0%
4.5% 4.6%
3.4%
1.3%
0%
2021 2022 2023 2024 2025 2026 2027 2028 2029 2030 2031 Thereafter
(1) Portfolio information reflects pro rata ownership of real estate assets (excluding operating properties) as of March 31, 2021 .
(2) Assumes tenants do not exercise any renewal or purchase options.
Investing for the Long Run® | 15Historical Occupancy (1)
Stable occupancy maintained during the aftermath of the global financial crisis and the COVID-19 pandemic
Occupancy (% Square Feet) (2)
100%
98.4% 98.8% 99.0% 99.2% 99.3% 99.8% 98.3% 98.9% 98.5% 98.3%
97.1% 96.6% 97.3%
80%
60%
40%
20%
0%
2009 2010 2011 2012 2013 2014 2015 2016 2017 2018 2019 2020 2021
(1) Includes W. P. Carey and the following CPA REITs: Corporate Property Associates 12 Incorporated, Corporate Property Associate s 14 Incorporated, Corporate Property Associates 15 Incorporated,
Corporate Property Associates 16 – Global Incorporated, Corporate Property Associates 17 – Global Incorporated (CPA:17) and CPA:18, as applicable. Portfolio information excludes operating
properties.
(2) Represents occupancy for each completed year at December 31, otherwise occupancy shown is for the most recent quarter.
Investing for the Long Run® | 16Recent Acquisitions – Case Studies
Completed investments totaling $3.0 billion since the beginning of 2018
• Comprised of acquisitions totaling $2.5 billion and $550 million of completed capital investments
Recent Acquisitions
Prima Wawona Nexeo Plastics Casino Guichard-Perrachon S.A.
February 2021 February 2021 April 2021
Purchase Price: $75 million Purchase Price: $19 million Purchase Price: $119 million
Facility Type: Warehouse / Land Facility Type: Warehouse Facility Type: Retail
Location: Central Valley, CA Location: Ohio / South Carolina Location: Southern and Central France
Size: 1,031,600 square feet Size: 269,286 square feet Size: 424,797 square feet
Lease Term: 25-year lease Lease Term: 20-year lease Lease Term: 20-year lease
Rent Escalation: Fixed Rent Escalation: Fixed Rent Escalation: French CPI
Investing for the Long Run® | 17Capital Investments – Case Studies
Capital investments have become a more meaningful part of our investment activity
• Completed capital investment projects totaling $311 million since the start of 2020
• Approximately $180 million of projects are in process as of March 31, 2021, with $130 million scheduled to complete in 2021
Recent Development Activity
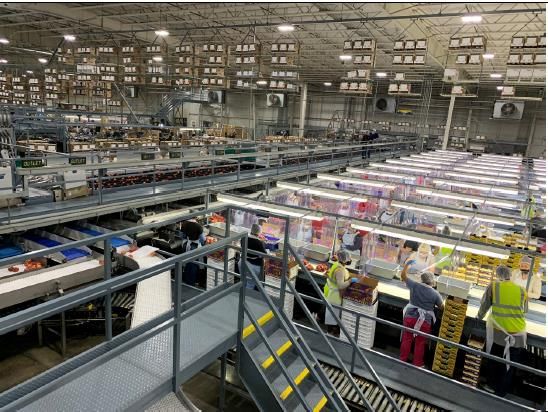
Sonae American Axle & Manufacturing Orgill
Completed September 2020 Completed February 2021 Expected Completion December
2022
Investment: $28 million expansion Investment: $52 million build-to-suit Investment: $20 million expansion
Facility Type: Warehouse Facility Type: Industrial Facility Type: Warehouse
Location: Portugal Location: Germany Location: U.S.
Size: 294,389 square feet Size: 162,373 square feet Size: 427,518 square feet
Lease Term: 20-year lease Lease Term: 20-year lease Lease Term: 20-year lease
Rent Escalation: CPI Rent Escalation: German CPI Rent Escalation: Fixed
Investing for the Long Run® | 183. Balance Sheet
Balance Sheet Overview
      Capitalization (%)                                                                               Capitalization ($MM)                                                           3/31/21
                                                                          2%                           Total Equity (1)                                                                  $12,561
                                                                     5%                                Pro Rata Net Debt
      Equity (1)                              65%                                                        Senior Unsecured Notes USD                                                            2,550

      Senior Unsecured Notes                  28%            28%                                         Senior Unsecured Notes EUR                                                            2,961

                                                                                  65%                    Mortgage Debt, pro rata USD                                                            551
      Mortgage Debt (pro rata)                5%
                                                                                                         Mortgage Debt, pro rata (EUR $330 / Other $48)                                         378
      Unsecured Revolving Credit              2%
      Facility / Term Loans                                                                              Unsecured Revolving Credit Facility USD                                                  –

                                                                                                         Unsecured Revolving Credit Facility (EUR — / Other $22)                                 22
      Capital Markets and Balance Sheet                                                                  Unsecured Term Loans (EUR $113 / GBP $206)                                             320

•     YTD 2021: Raised $171MM in net proceeds through ATM offering                                     Total Pro Rata Debt                                                                    $6,781

                                                                                                       Less: Cash and Cash Equivalents                                                         (229)
•     Feb 2021: Issued $425MM of 2.25% Senior Unsecured USD Notes due
      2033 to prepay secure debt                                                                       Total Pro Rata Net Debt                                                                $6,552

•     Feb 2021: Issued €525MM of 0.95% Senior Unsecured EUR notes due                                  Enterprise Value                                                                  $19,114
      2030 and used the proceeds to redeem the outstanding 2.00% Senior
                                                                                                       Total Capitalization                                                              $19,343
      Unsecured EUR notes due 2023
                                                                                                       Leverage Metrics
•     Oct 2020: Issued $500MM of 2.4% Senior Unsecured Notes due 2031
                                                                                                       Pro Rata Net Debt / Adjusted EBITDA              (2)(4)                                  5.9x
•     Jun 2020: Issued ~$382MM of equity through a forward offering,
                                                                                                       Pro Rata Net Debt / Enterprise Value            (1)(2)                                 34.3%
      settling approximately $200MM to date
                                                                                                       Total Consolidated Debt / Gross Assets             (3)                                 41.2%
•     Feb 2020: Amended and restated $2.1B credit facility, consisting of
      $1.8B revolving line of credit, £150MM term loan, and a €96.5MM                                  Weighted Average Interest Rate (pro rata)                                               2.7%
      delayed draw term loan
                                                                                                       Weighted Average Debt Maturity (pro rata)                                         5.9 years
(1)    Based on a closing stock price of $70.76 on March 31, 2021 and 177,520,962 common shares outstanding as of March 31, 2021.
(2)    Pro rata net debt to enterprise value and pro rata net debt to Adjusted EBITDA are based on pro rata debt less consolidated c ash and cash equivalents.
(3)    Gross assets represent consolidated total assets before accumulated depreciation on real estate. Gross assets are net of accumulated amortization on in-place lease and above-market
       rent intangible assets.
(4)    Adjusted EBITDA represents 1Q21 annualized Adjusted EBITDA, as reported in the Form 8-K filed with the SEC on April 30, 2021.
Investing for the Long Run® | 20
Debt Maturity Schedule
Principal at Maturity (1)
(2)
Mortgage Unsecured Unsecured Unsecured Unsecured
1,400 Debt Bonds (EUR) Bonds (USD) Term Loan Revolver
1,200
1,000
500
22
$MM
800 350
320
600
400 586
450 586 586 616
586
500
200 425
290 325
73 232
111 31 21
88
0
2021 2022 2023 2024 2025 2026 2027 2028 2029 2030 2031 2032 2033
% of Total (3) 1.1% 4.3% 3.5% 17.9% 13.1% 14.4% 9.1% 8.7% 4.9% 9.2% 7.5% – 6.3%
(3)
Interest Rate 3.6% 4.5% 3.0% 3.3% 2.9% 3.1% 2.2% 1.4% 3.9% 1.0% 2.4% – 2.3%
(1) Reflects amount due at maturity, excluding unamortized discount and unamortized deferred financing costs.
(2) Reflects pro rata balloon payments due at maturity. W. P. Carey has two additional fully amortizing mortgages due in 2028 ($9 MM) and 2031 ($3MM).
(3) Reflects the weighted average percentage of debt outstanding and the weighted average interest rate for each year based on the total outstanding balance.
Investing for the Long Run® | 21Unsecured Bond Covenants (1)
Investment grade balance sheet with Baa2/stable rating from Moody’s and BBB/stable rating
from S&P
Senior Unsecured Notes (2)
Metric Covenant March 31, 2021
Total Debt /
Total Leverage ≤ 60% 41.6%
Total Assets
Secured Debt /
Secured Debt Leverage ≤ 40% 4.6%
Total Assets
Consolidated EBITDA /
Fixed Charge Coverage ≥ 1.5x 5.7x
Annual Debt Service Charge
Maintenance of Unencumbered Unencumbered Assets /
≥ 150% 232.0%
Asset Value Total Unsecured Debt
(1) This is a summary of the key financial covenants for our Senior Unsecured Notes, along with estimated calculations of our compliance with those covenants at the end of the period presented.
These ratios are not measures of our liquidity or performance and serve only to demonstrate our ability to incur additional debt, as permitted by the covenants governing the Senior Unsecured Notes.
(2) As of March 31, 2021, our Senior Unsecured Notes consisted of the following note issuances: (i) $500 million 4.60% senior uns ecured notes due 2024, (ii) €500 million 2.25% senior unsecured notes
due 2024, (iii) $450 million 4.00% senior unsecured notes due 2025, (iv) $350 million 4.25% senior unsecured notes due 2026, (v) €500 million 2.25% senior unsecured notes due 2026, (vi) €500
million 2.125% senior unsecured notes due 2027, (vii) €500 million 1.35% senior unsecured notes due 2028, (viii) $325 million 3.85% senior unsecured notes due 2029, (ix) €525 million 0.95% senior
unsecured notes due 2030, (x) $500 million 2.40% senior unsecured notes due 2031, and (xi) $425 million 2.25% senior unsecure d notes due 2033.
Investing for the Long Run® | 22History of Consistent Dividend Growth
W. P. Carey has increased its dividend every year since going public in 1998
• Current annualized dividend of $4.19 with a yield of 5.9% (1)
• Conservative and stable payout ratio since conversion to a REIT in September 2012
Dividends per Share (2)
$5.00
$4.19
$4.14 $4.17
$3.93 $4.01 $4.09
$3.69 $3.83 $4.00
$3.39
Dividends per Share
$3.00
$2.44
$2.19
$1.96 $2.00 $2.03
$1.82 $1.88 $2.00
$1.72 $1.73 $1.76 $1.79
$1.65 $1.67 $1.69 $1.70
$1.00
$0.00
1998 1999 2000 2001 2002 2003 2004 2005 2006 2007 2008 2009 2010 2011 2012 2013 2014 2015 2016 2017 2018 2019 2020 2021
Note: Past performance does not guarantee future results.
(1) Based on a stock price of $70.76 as of March 31, 2021, and a cash dividend of $1.048 per share declared during 1Q21.
(2) Full year dividends declared per share, excluding special dividends. 2021 represents 1Q21 annualized.
Investing for the Long Run® | 234. Investment Management
Summary of Non-Traded Investment Programs
Total AUM of $2.9 billion, including $1.6 billion of net lease AUM
• CWI 1 and CWI 2 merged and internalized management in April 2020

• Closed merger with CPA:17 in October 2018

• Exited non-traded retail fundraising in June 2017

                                                                                      CPA:18                                                                      CESH

                                                                                                                                                                 Student
  Investment focus                                                           Diversified / Net Lease
                                                                                                                                                                 Housing

  Fundraising Status                                                                    Closed                                                                    Closed

  AUM                                                                                    $2.6B                                                                   $345MM

  Net lease
                                                                                         $1.5B                                                                    $90MM
  assets

  General liquidation                                     Beginning after the 7th anniversary of the closing of the initial              Beginning 5 years after raising the minimum offering
  guideline (1)                                                              public offering in 2015                                                      amount in 2016

(1) Based on general liquidation guidelines set forth in the respective offering documents; ultimately the liquidation of CPA:18 is approved by its independent directors and the liquidation of CESH is
    determined by its general partner.
Investing for the Long Run® | 25
5. COVID-19 Update
1Q21 Rent Payment Status
 WPC collected 98% of rent due in the first quarter
                                     Total Rent Due 1Q21                                                                                                               Property Type
                                                     2%                                                                                                                                                        %          % of 1Q21 rent
                                                                                                                                                                                                       of total ABR       due and paid (1)

                                                                                                                              Industrial                                                                       25%                99%

                                                                                                                              Warehouse                                                                        22%                98%

                                                                                                                              Office                                                                           23%                99%

                                                                                                                              Retail                                                                           18%                97%

                                                                                                                              Fitness, Theater and Restaurants                                                   1%               76%

                                                                                                                              Self Storage (net lease)                                                           5%             100%

                                                                                                                              Other    (2)                                                                       6%             100%

                                                                                                                              Total                                                                          100%                 98%

                                                        98%

                                                                                                                                                                          Geography

                                                                                                                                                                                                                 %        % of 1Q21 rent
                                                                                                                                                                                                           of total ABR   due and paid (1)

                                                                               % of ABR from
                                                                              1Q21 rent due (1)
                                                                                                                              U.S.                                                                              61%                99%

                         Rent Paid                                                    98%                                     Europe                                                                            37%                97%
                         Rent Deferred                                                    —                                   Other    (3)                                                                       2%              100%
                         Rent Not Paid                                                  2%                                    Total                                                                           100%                 98%

Note: ABR presented as of December 31, 2020. Percentages may not add to totals due to rounding.
(1) Reflects payments from tenants with rental payments due from December 20, 2020 to March 19, 2021 expressed as a percentage of ABR. Excludes rent paid in advance of the 1Q21 rent collection period.
(2) Includes net lease lodging assets, education facilities, laboratories and student housing properties.
(3) Includes Canada, Mexico and Japan.
Investing for the Long Run® | 27
Cautionary Statement Concerning Forward-Looking Statements
Certain of the matters discussed in this communication constitute forward-looking statements within the meaning of the Securities Act of 1933 and the
Exchange Act of 1934, both as amended by the Private Securities Litigation Reform Act of 1995. The forward-looking statements include, among other
things, statements regarding the intent, belief or expectations of W. P. Carey and can be identified by the use of words such as “may,” “will,” “should,”
“would,” “assume,” “outlook,” “seek,” “plan,” “believe,” “expect,” “anticipate,” “intend,” “estimate,” “forecast” and other comparable terms. These forward-
looking statements include, but are not limited to, statements regarding the eventual liquidation of our remaining investment management programs.
These statements are based on the current expectations of our management and it is important to note that our actual results could be materially different
from those projected in such forward-looking statements. There are a number of risks and uncertainties, like the risks related to the effects of pandemics and
global outbreaks of contagious diseases (such as the current COVID-19 pandemic), which could have material adverse effects on our future results,
performance or achievements and cause our actual results to differ materially from the forward-looking statements. Discussions of some of these other
important factors and assumptions are contained in W. P. Carey’s filings with the SEC and are available at the SEC’s website at http://www.sec.gov, including
Part I, Item 1A. Risk Factors in W. P. Carey’s Annual Report on Form 10-K for the year ended December 31, 2020. Readers are cautioned not to place undue
reliance on these forward-looking statements, which speak only as of the date of this communication, unless noted otherwise. Except as required under the
federal securities laws and the rules and regulations of the SEC, W. P. Carey does not undertake any obligation to release publicly any revisions to the
forward-looking statements to reflect events or circumstances after the date of this communication or to reflect the occurrence of unanticipated events.
In addition, given the significant uncertainty regarding the duration and severity of the impact of the COVID-19 pandemic, W. P. Carey is unable to predict our
tenants’ continued ability to pay rent. Therefore, information provided regarding historical rent collections should not serve as an indication of expected future
rent collections.
All data presented herein is as of March 31, 2021 unless otherwise noted.
Amounts may not sum to totals due to rounding.
Past performance does not guarantee future results.
Investing for the Long Run® | 28Disclosures The following non-GAAP financial measures are used in this presentation EBITDA and Adjusted EBITDA We believe that EBITDA is a useful supplemental measure to investors and analysts for assessing the performance of our business segments because (i) it removes the impact of our capital structure from our operating results and (ii) it is helpful when comparing our operating performance to that of companies in our industry without regard to such items, which can vary substantially from company to company. Adjusted EBITDA as disclosed represents EBITDA, modified to include other adjustments to GAAP net income for certain non-cash charges, such as impairments, non-cash rent adjustments and unrealized gains and losses from our hedging activity. Additionally, we exclude gains and losses on sale of real estate, which are not considered fundamental attributes of our business plans and do not affect our overall long-term operating performance. We exclude these items from adjusted EBITDA as they are not the primary drivers in our decision-making process. Adjusted EBITDA reflects adjustments for unconsolidated partnerships and jointly owned investments. Our assessment of our operations is focused on long-term sustainability and not on such non-cash and noncore items, which may cause short-term fluctuations in net income but have no impact on cash flows. We believe that adjusted EBITDA is a useful supplemental measure to investors and analysts, although it does not represent net income that is computed in accordance with GAAP. Accordingly, adjusted EBITDA should not be considered as an alternative to net income or as an indicator of our financial performance. EBITDA and adjusted EBITDA as calculated by us may not be comparable to similarly titled measures of other companies. Other Metrics Pro Rata Metrics This presentation contains certain metrics prepared under the pro rata consolidation method. We refer to these metrics as pro rata metrics. We have a number of investments, usually with our affiliates, in which our economic ownership is less than 100%. Under the full consolidation method, we report 100% of the assets, liabilities, revenues and expenses of those investments that are deemed to be under our control or for which we are deemed to be the primary beneficiary, even if our ownership is less than 100%. Also, for all other jointly owned investments, which we do not control, we report our net investment and our net income or loss from that investment. Under the pro rata consolidation method, we present our proportionate share, based on our economic ownership of these jointly owned investments, of the assets, liabilities, revenues and expenses of those investments. Multiplying each of our jointly owned investments’ financial statement line items by our percentage ownership and adding or subtracting those amounts from our totals, as applicable, may not accurately depict the legal and economic implications of holding an ownership interest of less than 100% in our jointly owned investments. ABR ABR represents contractual minimum annualized base rent for our net-leased properties and reflects exchange rates as of December 31, 2020 or March 31, 2021. If there is a rent abatement, we annualize the first monthly contractual base rent following the free rent period. ABR is not applicable to operating properties and is presented on a pro rata basis. Investing for the Long Run® | 29
You can also read