Knoll, Inc. Investor Presentation - February 2021 SVP & CFO - Knoll Inc.

Page created by Ashley Pena
 
CONTINUE READING
Knoll, Inc. Investor Presentation - February 2021 SVP & CFO - Knoll Inc.
Knoll, Inc.
Investor Presentation
February 2021
Andrew Cogan
Chairman & CEO

Charles Rayfield
SVP & CFO

February 10, 2021

Fully
Find Your Work-Flow Campaign

© 2014 Knoll Inc.
Knoll, Inc. Investor Presentation - February 2021 SVP & CFO - Knoll Inc.
FIRST QUARTER 2021 INVESTOR PRESENTATION

Forward-looking Statements/Non-GAAP Measures
This      presentation     includes     forward-looking   those in the forward-looking statements include           company has provided reconciliations below of non-
statements within the meaning of Section 27A of the       corporate spending and service-sector employment,         GAAP financial measures to the most directly
Securities Act of 1933, as amended, and Section           price competition, acceptance of Knoll's new              comparable GAAP measure.
21E of the Securities Exchange Act of 1934, as            products, the pricing and availability of raw materials
amended. All statements regarding Knoll, Inc.'s           and components, foreign currency exchange,                The non-GAAP financial measures presented within
expected future financial position, results of            transportation costs, demand for high quality, well       the Company’s presentation are not indicators of our
operations, revenue and profit levels, cash flows,        designed furniture and interior solutions, changes in     financial performance under GAAP and should not
business strategy, budgets, projected costs, capital      the competitive marketplace, changes in the trends        be considered as an alternative to the applicable
expenditures, products, competitive positions,            in the market for furniture or coverings, the financial   GAAP measure. These non-GAAP measures have
growth opportunities, plans and objectives of             strength and stability of our suppliers, customers and    limitations as analytical tools, and you should not
management for future operations, as well as              dealers, access to capital, our success in designing      consider them in isolation or as a substitute for
statements that include words such as “anticipate,”       and implementing our new enterprise resource              analysis of our results as reported under GAAP. In
“if,” “believe,” “plan,” “goals,” “estimate,” “expect,”   planning system, our ability to successfully integrate    addition, in evaluating these non-GAAP measures,
“intend,” “may,” “could,” “should,” “will,” and other     acquired businesses, our supply chain optimization        you should be aware that in the future we may incur
similar expressions are forward-looking statements.       initiatives, the uncertainty and ultimate economic        expenses similar to the adjustments in this
This includes, without limitation, our statements and     impact of the COVID-19 pandemic (including                presentation. Our presentation of these non-GAAP
expectations regarding any current or future              changes in the way people work), and other risks          measures should not be construed as an inference
recovery in our industry, our plans for reduced           identified in Knoll's annual report on Form 10-K, and     that our future results will be unaffected by unusual
capital and operating expenditures and enhanced           other filings with the Securities and Exchange            or infrequent items.
liquidity measures, our integration of acquired           Commission. Many of these factors are outside of
businesses, our supply chain and manufacturing            Knoll's control.                                          The non-GAAP measures presented are utilized by
footprint optimization plans, our expectations with                                                                 management to evaluate the Company's business
respect to changes in the way companies implement         This presentation      contains certain non-GAAP          performance and profitability by excluding certain
“return to work”, “work from home” and remote work        financial measures. A "non-GAAP financial measure"        items that may not be indicative of our recurring core
strategies, and our expectations with respect to the      is a numerical measure of a company's financial           business operating results. The Company believes
payment of future dividends and leverage. Such            performance that excludes or includes amounts so          that these measures provide additional clarity for
forward-looking statements are inherently uncertain,      as to be different than the most directly comparable      investors by excluding specific expenses in an effort
and readers must recognize that actual results may        measure calculated and presented in accordance            to show comparable business operating results for
differ materially from the expectations of Knoll          with U.S. generally accepted accounting principles        the periods presented.
management. Knoll does not undertake a duty to            ("GAAP") in the statements of income, balance
update such forward-looking statements. Factors           sheets, or statements of cash flow of the company.
that may cause actual results to differ materially from   Pursuant to applicable reporting requirements, the

                                                                                                                                                                         2
Knoll, Inc. Investor Presentation - February 2021 SVP & CFO - Knoll Inc.
KNOLL AT A GLANCE

       Knoll is:
       A constellation of design-driven brands
       and people, working together with our
       clients to create inspired modern
       interiors.

                      1938          1947   1938   1988   2007

               1988          2012   2014   2016   2018
                                                         2019
© Knoll Inc.                                                    3 3
Knoll, Inc. Investor Presentation - February 2021 SVP & CFO - Knoll Inc.
A DIVERSIFIED PRODUCT PORTFOLIO

High-performance workspaces to inspired residences
     Knoll Office                  Fully           KnollStudio   KnollTextiles

    DatesWeiser             Spinneybeck/FilzFelt    Muuto        HOLLY HUNT

                                                                     © 2021 Knoll, Inc.   4
Knoll, Inc. Investor Presentation - February 2021 SVP & CFO - Knoll Inc.
In Q4 2020, Residential and Consumer Sales reached 34%
of total revenue, up from 21% in FY 2019
                                                                                         Q4 2020 TOTAL SALES
                             66%                                                                                 34%

    Architects & Designers                                         Interior Designers &                                    Consumers & Small Business
                                                                     Design Contacts                                            RESIDENTIAL & SMALL PROJECT SIZE
                       LARGE PROJECT SIZE
       Business, Government Education,                                   RESIDENTIAL FOCUS
        Healthcare & Hospitality Clients

  BRICK & MORTAR SHOWROOMS                                                                                                                               E-COMMERCE

        Knoll Workplace, Ancillary                                            HOLLY HUNT
                                                                                                               Knoll Home Design Shops                      fully.com
         Solutions & Coverings                                              13 Showrooms
                      Direct Sales Professionals                       North America & London
                                                                                                                  New York & Los Angeles     d
                                                                                                                                                           knoll.com
                        Contract Dealers
                                                                               Edelman                               Knoll + Muuto                    KnollStudio + Muuto
                                                                              8 Showrooms                          Residential Dealers
                               DatesWeiser
       Knoll Office

                               KnollStudio

                                               Coverings

                                                                                                                        North America
                                  Muuto

                                                 Knoll

                                                                                                                           Europe                     muuto.com (2021+)
                                                                              KnollStudio                                    Asia
                                                                      New York D&D Showroom
                                                                                                                                                         Q4 2020 Sales grow th of
                                                                                                                                                              +239% vs PY

                            (30%)                                                                                34%
                                                                                 Q4 2020 SALES GROWTH/(Decline) VS PY
 Note: For a reconciliation of Workplace and Residential sales, see page 19

                                                                                                                                                                  © 2021 Knoll, Inc.   5
Knoll, Inc. Investor Presentation - February 2021 SVP & CFO - Knoll Inc.
Fluid brands that can easily pivot from the workplace to the
home differentiate Knoll and are a competitive advantage
 Q4 2020 Performance vs. Prior Year
            Knoll, Inc.         (16%) Sales $312.9M | Adjusted EBITDA Margin 9.8%                                                        E-commerce Sales               239%

             Workplace Sales $205.6M                          (30%)                                                     Residential Sales $107.3M                        34%

              Office          (19%)
               Sales                           $185.8M                                             NA Office
               Adjusted                                                                      Europe Office
                                               7.1%
               EBITDA Margin
                                                                                                                              Fully
                                                                                              DatesWeiser

               Lifestyle            (11%)                                                                                 Holly Hunt
               Sales                           $127.1M                                                          NA Studio
                                                                                                                       Europe Studio
               Adjusted
                                               17.8%                                                Textiles
               EBITDA Margin
                                                                                                                 Muuto
                                                                                                Spinneybeck
                                                                                                                                                     Lifestyle      8%
                                                                                                                 Edelman                             Residential

           Note: For a reconciliation of segment and Knoll Inc. Operating Profit and Operating Profit Percentage to Adjusted EBITDA and Adjusted EBITDA Margin, and a          © 2021 Knoll, Inc.   6
           reconciliation of Workplace and Residential sales, see page 19
Knoll, Inc. Investor Presentation - February 2021 SVP & CFO - Knoll Inc.
Our team’s priorities are clear
1. Continue to keep our people safe

2. Accelerate digital transformations and drive growth
   with omnichannel initiatives

3. Position Knoll for return to work in office (WINO),
   while continuing to target work from home (WFH)

4. Continue to manage and reduce costs through
   warehouse consolidation, continuous improvement,
   footprint reduction and supply chain optimization

5. Maximize liquidity and profitability while prioritizing
   digital investments

6. Advance our ESG and diversity and inclusion agenda

                                                             © 2021 Knoll, Inc.   7
Knoll, Inc. Investor Presentation - February 2021 SVP & CFO - Knoll Inc.
We have reset our workplace cost structure and are
leveraging the growth areas of our business entering 2021
Maintain employee and client safety                                          Maximize profitability
    › Implemented additional safety protocols in all Knoll locations             › Wage freezes
    › Developed and leveraging safe working design enhancements to               › Suspension of 401K Contributions in 2020
       safely reopen our offices and showrooms                                   › Restructuring activities
    › Enhanced communication to employees and dealers                                 › Elimination of approximately 600 positions in response to the current
                                                                                          business environment, reducing headcount by almost 20%
Liquidity and Cash Flow
                                                                                       › Expected annualized savings of approximately $40.0M
    › Increased dividend from $0.04 in the 2nd quarter to $0.06 in the 3rd                  › $23M of savings realized in 2020
       and 4th quarters
                                                                                 › Showroom closures in 5 US markets in 2021
    › Reduced Working Capital in Q4 2020
         › Established aggressive inventory reduction targets                Leverage technology
         › Enhanced dealer credit terms                                          › Launched Knoll + Muuto Work-From-Home (WFH) e-commerce offering in July
                                                                                    2020, while enhancing fully.com
         › Managed vendor payables
                                                                                 › Launched updated hollyhunt.com website in September 2020
    › Leveraged CARES Act provisions (Payroll tax deferrals, NOL carry
       backs, Employee Retention Credits and Canada Emergency Wage               › Muuto.com site expected to launch in the second half of 2021
       Subsidy) in 2020                                                          › Keep ONEKnoll ERP on track
    › Raised $164M in preferred stock with Investindustrial
                                                                             Manufacturing and supply chain optimization
                                                                                 › Completed the consolidation of Grand Rapids operations into other North
                                                                                    American plants
                                                                                 › Net elimination of approximately 70 positions
                                                                                 › Remaining US Supply Chain optimization will be completed in 2021
                                                                                                                                             © 2021 Knoll, Inc.   8
Knoll, Inc. Investor Presentation - February 2021 SVP & CFO - Knoll Inc.
And have scaled our cost structure to adjust to the near-
term economic downdraft and turbulence
            Corporate profits Increased in H2 2020                                           CEO Confidence Up Sharply Heading into Q4                               Architectural activity stalled in March and remains
            % Change from Prior Year Quarter                                                                                                                         at historically low levels through December
                                                                                                   70
           20%                                                                                                                                                          60
           15%
                                                                                                   65
                                                                                                                                                                        55
           10%                                                                                     60
                                                                                                                                                                        50
            5%                                                                                     55
                                                                                                                                                                        45
            0%                                                                                     50
                                                                                                                                                                        40
           -5%                                                                                     45
                                                                                                                                                                        35
           -10%                                                                                    40
           -15%                                                                                    35                                                                   30

           -20%                                                                                    30                                                                   25
                  2015      2016     2017      2018     2019       2020                                 2015       2016      2017       2018       2020                      2015    2016      2017      2018      2019      2020
                  Source: Bureau of Economic Analysis as of Q3 2020                        Source: Conference Board as of Q4 2020                                     Source: ABI Index, American Institute of Architects as of
                                                                                                                                                                      December 2020

           Q4 2020 absorption remained negative due to a                                  Service sector payrolls flat in Q4 but remain down                          Corporate CapEx spending rebounding
                                                                                                                                                                      375
           standstill in leasing activity                                                 significantly from Q1 highs                                                  350
                                                                                          Total jobs in millions                                                       325
           Quarterly Net Absorption (sf)                                                                                                                               300
                                                                                               140                                                                     275
                                                                                                                                                                       250
            50                                                                                                                                                         225
                                                                                                                                                                       200
            40                                                                                                                                                         175
                                                                                                                                                                       150
                                                                                               130                                                                     125
            30                                                                                                                                                         100
                                                                                                                                                                        75
            20                                                                                                                                                          50
                                                                                                                                                                        25
            10                                                                                                                                                           0
Millions

                                                                                                                                                                       -25
                                                                                               120                                                                     -50
             0                                                                                                                                                         -75
                                                                                                                                                                      -100
           (10)                                                                                                                                                       -125
                                                                                                                                                                      -150
           (20)                                                                                110                                                                    -175
                                                                                                                                                                      -200
           (30)                                                                                                                                                       -225
                                                                                                                                                                      -250
           (40)                                                                                                                                                       -275
                                                                                                                                                                      -300
                                                                                                                                                                      -325
           (50)                                                                                100
                                                                                                                                                                           2015      2016     2017       2018      2019      2020
                   Q3-16       Q2-17         Q1-18         FY-18          Q4-19   Q4-20           1999                2006             2013                 2020   Source: Board of Governors of the Federal Reserve System (US) as of Q3 2020
                                       Source: JLL as of Q4-2020
                                                                                                        Source: Board of Governors of the Federal Reserve                                                         © 2021 Knoll, Inc.             9
                                                                                                        System (US) as of December 2020.
Knoll, Inc. Investor Presentation - February 2021 SVP & CFO - Knoll Inc.
Why we are optimistic about the future of work

 It is simply too hard to sustain
 collaboration, innovation, acculturation
 and dedication without face-to-face
 interaction. As HBR recently noted “While
 we will likely never go back to our pre-
 crisis status quo, we imagine the future
 will be a blended one that leverages the
 best of what both virtual and face to face
 experiences can offer... we can be
 encouraged that this future is on the
 horizon as newly appointed vaccines start
 to deploy around the world.”
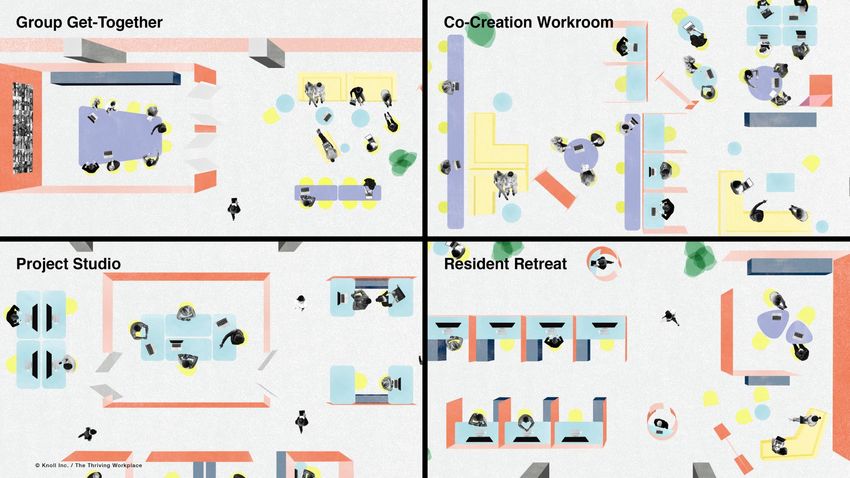
                                                 © 2021 Knoll, Inc.   10
As return to work gathers momentum, we are helping our
clients build Thriving Workplaces

                                                 © 2021 Knoll, Inc.   11
Knoll is well positioned to benefit from future workstyles
that will include a greater mix of WFH options, while still
heavily weighted to the physical office
        Residential                                            E-commerce                                         Commercial
 › Since 1938, Knoll products have                      › Knoll’s Fully e-commerce WFH                     › Historically, all workplace change has
    crossed over between work and home                       business is uniquely positioned to               led to greater demand for office
                                                             benefit and has seen weekly activity             furnishings
 › More time at home will continue to                        continue to pace +100% over PY
    lead to investments in residences as                                                                   › Increased use of screens and high
    furnishings move up the discretionary               › Expanded Knoll WFH e-commerce                       panels; more private offices vs. open
    spending ladder                                          platform (with Muuto) for both                   benches; new layouts to facilitate
                                                             corporate clients and consumers                  social distancing; and more satellite
    HOLLY HUNT, KnollStudio, Muuto and                       launched July 6, 2020                            locations vs. HQ buildings
    Fully will benefit from this trend
                                                        › Muuto.com to launch in 2H 2021                   › Lower rents will free up dollars for
                                                                                                              office improvements

                                                                                                           › Office as a meeting hub with
                                                                                                              increased collaborative spaces and
                                                 Satellite                                      Home          conference rooms

                                                                         Office Hub
                                                                                               Community Spaces
                                            Coworking

                                                                                                                                       © 2021 Knoll, Inc.   12
We have implemented very powerful digital initiatives
this year, including:
Knoll + Muuto at knoll.com
https://www.knoll.com/shop/work-from-home

HOLLYHUNT.com Digital
Reinvention
https://www.hollyhunt.com/

Fully web relaunch and
European expansion
https://www.fully.com/
https://www.fully.com/de-de/

Fully brand campaign resulted
in over 78 million impressions
Find Your Work-Flow Fully (YouTube)

                                                   © 2021 Knoll, Inc.   13
In past downturns, Knoll has weathered the storm and
emerged stronger
               Knoll, Inc. Annual Sales Growth Rates vs BIFMA and US GDP
     25%

     20%

     15%

     10%

      5%

      0%
        1999   2002       2005                2008                  2011               2014   2017      2020

     -5%

     -10%

     -15%

     -20%

     -25%

     -30%

                                 KNL Growth          BIFMA Growth      US GDP Growth
                                                                                                     © 2021 Knoll, Inc.   14
Knoll, Inc. Financial Results

                                                                                         B/(W) vs Prior Quarter                                                 B/(W) vs Prior Year
                                                        Q4              Q4                                                   FY       FY
                                                       2020            2019                 $D            %D                2020     2019                        $D             %D

    Sales                                             $312.9          $371.4              ($58.5)       (15.8% )          $1,236.4 $1,428.1                   ($191.7)       (13.4% )
      Growth %                                         (15.8%)           4.7%                                                (13.4%)          9.7%
    Adjusted Gross Profit                             $111.4          $145.0              ($33.6)       (23.2% )            $444.9          $549.9            ($105.0)       (19.1% )
      Adj. Gross Margin %                               35.6%           39.0%                  (340) bps                     36.0%           38.5%                   (250) bps

    Adjusted Operating Expense                         $94.1          $105.1              ($11.0)       (10.5% )            $365.9          $402.4             ($36.5)        (9.1% )
      % of Sales                                        30.1%           28.3%                  (180) bps                     29.6%           28.2%                   (140) bps
    Adjusted Operating Profit                          $17.3           $39.9              ($22.6)       (56.6% )             $79.0          $147.4             ($68.5)       (46.5% )
      Adj. Operating Margin %                            5.5%           10.7%                  (520) bps                      6.4%           10.3%                   (390) bps

    Adjusted EBITDA                                    $30.6           $51.8              ($21.3)       (41.0% )            $126.7          $194.2             ($67.5)       (34.8% )

      Adj. EBITDA Margin %                               9.8%           14.0%                  (420) bps                     10.2%           13.6%                   (340) bps

    Adjusted Diluted EPS                               $0.14           $0.52              ($0.38)       (73.1% )             $0.95           $1.96             ($1.01)       (51.7% )

    Note: Adjusted Gross Profit Percentage, Adjusted Operating Expenses, Adjusted EBITDA and Adjusted EBITDA Percentage, and Adjusted Diluted EPS are non-GAAP financial measures. For a
    reconciliation of Operating Expenses and Operating Expense Percentage to Adjusted Operating Expenses and Adjusted Operating Expense Percentage, Net Earnings and Net Earnings
    Percentage to Adjusted EBITDA and Adjusted EBITDA Percentage, and Diluted EPS to Adjusted Diluted EPS, see page 20.

                                                                                                                                                                               © 2021 Knoll, Inc.   15
Knoll maintains ample available liquidity and a solid
   balance sheet to support growth and weather uncertainty
                                                                                 Quarterly Bank Debt Leverage Ratio (1)
                                                                                                                                                                                              D E B T   L E V E R AG E   C O V E N AN T    4.0x
                                                                             4
Debt & Liquidity Summary      (as of December 31, 2020)

Total Net Debt Outstanding                                 $288M
                                                                           3.5
Net Debt Leverage Ratio                                     2.28x
Cash & Available Credit (2)                                $334M
                                                                             3
Terms of the Agreement
Facility End Date                                August 2024                                                                                                                                            fully
Maximum Debt Leverage                                       4.00x          2.5
                                                                                                                                                                                                                                     ~2.28x
Minimum Interest Coverage                                   3.00x                                                                                                                                                                    Q4 20

                                                                             2
                                                                                 T AR G E T E D   L E V E R AG E   R AN G E   2.0x-2.5x

                                                                           1.5

                                                                             1

                                                                           0.5

                                                                             0
                                                                                  Q3 13       Q1 14      Q3 14       Q1 15        Q3 15   Q1 16   Q3 16   Q1 17   Q3 17   Q1 18   Q3 18   Q1 19     Q3 19       Q1 20        Q3 20        Q4 20

                                                          (1) Bank Debt Leverage Ratio is calculated by dividing outstanding debt levels by LTM Adjusted EBITDA as defined in our credit facility
                                                          (2) Cash available subject to applicable covenants in our credit facility
                                                          Note: Leverage ratio is as of the last day of each quarter. Q1 2020 net debt leverage ratio was calculated net of all outstanding cash. For
                                                          a reconciliation of Q1 2020 debt leverage ratio to net debt leverage ratio, see page 21. Total net debt outstanding excludes letters of credit
                                                          of $5.0M.                                                                                                                                                      © 2021 Knoll, Inc.       16
Sustainability: Focusing on Communities and Governance
 Embracing relevant issues and being part of the solution

                                                                         “We all have the opportunity to recommit ourselves to the pressing issues of the day, setting the
                                                                         stage for change in the years ahead. Taking the CEO Action for Diversity and Inclusion Pledge
                                                                         aligns fully with the Knoll commitment to help build a fairer and more equitable society. Supporting
                                                                         accessibility and inclusion through design education and affordable housing extends our design-
                                                                         driven mission and shows how we can play a tangible role in making progress toward a fairer world,”

                                                                         – Andrew Cogan, Knoll Chairman and CEO

          SUSTAINABILITY                                                                      COMMUNITY IMPACT                                                                                            CONDUCT & CULTURE

      Environment, Social and              Knoll Diversity Advancement Design                                                       World Monuments Fund/Knoll
                                                                                       Habitat for Humanity Partnership                                                    Knoll Diversity & Inclusion Council          Knoll Board of Directors Diversity
     Governance Commitments                  Scholarships for Black Students                                                              Modernism Prize

Our Sustainability Report is prepared in   The Knoll Diversity Advancement Design       To expand our commitment to good          Knoll is the founding sponsor of the       The Council leverages their unique          We are committed to 30% gender
    accordance with Global Reporting       Scholarships for Black Students will help      design and sustainable building        World Monuments Fund Modernism at          perspectives to tackle issues around         and race diversity on our Board of
Initiative (GRI) Standards—Core Option      develop the next generation of design      practices, Knoll has joined Habitat for      Risk program, which enhances         inclusion, diversity and equity. Its mission                Directors
                                                        professionals                     Humanity as a cause marketing          awareness of the role that Modernism       is to create and maintain a culture of
                                                                                                       partner                       plays in the built environment          acceptance and empowerment and
                                                                                                                                                                           enable equitable learning and working
                                                                                                                                                                                        environments.

                                                                                                                                                                                                                                                              17
                                                                                                                                                                                                                           © 2021 Knoll, Inc.
Thank you for your
                       interest in Knoll

© 2021 Knoll Inc.
RECONCILIATIONS

Reconciliation Of Non-GAAP Results
                                                                                Q4 2020
                                                          Office    Lifestyle     Corporate       Knoll, Inc.
         Operating Profit (loss)                          $ (1.6)    $ 18.2        $      (9.6)   $      7.0
         Add back:
                     Product discontinuation charges           -           -               -              -
                     Restructuring charges                    3.6         0.1             2.7            6.4
                     Asset impairment charge                  1.4          -               -             1.4                                                     Net Sales
                     Depreciation and amortization            6.3         4.3             0.2           10.8
                                                                                                                                                         Q4           Q4         Q4
                     Stock compensation                       2.4         0.2             1.5            4.1
                                                                                                                                                        2020         2019     Growth %
                     Other income (expense) items             1.0        (0.2)            0.1            0.9
         Adjusted EBITDA (loss)                           $ 13.1     $ 22.6        $      (5.1)   $     30.6    Office Workplace                    $ 155.0      $ 220.2        -29.6%
                                                                                                                Office Residential                     30.8          9.0        242.2%
         Net sales                                        $185.8    $ 127.1        $      -        $   312.9
                                                                                                                Office Segment                      $ 185.8      $ 229.2        -19.0%
         Operating profit %                                 -0.9%       14.3%          N/A              2.2%
         Adjusted EBITDA %                                   7.1%       17.8%          N/A              9.8%
                                                                                                                Lifestyle Workplace                 $  50.6      $  71.4         -29.1%
                                                                                                                Lifestyle Residential                  76.5         70.8           8.1%
                                                                            Q4 2019
                                                                                                                Lifestyle Segment                   $ 127.1      $ 142.2         -10.6%
                                                          Office    Lifestyle     Corporate       Knoll, Inc.
         Operating Profit (loss)                          $ 17.4    $    19.0      $      (6.5)   $     29.9    Knoll, Inc Workplace                $ 205.6      $ 291.6         -29.5%
                                                                                                                Knoll, Inc Residential                107.3         79.8          34.5%
         Add back:
                                                                                                                Total Knoll, Inc                    $ 312.9      $ 371.4         -15.8%
                     Product discontinuation charges         0.6           -                -            0.6
                     Restructuring charges                   0.4          0.2               -            0.6     E-Commerce (inc. in Residential)   $     33.4   $      9.9     238.7%
                     Acquisition related inventory adj.      0.3           -                -            0.3
                     Acquisition related expenses             -            -              (0.6)         (0.6)   Workplace vs. Residential %
                     Asset impairment charge                  -           6.5              0.6           7.1    Knoll, Inc Workplace                      66%          79%
                     Depreciation and amortization           6.6          3.7              0.2          10.5
                                                                                                                Knoll, Inc Residential                    34%          21%
                     Stock compensation                      0.6          1.1              1.4           3.1
                                                                                                                Total Knoll, Inc                         100%         100%
                     Other non-cash items                     -           0.4             (0.1)          0.3
         Adjusted EBITDA (loss)                           $ 25.9    $    30.9      $      (5.0)   $     51.8
         Net sales                                        $ 229.2   $ 142.2        $          -   $    371.4
         Operating profit %                                 7.6%        13.3%          N/A              8.1%
         Adjusted EBITDA %                                 11.3%        21.7%          N/A             14.0%

                                                                                                                                                                                  © 2021 Knoll, Inc.   19
RECONCILIATIONS

Reconciliation Of Non-GAAP Results
                                                         Q4 19              FY 19     Q4 20          FY 20

      Gross profit ($mm)                                   144.1           $ 549.0    $ 111.4        $ 442.8

      Add back:                                                                                                                                                       Q4 19           FY 19     Q4 20         FY 20
                                                                                                                              Operating Expenses ($mm)                $114.2          $419.3     104.3         415.1
            Acquisistion related inventory adjustment            0.3            0.3          -            -
                                                                                                                              Less:
            Product discontinuation charges                      0.6            0.6          -            0.7                        Acquisition related amortization    2.5             8.9      2.4            9.5
            Restructuring charges                                               -            -            1.4                        Acquisition related expenses       (0.6)            0.1      -             12.4
                                                                                                                                     Restructuring charges               0.6             0.8      6.4           25.9
      Adjusted gross profit                                145.0           $ 549.9    $ 111.4        $ 444.9
                                                                                                                                     Asset Impairment charges            6.6             6.6      1.4            1.4
      Net sales ($mm)                                      371.4            1,428.1        312.9     1,236.4                         Debt refinancing fees               -               0.5      -              -
      Gross Profit %                                       38.8%             38.4%        35.6%       35.8%                   Adjusted Operating Expenses                  $105.1     $402.4    $94.1        $365.9
      Adjusted gross profit %                              39.0%             38.5%        35.6%       36.0%

                                                       Q4 19               FY 19          Q4 20          FY 20                                                              Q4 19      FY 19    Q4 20         FY 20
       Net Earnings ($mm)                          $     10.3          $     67.5     $      (0.6)   $         7.7    Diluted earnings per share                            $ 0.21     $ 1.36   $ (0.05)      $ 0.09
       Add back:                                                                                                      Add back:
              Income tax expense                          3.7                23.4            2.1              (0.8)           Acquisition related inventory adjustment        0.01       0.01        -            -
              Interest expense                            5.1                21.7            3.6              17.3
                                                                                                                              Product discontinuation charge                  0.01       0.01        -          0.01
              Depreciation and amortization              10.5                38.5           10.8              43.3
                                                                                                                              Acquisition related amortization                0.05       0.18     0.05          0.19
              Stock compensation                          3.1                10.7            4.1              12.9
              Other non-cash items                        0.5                 2.1            0.7               0.5            Acquisition related expenses                   (0.01)        -         -          0.25
              Acquisition related inventory adj.          0.3                 0.2             -                 -             Restructuring charges                           0.01       0.02     0.13          0.55
              Product discontinuation charges             0.6                 0.6             -                0.7            Asset impairment charges                        0.14       0.14     0.03          0.03
              Acquisition related expenses               (0.6)                0.1             -               12.4            Debt refinancing fees                             -        0.01        -            -
              Restructuring charges                       0.6                 0.8            6.4              26.5            Pension settlement charge                       0.21       0.42     0.04          0.10
              Asset Impairment charges                    7.1                 7.1            1.4               1.4                                                                                  -             -
              Debt refinancing fees                        -                  0.5             -                 -     Less:
              Pension settlement charge                  10.6                21.0            2.1               4.8                                                   (1)
                                                                                                                              Tax effect of non-GAAP adjustments              0.11       0.20     0.06          0.27
       Adjusted EBITDA                                   51.8               194.2           30.6          126.7
                                                                                                                      Adjusted Diluted earnings per share                   $ 0.52     $ 1.96   $ 0.14        $ 0.95
       Net Sales ($mm)                             $ 371.4             $ 1,428.1            312.9        1,236.4
       Net Earnings %                                 2.8%                  4.7%           (0.2%)           0.6%
       Adjusted EBITDA %                             14.0%                 13.6%             9.8%          10.2%

                                                                                                                                                                                                         © 2021 Knoll, Inc.   20
RECONCILIATIONS

Reconciliation of Non-GAAP Results
                                                                               Three Months Ended March 31, 2020
                                                                       Debt Leverage    Additional Cash       Net Debt
                                                                           Ratio           on Hand(3)     Leverage Ratio
                        Outstanding Debt Levels ($mm)(1)              $           600.3        $          (115.6)      $            484.7

                        LTM Net Earnings ($mm)(2)                     $             62.4                               $             62.4
                        LTM Adjustments
                          Interest                                                   21.0                                             21.0
                          Taxes                                                      22.4                                             22.4
                          Depreciation and Amortization                              33.8                                             33.8
                          Non-cash Items and Other (5)                               48.5                                             48.5
                                                     (2)
                          LTM Adjusted EBITDA                         $           188.1                                             188.1
                        Debt Leverage Ratio                                           3.2                                               2.6

                  (1)Outstanding debt levels include outstanding letters of credit and guarantee obligations. Per the terms of the credit
                  facility filed with the Securities and Exchange Commission on January 25, 2018, and amended on August 26, 2019,
                  cash up to $15.0M reduces the outstanding debt level. The credit facility was subsequently amended, second
                  amendment, on August 21, 2020, allowing cash up to $30.0M to reduce the outstanding debt level.
                  (2)LTM adjusted EBITDA is calculated in accordance with the Company's credit facility and includes the impact of
                  proforma LTM Net Earnings from the Fully acquisition.

                    Additional cash on hand represents cash at the end of the first quarter in excess of the $15.0 million allowable for
                  (3)

                  deduction from the outstanding debt level per the terms of the Company's credit facility.

                  (5)Non-cash and other items include, but not limited to, product discontinuation charges, acquisition related inventory
                  adjustments, asset impairment charges, restructuring charges, debt refinancing fees, acquisition related expenses,
                  stock-based compensation expenses, and unrealized gains and losses on foreign exchange .

                                                                                                                                              © 2021 Knoll, Inc.   21
You can also read