GLOBAL INVESTMENT HOLDINGS - Financial Presentation Q1 2018 - Global Yatırım Holding
←
→
Page content transcription
If your browser does not render page correctly, please read the page content below
GLOBAL INVESTMENT HOLDINGS

Financial Presentation
Q1 2018

Current Portfolio (Q1 2018)
Brokerage & Asset
Ports Power/Gas/Mining Real Estate Management
Revenue: 78.6mn TL Revenue: 60.1mn TL Revenue: 8.2mn TL Revenue: 12.5mn TL
EBITDA: 43.3mn TL EBITDA: 1.5mn TL EBITDA: 5.3mn TL EBITDA: 1.0mn TL
Net Debt: 228.0mn USD Avg. Maturity: 5.2 yrs Net Debt: 88.0 mnUSD Avg. Maturity: 2.8 yrs Net Debt: 36.8 mn USD Net Debt: 0 mn USD
# of Employees: 647 # of Employees: 482 Avg. Maturity: 3.6yrs Avg. Maturity: n.a.
Ownership: GIH:60.60%, EBRD:5.03%, Free Float:34.37% # of Employees: 81 # of Employees: 138
Ege Ports
Kusadasi (43.9%)
CNG
Mining
Port Akdeniz Power Distribution • Sümerpark Mall Global Securities
Antalya (60.6%) (97.7%) (77.4%)
(94.4%) − GLA 34,600 m2, 2mn USD/year rent
revenue Trading volume:
Co/Tri-generation 14.8bn TL
Bodrum Cruise Port
(93.8%) • Van Mall
(36.4%)
− GLA 26,032 m2 $6Million/year rent
revenue. Operates with 99%
54.3 MW capacity occupancy rate Global MD Portfolio
Port of Adria (39.1%) Management
49 year mining • Denizli SkyCity Office Project Assets Under Management:
Biomass Sales volume: − Construction area: 35,843m2 130mn TL
license
Lisbon Cruise Terminal (100%) 23.7 mn m3
(28.0%) (incl. pipeline • Sümerpark Housing
Total feldspar
gas sales) − Construction area: 105,000m2
17.2 MW sales:
Venice Cruise Port installed capacity 102,643 tons • Vakıfhan No:6
# of CNG Actus Asset Management
(44.48%)* stations: 14 − Lease period: 2019
Export volume: (90.1%)
Assets Under Management:
Valetta Cruise Port
62,425 tons • Salıpazarı Global Building 840mn TL
Solar
(33.7%) (RA:100%,Bar:51%) • Denizli Hospital Land
− Construction area: 10,745 m2
Other Italian Cruise Ports: 14 MW
under development • Denizli Final Schools
• Ravenna (32.5%)
− 10 years lease, Construction area
• Cagliari (42.9%)
of 11,200 m2
• Catania (37.7%) Gas Trading &
Power LNG
Creuers del Port de Wholesale (100%)
Barcelona & Trading Group’s total condolidated
(37.5%) (100%) GLA: c.141k m2
Malaga Cruise Port Retail GLA: c.93.5k m2
(30.1%) Other GLA (office, car park,
commercial): c.47.6k m2
Singapore Cruise Port
* GPH acquired stake in Venie Cruise Port (VTP) as part of a consortium, and the consortium’s
(15.0%)
stake in VTP is 44.48%. The other indirect shareholder of VTP has a put option which can be 2
exercised between May 2017-November 2018. If this put option exercised completely VI (the
(%) GIH’s Effective Ownership consortium) will own 71.51% of VTP.
I – FINANCIAL REVIEW

                       3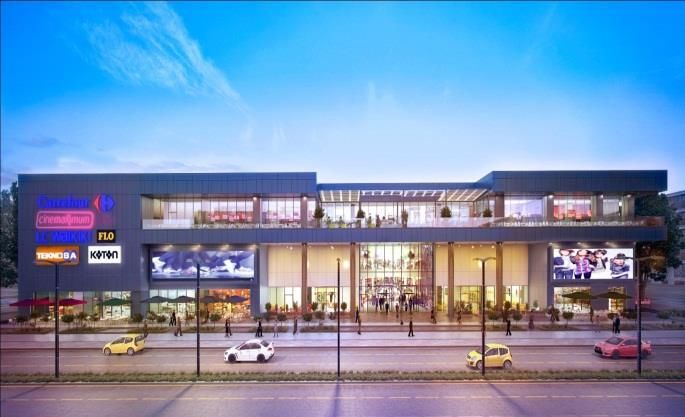
Financial Highlights

 (TL mn)

           Net revenues                                            1Q 2018   1Q 2017   %change
           Gas                                                        29.4    44.4      -34%
           Power                                                      17.8     6.0      200%
           Mining                                                     12.9    12.5       3%
           Ports                                                      78.6    67.3      17%
           Brokerage & Asset Management                               12.5     8.8      42%
           Real Estate*                                               8.2      7.4      11%
           Holding stand-alone                                        0.0      0.0       NA
           Others                                                     0.1      0.1      -17%
           GIH total                                                 159.5   146.5       9%

           Operating EBITDA                                        1Q 2018   1Q 2017   %change
           Gas                                                        0.2      1.2      -81%
           Power                                                      0.2     -0.1       NA
           Mining                                                     1.1      0.5      126%
           Ports                                                      43.3    38.1      14%
           Brokerage & Asset Management                               1.0     -1.3       NA
           Real Estate*                                               5.3      5.7       -6%
           Holding stand-alone                                        -7.2    -8.6      16%
           Others                                                     -3.1    -1.3      -148%
           GIH total                                                  40.7    34.2      19%
                                                                                                 4
           (*) presented under discontinued operations in IFRS financials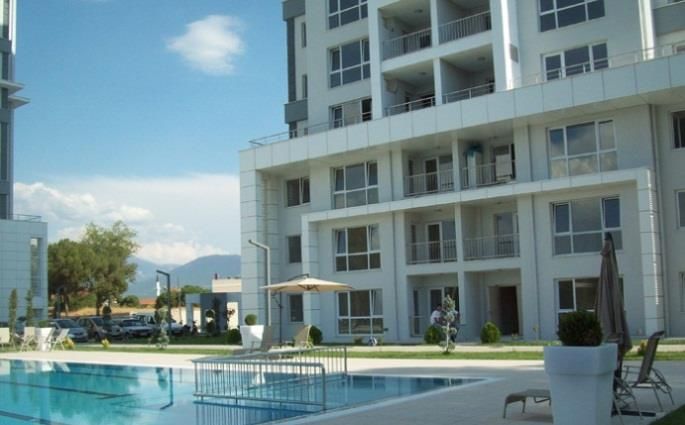
Major Developments
Successful Tender to Operate the Zadar Gazenica Cruise Port in Croatia
PORTS
• GPH Plc won a tender in March 2018, for the operating rights of Zadar cruise port in Croatia for a duration of 20 years. This contract
remains subject to entering into final concession agreement with the Port of Zadar Authority
A €20 million loan agreement with EBRD
• Port of Adria, 63.8% owned subsidiary of Global Ports Holding Plc, signed a loan agreement with EBRD for a total of €20 million to
mostly refinance modernization investment
Share Purchase Agreement (“SPA”) to sell real estate investments
REAL ESTATE
• Global Investment Holdings (“GIH”) has signed a Share Purchase Agreement (“SPA”) to sell GIH’s real estate investments (excluding
the historic headquarters building in Karaköy, İstanbul). Enterprise Value of the real estate portfolio subject to the sale has been
determined as TL298mn.
• The SPA is subject to the Competition Board’s approval and fulfilment of the conditions precedent. The share transfer between GIH and
Okullu Gıda A.S. is expected to be completed until May 31, 2018, following the fulfilment of the conditions precedent.
• The transaction will also help us achieve a healthier balance sheet as it will inject US$44.3mn cash, while decreasing the Group’s gross
debt by US$36.8mn
Signing a term sheet with Canadian Solar
POWER
• GIH has signed a term sheet with NASDAQ listed Canadian Solar, one of the five largest solar panel producers and operators in the
world, to develop and operate a pipeline of solar power projects with total capacity of up to 300 MW.
• GIH is active in renewable energy and energy efficiency investments; currently with a combined capacity of 75.5MW. Such cooperation
with Canadian Solar is a planned step taken towards increasing the clean energy investments of GIH up to 400MW in the next three
years.
The share buyback program
HOLDING
• On March 1, 2018, GlH Board of Directors resolved to a share buyback program up to 150mn TL
• This will bring to shareholders, once completed, a total proceed of TL 234mn
• If/when fully materialized, such share buyback will indicate 0,51 TL per share dividend equivalent to its investors
5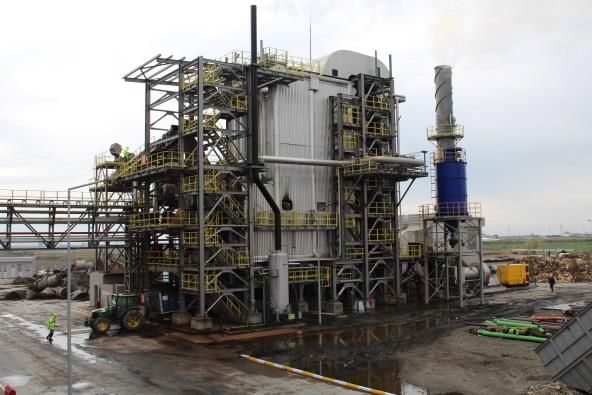
Financial Highlights: Change in Revenue
Revenue (mn TL)
(Q1 2017 vs. Q1 2018)
0.4 0.8 3.7
11.3 -15,1 11.9
159.5
146.5
Gas
Ports
Power
Mining
Estate
Q1 2017
Q1 2018
Brokerage,
Mngmnt.&
Real
Others
Asset
During the first three months of 2018, Global Investment Holdings’ (GIH) revenues reached 159.5mn TL compared to 146.5mn TL for the same
period last year, representing an increase of 9%. The revenue growth was predominantly generated by Power and Ports revenues
Consolidated port revenues reached 78.6mn TL in the first quarter of 2018, up 17% yoy. Revenue growth was attributable to solid growth in
both commercial and cruise businesses. Cruise passenger number growth was strong at 6.3% largely driven by the Spanish ports, which
generate a higher than average yield. On the commercial ports side, revenue growth was mainly driven by higher yielding project cargo
along with good growth in high margin container volume
Power business generated revenues of 17.8mn TL, almost triple the revenues generated in the same period last year, driven by the
commencement of the biomass operations coupled with expansion of installed capacity for co-generation business
The Gas Division reported revenues of 29.4 mn TL in Q1 2018, compared to a 44.4mn TL in Q1 2017. The decrease is mainly attributable to spot
gas trading in Q1 2017 amounting to 14.2 mnTL, and lower gas sales due to seasonality
The Brokerage & Asset Management Division revenues reached 12.5mn TL in the quarter, indicating 42% increase over the same period of
2017, on the back of increase in trading volumes.
6
Financial Highlights: Change in Operating EBITDA
EBITDA (mn TL)
(Q1 2017 vs. Q1 2018)
1.3 -1,8
-1,0 0.6 -0,4 2,3
0,3
5.2
40.7
34.2
Power
Stand Alone
Q1 2017
Real Estate
Gas
Mining
Q1 2018
Ports
Brokerage&
Other
Mngmnt.
Holding
Asset
At the end of Q1 2018, GIH reported operating EBITDA of 40.7mn TL compared to EBITDA of 34.2mn TL a year ago, indicating 19% growth
The Port Division’s operating EBITDA was reported as 43.3mn TL in Q1 2018 compared to 38.1mn TL over the same period in 2017, indicating a
14% YoY growth. EBITDA growth was driven by both commercial and cruise segments. Cruise EBITDA growth was mainly attributable to
the strong contribution from Singapore, an equity pick up port which does not contribute to revenue; as well as the relatively high
yielding Spanish ports, which saw strong y-o-y passenger growth in the period. Likewise, the higher yielding project cargo effect,
increase in high-margin TEU business, operational improvements, and a favorable currency environment in Turkey resulted in EBITDA
improvement for Commercial division
GIH’s Gas division operating EBITDA was 0.2mnTL compared to 1.2mnTL in the same period last year, mainly on the back of lower contribution
from spot gas trading (non-core activity as a result of take or pay arrangements in Q1 2017), one-off restructuring costs in Q1 2018 as a result of
operational cost reductions and seasonality inherent to the business.
Power division EBITDA includes co-generation and newly commenced bio-mass renewable power production. Although EBITDA is already on
positive domain in Q1 2018, generation for bio-mass plants are lower than their full potential because of customary ramp-up period needed during
commissioning stage. Full capacity is expected starting from Q2.
The Brokerage and Asset Management Division reported an operating EBITDA of 1.0mn TL for the quarter, compared to an EBITDA of -1.3mn TL
in the same period of last year. The normalization in EBITDA can be attributed to the increase in trading volumes, as well as synergies
achieved following the merger with Eczacıbaşı Securities, resulting in cost reductions.
Holding company, as the cost center, reported -7.2mn TL operating EBITDA in the quarter compared to -8.6mn TL in Q1 2017 7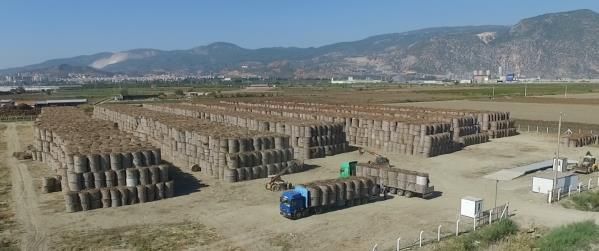
Financial Highlights: Operational EBITDA by Division

                                 Operational EBITDA By Divison
                                            (mn TL)

                49.6

         42.1

                                           1.2                          1.1
                              1.0                                                          1.0
                                                                  0.5
                                                  0.2

                       -0.1

                                                                                    -1.3

           Ports         Power                CNG                  Mining     Brokerage & Asset Mng.

                                        Q1 2017         Q1 2018
                                                                                                       8
Financial Highlights: Change in P&L & Debt Position
• GIH reported a consolidated net loss of TL56.6mn in Q1 2018, compared to a net loss of TL56.8mn in Q1 2017. Despite higher revenue
recognition along with EBITDA maximization, the net loss stemmed from non-cash depreciation and foreign currency translation differences
incurred on Group’s long term borrowings
• Depreciation and amortization charges have increased from 48.5mn TL in Q1 2017 to 59.4mn TL in Q1 2018. Also, the Group has incurred
16.7mn TL net foreign exchange losses, compared to 12.1mn TL in the same period last year
• Net interest expenses in Q1 2018 were 33.6mn TL, significantly lower compared to Q1 2017 (42.1mn TL), despite the weakness in TL against
hard currencies. This is a result of improvement in Group’s net indebtedness, following the IPO of the Ports Business and subscription by
Centricus in Q2 2017
• Consolidated Net Debt has decreased from 2,104.9mn TL at Q1 2017 to 1,564.1mn TL in Q1 2018. Likewise, holding stand-alone Net Debt
position of 574.1mn TL decreased to 171.0mn TL, which further contributed to the decrease in consolidated interest expenses going forward.
Net Profit(Loss) Breakdown in Q1 2018 – mn TL
40.7 -59,4
-6,8
-16,7
-33,6 -56.6
19,2
Q1 EBITDA depreciation One-off's & fx gain/ (loss), net interest, net tax & minorities Q1 Net PL
others
(Q1 2017 vs Q1 2018 ) Change in Net Debt Position – mn TL
2,105
1,531 1,393 1,564
Q1 2017
574 Q1 2018
171
Holding Solo Operating Business Segments Total Consolidated 9II – OPERATIONAL PERFORMANCE BY DIVISION
Global Ports Holding Plc
GPH Total Revenues
Cruise EBITDA Margin* & During the period cruise passenger volumes rose 6.3% compared to Q1
&
Commercial EBITDA Margin* 2017
Consolidated EBITDA (TL)
o This yoy growth in passenger volumes was primarily driven by
71.1% 69.6% growth in the number of calls at our Spanish ports
78.6
67.3 Our commercial ports reported good growth in container volumes which
43.7% were up 4.7% yoy, while general & bulk cargo volumes, were down (0.9%)
43.3 36.2% yoy
17% 38.1
The Port Division’s revenues totaled 78.6mn TL in Q1 2018, representing
14% an increase of 17% over the same period.
o This growth is attributable to both strong commercial and cruise
Revenue Consolidated Cruise Margin Commercial Margin businesses.
EBITDA Q1 2017 Q1 2018 o GPH revenues - which are mainly denominated in USD and EUR –
Q1 2017 Q1 2018 * Based on revenues allocated to cruise segment (excl. further benefited from the depreciation of TL in value against those
Singapore, Lisbon and Venice) and commercial
segment, and EBITDA of only operational companies currencies during the period
(excluding GPH solo expenses)
The division’s consolidated EBITDA was 43.3mn TL in the quarter a 14%
Commercial Volume yoy increase, delivering a 55.1% consolidated EBITDA margin for the
Cruise Passengers* (‘000 PAX)
(‘000 TONS & TEU)
period
o GPH managed to expand EBITDA creation via its both commercial
485.2 480.7
and cruise operations.
48.8 51.1 o Cruise EBITDA grew as a result of the strong contribution from
Singapore, an equity pick up port which does not contribute to
314.8 334.6
revenue, as well as contribution from the relatively higher yielding
Spanish ports, which saw strong yoy passenger growth in the
period
o The increase in high-margin TEU business, operational
improvement, the higher yielding project cargo and a favorable
Q1 2017 Q1 2018 Cargo TEU currency environment in Turkey resulted in the improvement for
* Passenger numbers refer to consolidation perimeter,
hence excluding equity pick-up entities Venice, Lisbon Q1 2017 Q1 2018 Commercial division
and Singapore
11Power/Gas/Mining: Naturelgaz
Naturelgaz
Revenue & Volume Reported sales volume of Q1 2018 stood at 23.7mn m3 (including
pipeline gas sales of 6.8 mn m3), compared to 41.5 mn m3 (including
pipeline gas sales of 18.8 mn m3) in Q1 2017
Naturelgaz recorded revenues of 29.4 mn TL in Q1 2018 (including
30.2 pipeline gas sales of 5.6 mn TL for gas balancing) as opposed to 44.4
mn TL in Q1 2017 (including pipeline gas sales of 14.2mn TL for gas
23.8 balancing) due to lower sales, which is in line with 2018 budget.
22.7
Gross profit margin increased from 23% in Q1 2017 to 27% in Q1 2018
16.9 as a result of expiry of the 2 year contract for gas hedging coupled with
improvement in logistics cost. Yet, on the other hand, this not reflected
on EBITDA due to lower contribution from spot gas trading YoY, and
one-off payments associated with workforce restructuring.
Adapazarı CNG plant started operations and total number of CNG
distribution plants as of 31 March 2018 is 14
Revenue (TL mn) Volume (mn m3)
Q1 2017 Q1 2018 Naturelgaz has won the Çaykur Tea Plants CNG Tender. Naturelgaz will
supply 30.5 mn sm3 CNG to Çaykur’s Tea Plants between May-18 and
Dec-18
Naturelgaz has started to supply CNG to Bergama and Kınık in İzmir,
Palu and Kovancılar in Elazığ and Gördes in Manisa as a part of
CityGas project. These were the first winter citygas sales in Naturelgaz
history
12Power Division:
Co-Gen and Biomass
The Power division reported 17.8mn TL revenues in Q1 2018, almost tripling
YoY thanks to the first time consolidation of biomass operations with 17.2MW
installed capacity with feed-in tariff coupled with expansion in installed capacity
for co-generation business
Generation for bio-mass plants are lower than their full potential because of customary
ramp-up period needed during commissioning stage. Full capacity is expected starting
from Q2.
As of Q1 2018, the total contracted generation capacity of Tres Energy is 54.3MW. Of
the total contracted generated capacity, 50MW is already operational and supplies
power to consumers. Tres Energy plans to complete the construction and commence
generation of the remaining in Q2 2018. Tres Energy plans to finalize additional
contracts with a number of industrial and commercial consumers in the near future,
and grow its co-generation capacity throughout the country
In Q4 2017, Global Investment Holdings commenced power generation from biomass
resources in its Aydin and Şanlıurfa power plants with a 17.2 MW total installed
capacity where the company has the first mover advantage and these two biomass
power plants will be subject to Renewable Energy Resources Support Mechanism
(YEKDEM), selling electricity at a subsidized 13.3 dollar-cent/kWh level.
Global Investment Holdings aims to continue acting as an industry pioneer,
spearheading the development of biomass projects in various locations across
Turkey to achieve a substantial installed capacity, reaching 125MW by 2020.
13Power Division:
Solar
GIH’s goal is to become a market pioneer in solar power development in Turkey. To reach this goal, GIH’s subsidiary, Ra Solar, has identified
several suitable project locations for solar power generation in Turkey and conducted the mandatory studies to obtain a generation license
As part of the project development initiatives, the company has also concluded the measurement processes at some of its respective project
sites and submitted applications for pre-qualification as required by the tender process to obtain a license. In January 2015, at the tender held
by the Turkish Electricity Transmission Company (TEİAŞ) Ra Solar won the right to build a 9 MW solar plant in Mardin, southeast Turkey. Ra
Solar targets to commence construction at the Mardin project upon completion of necessary permission processes
Furthermore, Ra Solar plans to commission additional projects in accordance with licensed as well as unlicensed market regulations and
reach a substantial generation capacity within the next few years
GIH is also pursuing plans to bid on large scale government tenders, as may be announced in the near future
Barsolar, a company established in Montenegro, is the first solar energy investment of the Group abroad as well as the first ever solar
project in Montenegro with a capacity of 5 MW. The company targets to commence its operations in 2018 through rooftop solar instalments
on the warehouse at the Port of Bar
Global Investment Holdings (“GIH”) has signed a term sheet with NASDAQ listed Canadian Solar, one of the five largest solar panel
producers and operators in the world, to develop and operate a pipeline of solar power projects with total capacity of up to 300 MW.
Global Investment Holdings is active in renewable energy and energy efficiency investments; currently with a combined capacity of
75.5MW. Cooperation with Canadian Solar is a planned step taken towards increasing the clean energy investments up to 400MW
in the next three years
14Mining: Straton Mining
The Company realized 102,643 tons of product sales, indicating a 22% YoY volume reduction in 2017
The Company exported 62,425 tons feldspar mainly to Spain, Italy, Egypt and Middle East while domestic sales volume reached 40,218 tons
Straton continued sales of high-quality products with growing volumes and realized 40,113 tons of processed material from its facilities, with
a 360% increase over the same period last year
The Mining Division reported revenues of 12.9mn TL, indicating 3% increase, while operating EBITDA was more than doubled at
TL1.1mn. Strong operating performance despite of volume reduction in 2018, on the back of the increase in sales volume of high-
quality products over previous year
Straton Straton
Revenue (TL mn) Volume (tons)
132,358
12.5 12.9
102,643
Q1 2017 Q1 2018 Q1 2017 Q1 2018
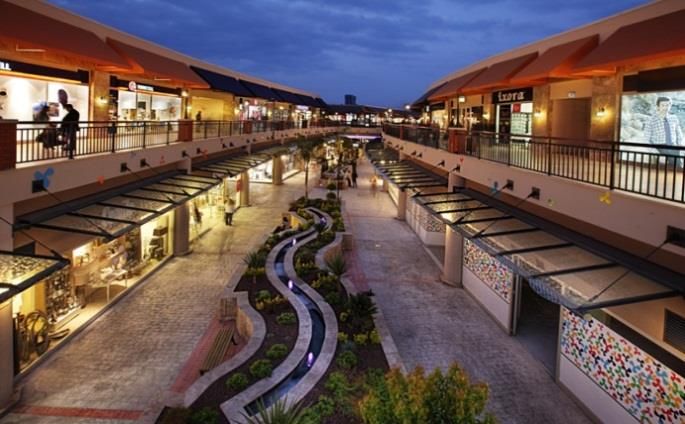
15Real Estate Division: Overview
In Q1 2018, revenues of the Real Estate Division were comprised of rent revenues and
residential/commercial sale revenues. Rental revenues were generated from the Denizli
Sumerpark Shopping Mall, which started its operations in March 2011 and Van Shopping Mall,
which commenced its operations in December 2015.
Real Estate Division revenues were up 11%, reaching 8.2mn TL in Q1 2018, while
operating EBITDA stood at 5.3mn TL, compared to 5.7mn in Q1 2017.
• Global Investment Holdings (“GIH”) has signed a Share Purchase Agreement (“SPA”) to sell
GIH’s real estate investments (excluding the historic headquarters building in Karaköy,
İstanbul). Enterprise Value of the real estate portfolio subject to the sale has been determined
as TL298mn.
• The SPA is subject to the Competition Board’s approval and fulfilment of the conditions
precedent. The share transfer between GIH and Okullu Gıda A.S. is expected to be
completed until May 31, 2018, following the fulfilment of the conditions precedent.
• The transaction will also help us achieve a healthier balance sheet as it will inject
US$44.3mn cash, while decreasing the Group’s gross debt by US$36.8mn
16Brokerage & Asset Management Segment
Revenues of the Brokerage and Asset Management Division consists of securities brokerage commissions, interest revenues on margin
lending transactions, portfolio management fees, proprietary trading revenues and advisory fees
The Brokerage & Asset Management Division reported revenues of 12.5mn TL in Q1 2018, indicating 42% yoy increase, and a
positive operating EBITDA of 1.0mn TL, compared to -1.3mn TL in Q1 2017. The normalization in EBITDA can be attributed to
increase in trading volumes, as well as synergies achieved following the merger with Eczacıbaşı Securities, resulting in cost
reductions.
Global Securities has increased its total equity by 18% to 44.5mn TL as of 31 March 2018 thanks to the increase in trading volumes
Global MD Portfolio Management is the sole non-bank company with a mandate to manage pension fund, namely that of Aegon
Emeklilik. Global MD Portfolio offers top-quality portfolio management services to both individual and institutional investors,
managing 7 funds invested in the Turkish equity and debt market. As of 31 December 2017, Global MD Portfolio manages a total of
130mn TL in AUM
By acquiring 90.1% of its shares on April 21, 2015, Global Investment Holdings maintains its asset management operations with Actus Asset
Management Company
o 9.9% shares of Actus Company is owned by the Police Care and Assistance Funds, which has more than 50,000 partners and
sizeable assets of TL 1.3 billion
o Since April 2015, Actus Company has grown by 441%, managing 840mn TL in AUM as of 31 March 2018
o Actus also launched Turkey’s first infrastructure private equity fund that will provide equity financing to a public-private partnership
project in healthcare sector. Actus aims to be the leader in Turkey in alternative investment funds leveraging Global Investment
Holdings’ know-how and proven track record
o Managing 4 pension, 6 mutual, and 2 alternative investment funds as well as several discretionary mandates, Actus is the only full
fledged asset manager in Turkey
17III – APPENDIX
Balance Sheet
(TL Million) 31 Mar 2018 31 Dec 2017
Current Assets 1,306.6 940.6
Cash and Banks 373.5 439.9
Marketable Securities 4.2 5.5
Trade Receivables 192.4 195.3
Inventories 45.3 98.3
Other Receivables and Current Assets (1) 691.2 200.8
Assets classified as held for sale 491.3 0.9
Non-current Assets 3,209.0 3,430.5
Financial Assets 5.4 5.4
Investment Properties 0.0 379.7
Tangible Fixed Assets 977.5 930.2
Intangibles and Concession properties 1,873.2 1,799.1
Equity Pickup Investments 102.2 93.2
Goodwill 69.4 72.0
Deferred tax assets 97.9 92.3
Other receivables and non-current assets (2) 83.40 58.5
TOTAL ASSETS 4,515.6 4,371.0
LIABILITIES
Short term liabilities 921.3 729.5
Financial debt 497.4 451.0
Trade Payables 163.2 172.8
Accrued liabilities and other payables 76.3 105.7
Liabilities directly associated with assets held for sale 184.5 0.0
Long term liabilities 1,998.3 2,046.7
Financial debt 1,465.9 1,537.0
Provisions and other long term liabilities (3) 118.6 107.8
Deferred tax liabilities 413.8 401.9
Total Shareholders' Equity 1,596.0 1,594.8
Paid in capital 325.9 325.9
Treasury shares -50.6 -41.0
Reserves 685.8 547.8
Previous years' profit/loss 144.4 483.1
Profit/(loss) for the period -56.6 -329.2
Minority Interest 547.1 608.1
TOTAL LIABILITIES AND SHAREHOLDERS' EQUITY 4,515.6 4,371.0
19
(1) held for sale assets, non-trade receivables including related parties, tax receivables and others (2) long term non-trade receivables including related parties, advances, prepaid expenses
and others (3) non-trade payables including related parties, long term provisions and other liabilitiesIncome Statement
(TL mn) Q1 2018 Q1 2017
Total gross revenues 151.3 139.1
Cost of sales and services -131.6 -116.9
Gross Profit 19.7 22.2
Operating expenses -52.3 -45.0
Other operating income/(loss), net -1.9 -1.8
Equity pickup asset gains/(losses) 3.7 1.5
Gross operating profit/(loss) -30.7 -23.1
Financial income/(expenses), net -53.8 -56.9
Profit/(loss) before tax -84.5 -80.0
Taxation 6.9 10.0
Profit/(loss) after tax -77.6 -69.9
Net profit/(loss) from discontinued operations 2.2 4.0
Minority interest -18.8 9.2
Net profit/(loss) for the period -56.6 -56.8
20
EBITDA 40.7 34.2Debt Position
As of 31.03.2018 Pro-forma2
Interest Year of Amount TL US$ Amount TL US$
Holding standalone debt (TL m) Currency Rate Maturity mn mn mn mn
Eurobond, net USD fixed 2022 12.8 3.2 12.8 3.2
TL bond TL floating 2019 14.8 3.7 14.8 3.7
TL bond TL floating 2020 25.0 6.3 25.0 6.3
TL bond TL floating 2018 50.0 12.7 50.0 12.7
TL bond TL floating 2019 50.0 12.7 50.0 12.7
Secured bank loans EUR floating 20191 123.8 31.4 123.8 31.4
Gross debt 276.4 70.0 276.4 70.0
Cash and Cash Equivalents 105.4 26.7 280.3 71.0
(I) - Net Financial Debt (TL m)
standalone 171.0 43.3 -3.9 -1.0
Project Company debt by segment Amount TL US$ Amount TL US$
(TL m) 2018 2019 2020 2021 2022+ mn mn mn mn
Ports 71.2 64.2 59.4 1,022.6 90.3 1,307.8 331.2 1,307.8 331.2
CNG/Power/Mining 105.3 56.9 53.9 50.5 80.9 347.4 88.0 347.4 88.0
Real Estate 26.9 21.2 20.9 20.1 56.3 145.5 36.8 - -
Gross debt 203.4 142.4 134.2 1,093.2 227.5 1,800.7 456.0 1,655.2 419.2
Cash and Cash Equivalents 407.7 103.2 407.7 103.2
(II) - Net Financial Debt (TL m) -
project company (TL m) 1,393.0 352.8 1,247.5 316.0
(I) + (II) - Consolidated Net Debt (TL m) 1,564.1 396.1 1,243.6 315.0
1 Dedicated loan facility. Balances paid can be redrawn. 2GIH has signed a Share Purchase Agreement to sell its real estate investments. The transaction will lead to a healthier balance
21
sheet as it will inject US$44.3mn cash, while decreasing the Group’s gross debt by US$36.8mn based on Q1 2018 financials, thus improving the leverage positionDisclaimer The information contained in this document has not been independently verified. No representation or warranty, express or implied, is made as to, and no reliance should be placed on, the fairness, accuracy, completeness or correctness of the information or opinions contained in this document. This document may also contain certain forward-looking statements concerning the future performance of Global Investment Holdings (GIH or the Group) and should be considered as good faith estimates. These forward-looking statements reflect management expectations and are based upon current data. Actual results are subject to future events and uncertainties, which could materially impact GIH’s actual performance. GIH, and its respective affiliates, advisors or representatives, shall have no liability whatsoever for any loss howsoever arising from any use of this document or its contents or otherwise arising in connection with this document. GIH undertakes no obligation to update any forward-looking statements, whether as a result of new information, future events or otherwise. Therefore you should not place undue reliance upon such statements. For further information, please contact: Investor Relations Global Yatırım Holding A.Ş. Rıhtım Caddesi No. 51 Karakoy 34425 Istanbul, Turkey Google Maps: 41.024305,28.979579 Phone: +90 212 244 60 00 Email: investor@global.com.tr Website: www.globalyatirim.com.tr facebook.com/GLYHOIR twitter.com/GLYHOIR
You can also read