BIS Bulletin No 40 - Bank for International Settlements
←
→
Page content transcription
If your browser does not render page correctly, please read the page content below
BIS Bulletin
                                               No 40

Liquidity to solvency: transition
cancelled or postponed?
Ryan Banerjee, Joseph Noss and Jose Maria Vidal Pastor

25 March 2021
BIS Bulletins are written by staff members of the Bank for International Settlements, and from time to time
by other economists, and are published by the Bank. The papers are on subjects of topical interest and are
technical in character. The views expressed in them are those of their authors and not necessarily the views
of the BIS or the FSB. The authors are grateful to Fernando Avalos, Claudio Borio, Stijn Claessens, Bryan
Hardy, Cathérine Koch, Patrick McGuire and Nikola Tarashev for helpful comments, Naomi Smith for
editing, and to Louisa Wagner for administrative support.
The editor of the BIS Bulletin series is Hyun Song Shin.

This publication is available on the BIS website (www.bis.org).

©   Bank for International Settlements 2021. All rights reserved. Brief excerpts may be reproduced or
    translated provided the source is stated.

ISSN: 2708-0420 (online)
ISBN: 978-92-9197-463-3 (online)
Ryan Banerjee                        Joseph Noss              Jose Maria Vidal Pastor
                  ryan.banerjee@bis.org                joseph.noss@fsb.org         josemaria.vidalpastor@bis.org

Liquidity to solvency: transition cancelled or postponed?

Key takeaways
•     Since the start of the Covid-19 pandemic, a “bankruptcy gap” has emerged between measures
      of expected and realised bankruptcies globally.
•     The ample supply of credit to make up for short-term losses has been an important factor
      decoupling bankruptcies from the sharp reduction in firms’ cash flows.
•     Firms’ reliance on credit suggests that it may be too early to dismiss future solvency risk.
      Significant increases in leverage and weak earnings forecasts in some sectors suggest that for
      some firms, greater credit extension may have only postponed, rather than cancelled, their
      insolvency.

Not too long ago it was conventional wisdom that the global economy would transition from the “liquidity
phase” to the “solvency phase” of the Covid-19 economic crisis. A large wave of insolvencies was expected.
So far, however, insolvencies have remained very low, and even fell in many jurisdictions during 2020
(Banerjee, Cornelli and Zakrajšek (2020), IMF (2021)). As a result, a gap has opened between previously
reliable predictors of bankruptcy rates based on economic activity and actual realised bankruptcies. We
refer to this phenomenon as the “Covid-19 bankruptcy gap”.
     This bulletin aims to shed light on the drivers of this bankruptcy gap and identifies two important
determinants. First, the impact of the pandemic has been highly asymmetric. Although it has hit consumer-
facing sectors exceptionally hard, other sectors less affected by the pandemic (and its associated
containment measures) experienced a strong recovery in Q3 2020. Moreover, the ability to recoup missed
revenues has alleviated insolvency stresses, particularly in the durable goods sector. That said, this falls
short of a satisfactory explanation of why bankruptcies have been so low, even falling in some economies.
    The second and, arguably, more important factor suppressing bankruptcies has been the ample
supply of credit, facilitated by unprecedented monetary and fiscal support. This has been pivotal in
preventing insolvencies, because it is ultimately insufficient cash flows that give rise to bankruptcies
(Banerjee and Kharroubi (2020)). After all, firms go bust when they cannot pay their bills. Ample credit
during 2020 stands in sharp contrast to the Great Financial Crisis (GFC) when credit conditions were
exceptionally tight.
     Whilst the increase in credit has prevented business firms’ insolvency in the short term, it has also
increased their indebtedness. In an optimistic scenario, with the global vaccine roll-out being successful,
business models of the vast majority of firms in the hardest hit sectors will continue to be fundamentally
sound and cash flows will recover to pre-Covid-19 levels. The risk of a significant rise in “zombification”
will be low under this scenario. However, firms’ indebtedness will be higher, and this might result in
changes of firm ownership from equity holders to creditors.
     Perhaps the more worrying scenario is the combination of higher debt levels and depressed earnings
for credit dependent firms in some sectors, as suggested by consensus forecast estimates for 2021. Under
this scenario, firms in the airline, hotels, restaurants and leisure sectors would remain highly dependent

BIS Bulletin                                                                                                  1
on additional support to avoid insolvency. These risks could be compounded if vaccines are less successful
in containing the spread of Covid-19. Prolonged weakness in these sectors could in turn spill over into the
more leveraged commercial real-estate sector.
     The uncertain outlook for firms’ cash flow and the role of credit in containing bankruptcies to date
shines a spotlight on banks’ loss-absorbing buffers and provisioning strategies, as well as on
accommodative financial conditions and government guarantees that have sustained credit to struggling
firms.

Bankruptcy gap

Despite the unprecedented shock to the global economy, corporate insolvencies remain exceptionally low
and have even fallen in many jurisdictions over 2020 (Banerjee, Cornelli and Zakrajšek (2020), IMF (2021)).
A sharp divergence has emerged between predicted measures of bankruptcies based on economic activity
and the level of realised bankruptcies globally (the Covid-19 bankruptcy gap). This gap is illustrated by the
left-hand panel of Graph 1, which shows that bankruptcies (blue line) tend to increase when
unemployment (red line) is high and when GDP growth is weak (yellow line) – as was the case during the
GFC. This stands in sharp contrast to 2020, when bankruptcies declined as unemployment spiked and GDP
growth collapsed.

A bankruptcy gap has opened up as sectors have been hit asymmetrically by the
Covid-19 shock                                                                                                                          Graph 1

Unemployment, GDP and corporate                  Operating profits during GFC2                     Operating profits during Covid-192
bankruptcies1
               Standard deviations from mean                As a share of total assets, per cent              As a share of total assets, per cent

                                           1.2                                                4                                                 4

                                           0.6                                                2                                                 2

                                           0.0                                                0                                                 0

                                          –0.6                                               –2                                                –2

                                          –1.2                                               –4                                                –4

                                          –1.8                                               –6                                                –6
    02    05   08   11   14    17    20             Q4 07 Q2 08 Q4 08 Q2 09 Q4 09                      Q3 19 Q4 19 Q1 20 Q2 20 Q3 20
         Bankruptcies          GDP                       Average            Median                         25th-75th percentile        Min-max
         Unemployment                                                                                      10th-90th percentile        range
1
  The mean and standard deviations are calculated over the period 2000–2019 on an individual country basis. The graph shows the average
of the standard deviations from the mean across countries, where data are available. 2 The shaded areas and lines show moments of asset
weighted operating profits by sector based on public and large private companies in all non-financial sectors in AU, CA, DE, ES, FR, GB, IT, JP
and US.

Sources: BIS; IMF; Datastream; national statistical agencies; S&P Capital IQ; authors’ calculations.

Exposure to the pandemic shock and pre-existing vulnerabilities

One potential driver of this gap is the highly asymmetric exposure to the shock across sectors. Indeed, the
divergence in operating profitability across sectors since the start of the pandemic in early 2020 (Graph 1,
right-hand panel) is considerably greater than that during the 2008–09 financial crisis (centre panel).
Furthermore, the strong recovery in Q3 2020 is likely to have alleviated insolvency stress in some sectors.

2                                                                                                                                     BIS Bulletin
Exposure to Covid-19 shock and existing vulnerabilities concentrated in a few sectors                                               Table 1

                                  Exposure to Covid-19 shock                         Liquidity risk                   Balance-sheet risk

                                   Revenue                                 Liquidity3             Credit lines4              Debt5
                                                   Recoupability2
                                   change1                             Level6     Change7       Level     Change       Level      Change
              Sectors
Airlines
Hotels, restaurants and leisure
Real estate
Construction
Energy
Entertainment
Textiles, apparel and luxury
goods
Consumer discretionary
Metals and mining
Aerospace and defence
Utilities
Industrials
Consumer staples
Diversified consumer services
Materials
Commercial services and
supplies
Technology
Machinery
Healthcare
Red/white/blue cells indicate sectors in which exposure to Covid-19 shock /vulnerabilities of non-financial firms risks are large/medium/low.
The ranking is relative to each column. Each indicator is scaled from 0 to 100 to make the indicators comparable. Cash-flow and balance-
sheet risk indicators are based on G20 countries and Spain. The ratios represent the median value across all the firms within each sector.
1
  Purchase Managers Index, average March-September 2020. 2 MSCI Sectoral equity indices. Percentage change as of end-September
2020 compared with end-2019. 3 Ratio of cash to debt service. 4 Ratio of undrawn credit to debt service. 5 EBITDA to debt ratio. 6 At
end-2019. 7 Percentage change as of Q3 2020 compared with end-2019.

Sources: Bloomberg; IHS Markit; Datastream; S&P Capital IQ; authors’ calculations

     The highly asymmetric nature of the Covid-19 shock as well as pre-existing vulnerabilities across
sectors is clearly evident across the range of indicators presented in Table 1. The heat map shows that
although consumer-facing firms have been hit exceptionally hard, the impact on firms in other sectors has
been relatively more muted (revenue change column).
     Sectors suffering smaller initial revenue reductions also benefitted from having more recoupable
earnings (ie when sales are merely postponed rather than cancelled), further easing insolvency pressures
(Table 1, recoupability column). Indeed, equity markets priced in lower insolvency risks in the consumer
durable sector even though firms in this sector experienced a strong initial hit to revenues. Insolvency risk
has also been mitigated by generally higher levels of liquidity and lower leverage in sectors less exposed
to the pandemic shock (liquidity and balance-sheet risk columns). Instead, sectors harder hit by the
Covid-19 crisis were less indebted (Mojon, Rees and Schmieder (2021)), while so far, the more leveraged
real estate and construction sectors have been less exposed to revenue reductions.
     However, these explanations alone are insufficient to explain why bankruptcies have fallen in many
economies. As the centre and right-hand panels of Graph 1 show, the initial Covid-19 shock was at least
as large as the initial GFC shock. To answer this puzzle, we turn to the dynamics of credit.

BIS Bulletin                                                                                                                                3
Ample credit to struggling firms
Ample credit has plugged the cash-flow gap for many firms. This appears to be an important determinant
of the bankruptcy gap: after all, firms ultimately go bust when they cannot pay their bills (Banerjee and
Kharroubi (2020)). Ample credit to loss-making firms over the past year stands in sharp contrast to tight
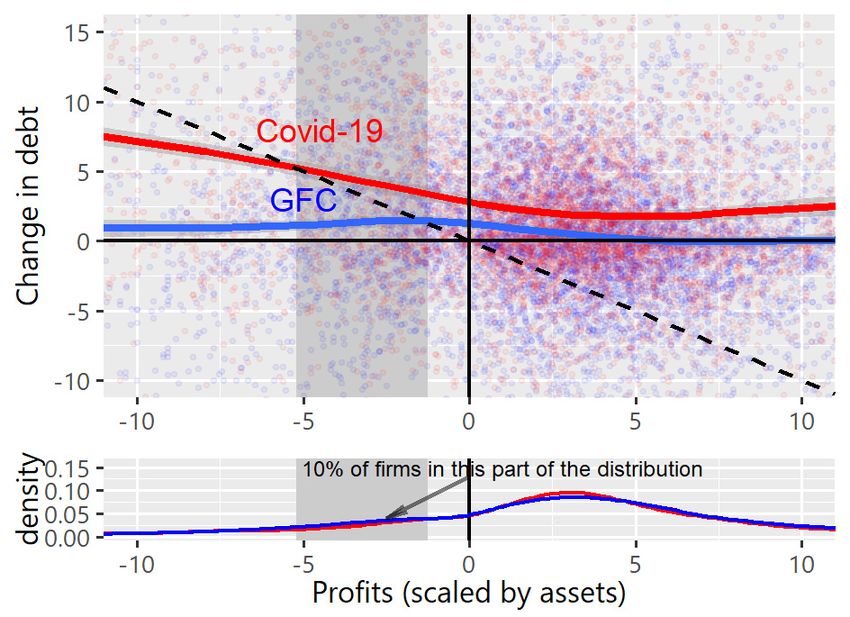
credit conditions during the GFC (Graph 2, left-hand panel). The red dots in the upper left-hand panel plot
accumulated operating profits over the first three quarters of 2020 against the increase in debt over the
same period, for more than 11,000 firms across nine advanced economies. We fit a curve through the dots
to visualise the non-linear relationship between profits and increases in debt (red line). The rising slope of
the red line in the upper-left quadrant shows that debt has increased strongly in loss-making firms.
Credit provision to loss-making firms during Covid-19…1 Graph 2
… significantly above GFC2 …significantly higher for Covid-19 affected sectors 3
Per cent Per cent
1
The smooth line is estimated using a generalised additive model, which fits penalised basis splines through the individual firm-level
observations. 2 Based on public and large private companies in all non-financial sectors across AU, CA, DE, ES, FR, GB, IT, JP and US. GFC
between Q3 2008 and Q2 2009 where change in debt is the change between Q3 2008 and Q2 2009 divided by total assets in Q3 2008, in
percent. Profits is the sum of the profits from Q4 2008 to Q2 2009 divided by total assets in Q3 2008; Covid-19 between Q4 2019 and Q3
2020 where change in debt is the change between Q4 2019 and Q3 2020 divided by total assets in Q4 2019, in percent. Profits is the sum of
the profits from Q1 2020 to Q3 2020 divided by total assets in Q4 2019. 3 Based on public and private companies in AU, CA, DE, ES, FR, GB,
IT, JP and US. Covid-19 exposed sectors: airlines, hotel, restaurants and leisure, entertainment, textiles, apparel and luxury goods.
Sources: S&P Capital IQ; authors’ calculations.
Strikingly, borrowing for many loss-making firms has exceeded their accumulated losses. This is
shown by the red line in the left-hand panel of Graph 2 lying above the dotted 45 degree line for much of
the upper-left quadrant. Even for heavily loss-making firms, debt has increased significantly on average.
This borrowing has clearly been quantitatively important in plugging the gap left by negative cash flows
in these firms.
By contrast, credit was far harder to come by during the GFC. The blue dots plot accumulated
operating profits over the three quarters following the collapse of Lehman Brothers at the height of the
GFC. On average, the blue line shows that loss-making firms managed to borrow. However, for many loss-
making firms, the amounts were significantly less than their operating losses (blue line below the dotted
line in the upper-left quadrant). This inability to cover losses with credit is likely to have driven many firms
into insolvency.
Quantitatively, the impact of ample credit is large. The grey shaded band in the bottom-left panel of
Graph 2 shows that around 10% of firms lie in the region where on average they received credit more than
one-for-one with losses during 2020, but were unable to do so during the GFC. Thus the ability to cover
operating losses with new borrowing across a significant mass of firms is likely to have been a significant
4 BIS Bulletinfactor behind the decline in business insolvencies last year, compared with the significant spike in early
2009 (Graph 1, left-hand panel).
Credit extension has been particularly generous for loss-making firms in sectors most exposed to the
pandemic shock (Graph 2, right-hand panel, orange dots and fitted curve). In particular, credit on average
has exceeded operating losses over the entire support of the distribution of losses, shown by the fitted
orange curve lying above the 45 degree line across the entire upper-left quadrant.
Liquidity to solvency: transition postponed or cancelled
The extension of credit to loss-making firms has clearly helped prevent the initial liquidity crunch from
quickly morphing into widespread solvency problems. However, it remains uncertain whether this
transition has been cancelled or postponed. Ample credit has resulted in sharp increases in firm
indebtedness over the past year (Graph 3, left-hand panel). For example, in the airline and hotel, restaurant
and leisure sectors, the median leverage in loss-making firms has increased by nearly 20 and 15 percentage
points respectively. Going forward, the path of future cash flows will be a key factor in determining whether
higher debt ultimately makes firms vulnerable to insolvency.
Loss-making firms1 Graph 3
Increase in debt to assets, Q4 2019-Q3 2020 EBITDA/debt counterfactual2
Telecom Energy
Energy Airlines
Real Estate Consumer Discretionary
Hotels, Restaurants
Consumer Staples
Metals & & Leisure
Entertainment
Mining Commercial Services
Materials & Supplies
Machinery Materials
Technology Metals & Mining
Commercial Services Industrials
& Supplies
Consumer Discretionary Machinery
Textiles, Apparel Textiles, Apparel
& Luxury Goods & Luxury Goods
Aerospace & Defense Utilities
Entertainment Consumer Staples
Industrials Technology
Utilities Telecom
Hotels, Restaurants Aerospace & Defense
& Leisure
Airlines Real Estate
–5 0 5 10 15 20 0.0 0.1 0.2 0.3 0.4
Percentage points Ratio
Median 25th-75th percentile pre-Covid-19 100% recovery
2021 forecasts for EBITDA
1
Based on public and large private companies in all non-financial sectors across AU, CA, DE, ES, FR, GB, IT, JP and US that have negative
cumulative operating profits from Q1 2020 to Q3 2020. 2 Vertical dashed lines show debt-to-EBITDA ratios at 3, 4, and 6. Forecasts are
based on 2021 EBITDA consensus estimates from S&P Capital IQ as of February 2021.
Sources: S&P Capital IQ; authors’ calculations.
To assess insolvency risk arising from increased indebtedness, we examine two scenarios for firms’
cash flows that made operating losses in 2020. First, a scenario where firm earnings return to pre-Covid-19
levels, which might be consistent with a swift vaccine roll out and broad-based recovery in economic
activity. A second scenario examines the case where earnings reach their current, more depressed,
consensus forecasts for 2021.
Under the first scenario, most sectors see a decrease in their earnings-to-debt ratio (Graph 3, right-
hand panel, blue triangles), due to the greater indebtedness they have acquired during the pandemic. This
is particularly pronounced in consumer-facing sectors such as airlines, where debt would increase from
below three to over four times earnings before interest, taxes, depreciation and amortisation (EBITDA) and
the hotel, restaurant and leisure sector, where debt would increase to over six times EBITDA. In other
sectors, a return to 2019 earnings would not prevent an increase in already stretched leverage levels.
BIS Bulletin 5That said, even if existing firms cannot sustain higher debt levels, bankruptcies are just a reallocation
of claims. So while ownership of firms may change, the firms could still continue to operate if cash flows
recover. Bankruptcies may rise somewhat in this optimistic scenario; however, the risk of a significant rise
in zombification is low.1
More worrying is the second scenario under which earnings reach their current consensus forecasts
for 2021. Under this scenario, firms in the airline, hotels, restaurants and leisure sectors see a much more
pronounced fall in their ratio of earnings-to-debt (Graph 3, right-hand panel, black dots), as would firms
in the entertainment, industrial and textile and apparel sectors. Loss-making firms in these sectors are
likely to remain highly dependent on continued support if bankruptcies are to be avoided over the coming
year. In such a scenario, zombification risks in these sectors could be higher. Moreover, continued
weakness in these sectors could spill over into the more leveraged real-estate sector. That said, consensus
earnings forecasts appear more optimistic for loss-making firms in other sectors. For example, private
sector forecasters currently expect a bumper increase in earnings that could materially reduce leverage
relative to 2019 levels in the materials, metals and mining, consumer staples and aerospace and defence
sectors.
Higher leverage, the uncertain outlook for cash flows and the role of credit in suppressing
bankruptcies to date all shine a spotlight on banking sector buffers (Araujo, Cohen and Pogliani (2021),
Hardy (2021)). As the economic outlook improved in the second half of 2020, banks reduced their quarterly
provisions, and some even took negative provisions. That said, these reductions remained substantially
smaller than the amount of loan loss reserves added during the previous three quarters. The spotlight also
falls on financial conditions, which affects a firm’s ability to refinance higher debt loads, and government
loan guarantees. Businesses that can succeed may need help as they undergo debt restructuring and repair
their balance sheets. More broadly, policymakers must encourage and enable businesses in the most
severely damaged sectors to reallocate their resources toward those sectors that are more likely to thrive
in the post-pandemic economy (Carstens (2020)).
References
Araujo, D, B Cohen and P Pogliani (2021): “Bank loan loss provisioning during the Covid crisis” Box C
Overview, BIS Quarterly Review, March.
Banerjee, R, G Cornelli and E Zakrajšek (2020): “The outlook for business bankruptcies”, BIS Bulletin, no 30,
October.
Banerjee, R and B Hofmann (2020): “Corporate zombies: Anatomy and life cycle”, BIS Working Papers,
No 882.
Banerjee, R and E Kharroubi (2020): “The financial vulnerabilities driving firms to the exit”, BIS Quarterly
Review, December, pp 59–67.
Carstens, A (2020): “The Great Reallocation”, op-ed, Project Syndicate, 12 October.
Hardy, B (2021): “Covid-19 bank dividend payout restrictions: effects and trade-offs”, BIS Bulletin, no 39,
March.
IMF (2021): “World Economic Outlook”, January 2021 Update.
Mojon, B, D Rees and C Schmieder (2021): “How much stress could Covid put on corporate credit? Evidence
using sectoral data”, BIS Quarterly Review, March, pp 57–72.
1
Banerjee and Hofmann (2020) show that zombie firms experience persistent as opposed to temporary declines in cash flow.
6 BIS BulletinPrevious issues in this series
No 39 Liquidity management and asset sales by Andreas Schrimpf, Ilhyock Shim
17 March 2021 bond funds in the face of investor and Hyun Song Shin
redemptions in March 2020
No 38 Covid-19 bank dividend payout restrictions: Bryan Hardy
10 March 2021 effects and trade-offs
No 37 Covid-19 and cyber risk in the financial sector Iñaki Aldasoro, Jon Frost, Leonardo
14 January 2021 Gambacorta and David Whyte
No 36 E-commerce in the pandemic and beyond Viviana Alfonso, Codruta Boar, Jon
12 January 2021 Frost, Leonardo Gambacorta and
Jing Liu
No 35 The recession-mortality nexus and Covid-19 Sebastian Doerr and Boris Hofmann
15 December 2020
No 34 Central bank swap lines and cross-border Iñaki Aldasoro, Christian Cabanilla,
14 December 2020 bank flows Piti Disyatat, Torsten Ehlers, Patrick
McGuire and Goetz von Peter
No 33 What comes next? Recovery from an uneven Daniel Rees
02 December 2020 recession
No 32 Monetary policy response in emerging Ana Aguilar and Carlos Cantú
12 November 2020 market economies: why was it different this
time?
No 31 Bankruptcies, unemployment and reallocation Ryan Banerjee, Enisse Kharroubi
09 October 2020 from Covid-19 and Ulf Lewrick
No 30 The outlook for business bankruptcies Ryan Banerjee, Giulio Cornelli and
09 October 2020 Egon Zakrajšek
No 29 Bonds and syndicated loans during the Tirupam Goel and Jose Maria
14 August 2020 Covid-19 crisis: decoupled again? Serena
No 28 Inflation at risk from Covid-19 Ryan Banerjee, Aaron Mehrotra and
23 July 2020 Fabrizio Zampolli
No 27 Global banks’ dollar funding needs and Iñaki Aldasoro, Torsten Ehlers,
16 July 2020 central bank swap lines Patrick McGuire and
Goetz von Peter
No 26 Corporate credit markets after the initial Sirio Aramonte and Fernando Avalos
01 July 2020 pandemic shock
All issues are available on our website www.bis.org.
BIS Bulletin 7You can also read