JAGUAR LAND ROVER CREDIT AGRICOLE 12TH ANNUAL GLOBAL HIGH YIELD AND LEVERAGED FINANCE CONFERENCE
←
→
Page content transcription
If your browser does not render page correctly, please read the page content below

JAG U A R LAN D ROV E R
CREDIT AGRICOLE 12TH ANNUAL GLOBAL HIGH YIELD AND LEVERAGED FINANCE CONFERENCE

BEN BIRGBAUER, TREASURER, 21 MARCH 2019
D i s cl ai m e r

Statements in this presentation describing the objectives, projections, estimates and expectations of Jaguar Land Rover Automotive plc and its direct and
indirect subsidiaries (the “Company”, “Group” or “JLR”) may be “forward-looking statements” within the meaning of applicable securities laws and
regulations. Actual results could differ materially from those expressed or implied. Important factors that could make a difference to the Company’s
operations include, among others, economic conditions affecting demand / supply and price conditions in the domestic and overseas markets in which
the Company operates, changes in Government regulations, tax laws and other statutes and incidental factors
-        Q3 FY19 represents the 3 month period from 1 October 2018 to 31 December 2018
-        Q2 FY19 represents the 3 month period from 1 July 2018 to 30 September 2018
-        Q1 FY19 represents the 3 month period from 1 April 2018 to 30 June 2018
-        Q3 FY18 represents the 3 month period from 1 October 2017 to 31 December 2017
-        Q2 FY18 represents the 3 month period from 1 July 2017 to 30 September 2017
-        Q1 FY18 represents the 3 month period from 1 April 2017 to 30 June 2017
-        FY19 represents the 12 month period from 1 April 2018 to 31 March 2019
-        H2 FY19 represents the 6 month period from 1 October 2018 to 31 March 2019
-        H1 FY19 represents the 6 month period from 1 April 2018 to 30 September 2018
-        H1 FY18 represents the 6 month period from 1 April 2017 to 30 September 2017
-        LTM represents the 12 month period from 1 July 2017 to 30 June 2018
-        FY18 represents the 12 month period from 1 April 2017 to 31 March 2018
-        FY17 represents the 12 month period from 1 April 2016 to 31 March 2017
Unless stated otherwise sales volumes are expressed in thousand units, and financial values are in GBP millions
Consolidated results of Jaguar Land Rover Automotive plc and its subsidiaries contained in the presentation are unaudited and presented under IFRS as
approved in the EU.
Retail volume data includes and wholesale volume includes sales from the Company’s unconsolidated Chinese joint venture (“CJLR”)
EBITDA is defined as profit before income tax expense, exceptional items, finance expense (net of capitalised interest), finance income, gains/losses on
unrealised derivatives and debt, gains/losses on realised derivatives entered into for the purpose of hedging debt, share of profit/loss from equity
accounted investments and depreciation and amortisation.
EBIT is defined as for EBITDA but including share of profit/loss from equity accounted investments and depreciation and amortisation.
Certain analysis undertaken and represented in this document may constitute an estimate from the Company and may differ from the actual underlying
                                                                            -2-
results
A g e nda

Business and strategy overview               4

Historical financial performance            10

Financial performance FY19                  14

Turnaround and transformation plans         20

                                      -3-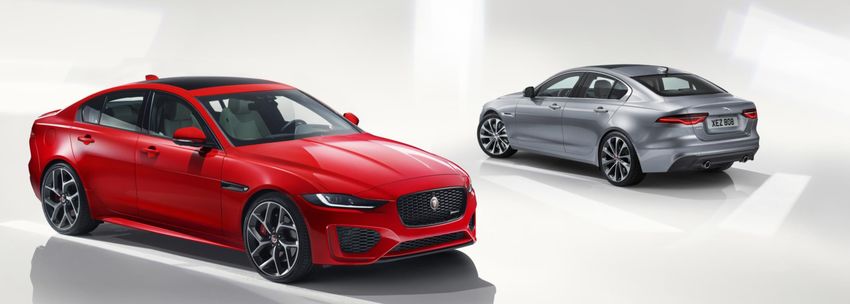
Consistent strategy
Inve sting to drive susta ina ble prof ita ble grow th

                 Business Blueprint                      Investment strategy

                                          -4-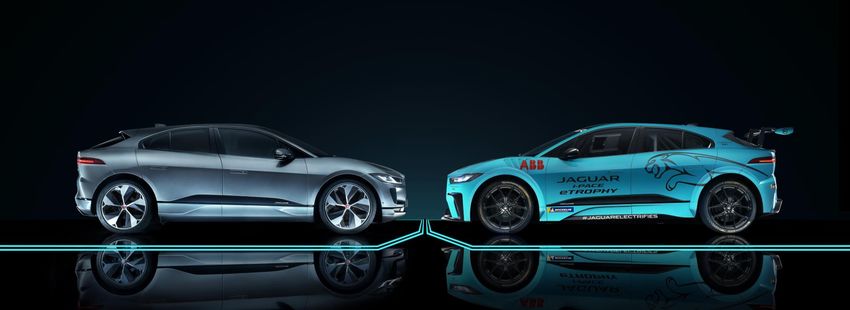
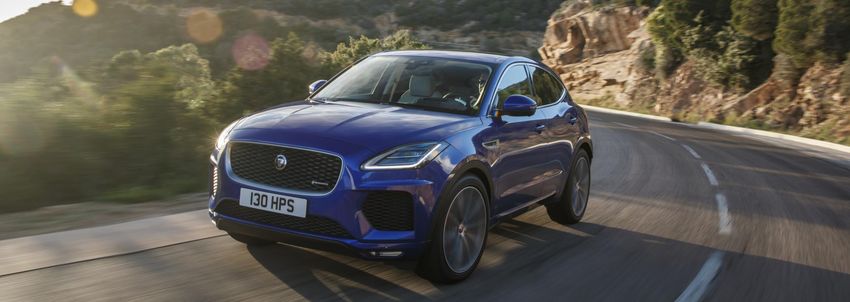
Growing Jaguar Land Rover model range
     Up to 13 na me pla te s vs 8 in 2010, pla n 16 by 2024
LUXURY           SPORTS                           LIFESTYLE                       LUXURY – RANGE ROVER    LEISURE - DISCOVERY            DUAL PURPOSE - DEFENDER

XJ               F-TYPE Coupe                      F-PACE                             RANGE ROVER         DISCOVERY

                                                                                                                                         LAND ROVER DEFENDER
                                                                                                                                         To be revealed CY19

XF SPORTBRAKE    F-TYPE CONVERTIBLE                E-PACE                             RANGE ROVER SPORT   DISCOVERY SPORT

XE
XF                                                 I-PACE                             RANGE ROVER VELAR

XE
                                                  XFL                                                        RANGE ROVER VELAR WINNER
                          JAGUAR F-PACE WINNER          JAGUAR F-PACE WINNER
                                                                                                                    WORLD CAR AWARDS
                            WORLD CAR AWARDS              WORLD CAR AWARDS
                                                                                                                       2018 WORLD CAR
                                2017 WORLD CAR                2017 WORLD CAR
                                                                                                                    DESIGN OF THE YEAR
                                    OF THE YEAR            DESIGN OF THE YEAR

                                                                                      NEW EVOQUE                                          VELAR, F-PACE & E-PACE
XE
                                                                                                                                              F-PACE & E-PACE
                                                                                -5-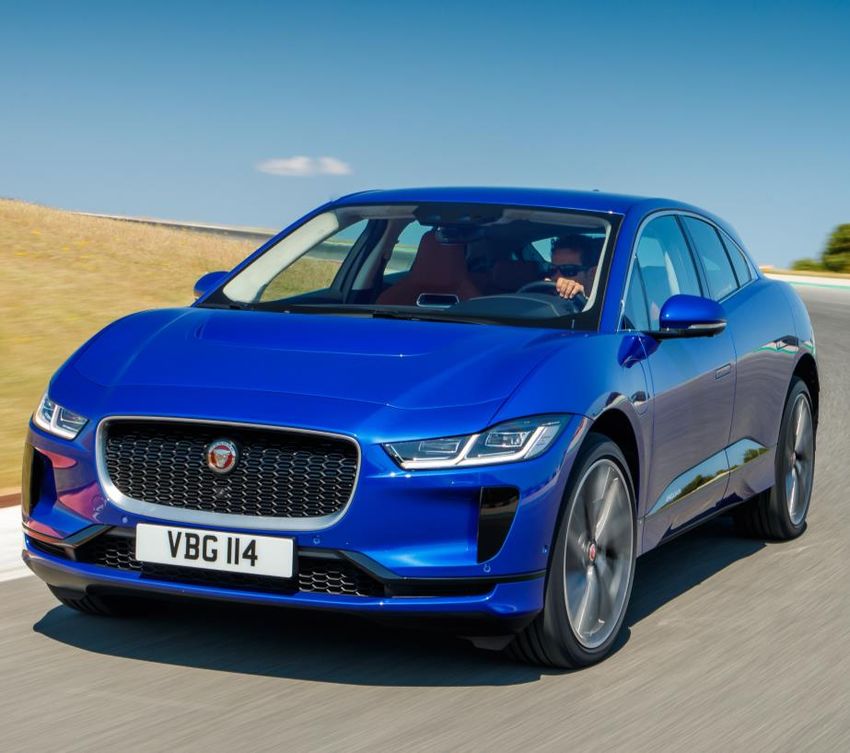
Technology transformation
 A utonom o us, Conne cte d , Ele ctrif i ca ti o n, Sha re d ( A CES)

   AUTONOMOUS                CONNECTED                         ELECTRIC                      SHARED

• Waymo long            • Remote smartphone          • All JLR models will have an    • Ride hailing
  term partnership        app                          electric option from 2020        service
• Self drive valet      • Wi-Fi Hotspot              • I-PACE BEV. Range Rover,       • Community
  park testing in                                      Range Rover Sport and            car sharing
                        • SOS Emergency Call
  the UK                                               Evoque hybrids                 • Self driving
                          and roadside
                          assistance                 • In-housing of electric drive     taxi service
                        • Stolen Vehicle               units and battery pack         • Pay per mile
                          Tracker                      assembly announced               insurance

                                               -6-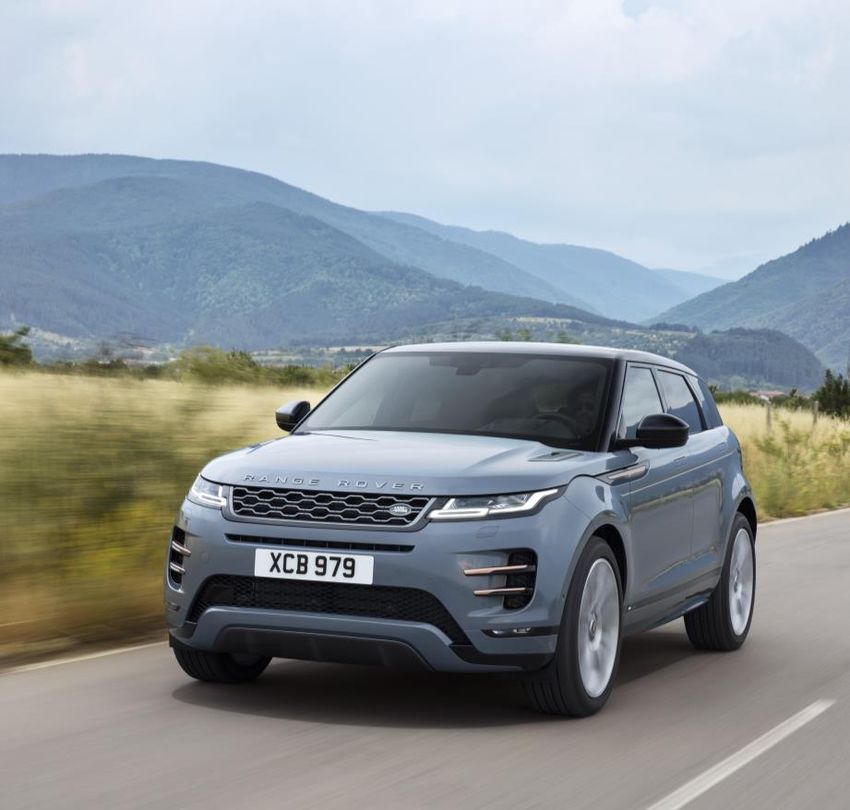
Ambitious electrification plans
    To me e t incre a sin g de ma n d, die se l a nd e missions cha lle nge s

      Range Rover and     Range Rover and     BEV and/or hybrids on all new and   BEV’s/hybrids
     Range Rover Sport   Range Rover Sport   replacement models with I-PACE in    available on all
       Diesel Hybrids         PHEVs           2018 and Evoque hybrids in 2019      JLR models

             2014             2017             2018                   2019          From 2020

EV
              2                 2                3                      6               14
Nameplates
                                                 -7-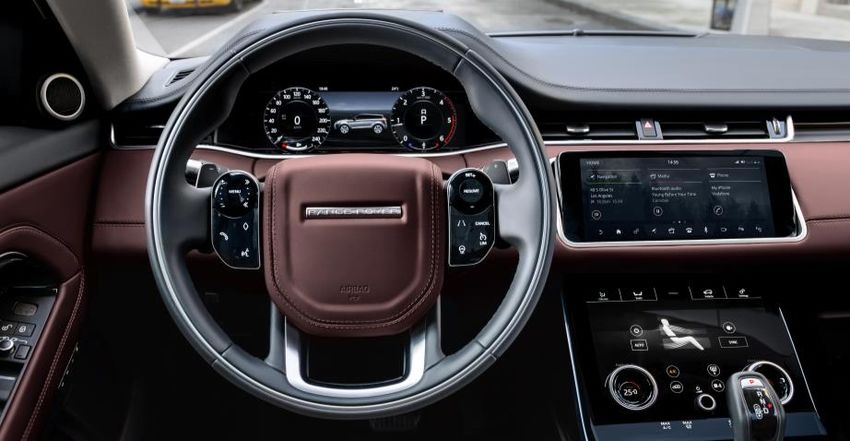
Investing in Modular Longitudinal Architecture
To ena ble cost e f f icie ncie s a nd f le xibility a cross pow e rtra i ns

            ICE & MHEV                         PHEV                            BEV

                                                  EDU

                                                                                 EDU
                                                                               Battery
                                                        Battery
                       Battery

                                                                                 EDU
                 ICE

                                                 ICE

                                                   8
Expanded manufacturing footprint

                UK

                                WOLVERHAMPTON
     SOLIHULL                       ENGINE
       335K                     MANUFACTURING
                               CENTRE (incl. EDU’s)             SLOVAKIA
                                     500K                       150K

    HALEWOOD                          CASTLE
       130K                          BROMWICH
                                        53K                                        CHINA
                                                                                   147k
                                                                           INDIA
                 BATTERY ASSEMBLY                               AUSTRIA    5K
                CENTRE, BIRMINGHAM                              73K

                                                 BRAZIL
                                                 8K

                                                          -9-
HISTORICAL FINANCIAL PERFORMANCE
Profitable growth over the long term
Re ce nt he a dw i n ds a nd low e r prof ita bi lit y

Over the period FY11 to FY18 JLR:
• Increased revenues by 15% CAGR to £26 billion
• Generated PBT of over £14 billion
• Invested over £20 billion in new products, technology, capacity and infrastructure
• Delivered over £3 billion cash flow (after funding the investment)

More recently, we have experienced lower volume growth and profitability, reflecting:
• Economic, geopolitical and regulatory headwinds including diesel, Brexit and market cyclicality
  particularly in China
• Technology and regulatory costs
• Higher incentive spending in competitive markets
• Negative operating leverage from lower volume growth and higher D&A expenses

Project Charge restructuring programme to reduce cost and improve cash flow combined with a
strong product pipeline to return JLR to generating sustainable, profitable growth

                                                - 11 -
Strong revenue growth driven by new models
Re ce nt grow th slow e r: cyclica lit y, die se l a nd Bre xit
IFRS, £m
25,787
24,340
22,135 22,287
19,387
15,786
13,525
9,884
FY11 FY12 FY13 FY14 FY15 FY16 FY17 FY18
Retails
241 306 375 434 462 522 604 614
(000’s)
New models
launched
- 12 -Generated £14b PBT FY11–18
Low e r prof ita bil ity more re ce ntly
£ millions
Increasing profitability FY11-15 reflecting: Lower profitability FY16-18, reflecting:
• Strong volume growth, 18% CAGR, driven • Lower volume growth, 8.5% CAGR with
by new models, new segments and China market challenges including cyclicality,
market growth diesel and Brexit uncertainty
• Lower D&A reflecting capitalisation timing 2,501
2,614 • High investment coming through D&A
1,675 1,610
1,507 1,557 1,536
1,115
FY11 FY12 FY13 FY14 FY15 FY16 FY17 FY18
Exceptionals - - - - - (157) 151 438
EBITDA margin 15.5% 15.6% 14.9% 17.5% 18.7% 14.1% 12.1% 10.8%
EBIT margin 11.5% 12.2% 10.9% 12.9% 13.9% 8.0% 5.9% 3.8%
- 13 -FINANCIAL PERFORMANCE – FY19
Exceptional £3.1b non-cash charge in Q3
 To reduce the ca rryi ng va lue of ca pita lise d inve stme nts
                                                                                                       IFRS, £m    PBT before                     PBT after
   Background                                                                                                                     Exceptional
                                                                                                                   exceptional                   exceptional
    • The automotive industry is facing significant market                                                                          items*
                                                                                                                      items                         items
       technological, and regulatory headwinds. At the same time,
       investment in new models, electrification and other technologies                                              (627)
       remains high                                                                                     (800)
                                                                                                                                   Intangibles
    • Given the muted demand scenario and the associated impact on
                                                                                                                                    £(1,557)
       the financials, JLR has concluded that the carrying value of                                    (1,800)
       capitalized investments should be written down, resulting in a
       £3.1b pre-tax exceptional charge                                                                (2,800)                     PPE & other
                                                                                                                                    £(1,565)
    • JLR continues to take decisive actions including the Charge and                                                                              (3,749)
                                                                                                       (3,800)
       Accelerate programs to make the business fit for future by
                                                                                                                                    (3,122)
       reducing costs and improving cash flows to deliver sustainable
       profitable growth                                                                                          Net worth pre       Net           Net
                                                                                                                   impairment     Impairment**     worth
   Impact of exceptional charge
    • Loss before tax for the 9 months to 31 December 2018 of £3.7b                                     8,000
                                                                                                                                    (2,857)
    • Net worth £6.2b (debt to equity 0.75:1)
                                                                                                        6,000
    • Cash flow unchanged                                                                                                                          6,221
                                                                                                                     9,078
    • Will reduce growth in depreciation & amortization by c.£300m                                      4,000
       per annum
                                                                                                        2,000
* £3.1b related to impairment and £17m related to pension charge
** Reflects impairment of £3.1b partially offset by a reduction in deferred tax liabilities
                                                                                              - 15 -
                                                                                                            0
9M FY19 loss before exceptional items £(627)m
Prima ri ly re f le cts sha rp slow dow n in China , highe r D&A , re va l
IFRS, £m
Revenue PBT before exceptional items Margins
FY18 FY19 FY18 FY19 FY18 FY19
18,231
17,080
705 EBITDA
10.3% EBITDA
9M
7.6%
EBIT
3.1%
EBIT
(2.3)%
(627)
- 16 -9M FY19 retail sales down YoY
China signif ica nt ly w e a ke r; North A me rica , UK a nd Ove rse a s up
Units in ‘000
100.9 419.9
89.6
82.3
77.5
69.6
North America UK Europe China Overseas* Total
YoY +8.5% +9.6% (6.1)% (31.3)% +6.6 (4.9)%
Industry -% (4.2)% +0.1% (6.5)% +4.2
Wholesales
Units 95.2 78.9 86.5 30.0 65.7 356.4
YoY +3.5% (4.1)% (7.0)% (33.9)% (1.0)% (10.4)%
Retail volumes include sales from Chery Jaguar Land Rover – 9M FY19 46,381 units, 9M FY18 65,425 units
Wholesale volumes include sales from Chery Jaguar Land Rover – 9M FY19 47,343 units, 9M FY18 67,764 units. For statutory reporting under IFRS, the Group recognises revenue on wholesales (excluding sales from CJLR) which totals 356,421 9M FY19 and 382,989 9M FY18. The Group recognises
it’s share of profits from CJLR within EBIT.
*Overseas markets includes Australia, Brazil, Colombia, India, Japan, South Korea, Mexico, MENA, Russia, Singapore, South Africa, Taiwan and certain importers
- 17 -9M cash flow £(2.7)b after £3.1b investment
Expect positive Q4 ca sh f low ( positive PBT a nd w orki ng ca pita l)
Payables £(1.1)b – expected to improve in Q4
D&A £1.7b Inventory £(418)m – expected to improve in Q4
Receivables £384m
2,190 (197)
(3,081)
£(264)
(627)
(944)
(2,659)
PBT Non-cash Tax Investment Working Free
FY18 and other capital cash flow
9M FY18 734 1,404 (210) (3,098) (824) (1,994)
* Free cash flow defined£(226)
as net cash generated from operating
£128 activities less net cash used in investing activities short-term deposits) and£(618)
(excluding movements in £90
£(52) after finance expenses and £(580)
fees and payments of lease
obligations. Free cash flow also includes foreign exchange gains/losses on short-term deposits and cash and cash equivalents
18£4.4b total liquidity at 31 December 2018
Af ter $700m bond re pa yme nt in De ce mbe r
IFRS, £m
Debt maturity profile
7,000 2.1
1.3
2.0
6,000 4,669
4,669 0.0
4,391 5,000
3,817
4,000 -2.0 186
2,930 -4.0
3,000 2,215 785
2,000 -6.0
1,000 -8.0
1,935
- -10.0
Q3 Q3
FY18 FY19
Debt EBITDA Debt / EBITDA
Undrawn
RCF 3,698
31 Dec
Cash 1,935
2,456
157 793
400 583 628 453
393 393 300 384
Total CY19 CY20 CY21 CY22 CY23 CY24 CY25 CY26 CY27 Total
Liquidity Debt
Cash and financial deposits Bonds $1b loan Other
- 19 -JLR TURNAROUND AND TRANSFORMATION PLANS
Turnaround and transformation plan launched
Response to more cha lle ngi n g ma rke t cond iti o ns

             Demand likely to remain muted due                              Turnaround plan required to
             to geopolitical, economic, financial                           succeed in this more
             and regulatory factors                                         challenging environment

    1. Reduce cost and improve profitability and cash flow -- Project Charge
       • Enhanced focus on improving cash flow -- investment, working capital and profits
       • Comprehensive profit improvement and cost savings plan
       • Reassessment of investment spending to ensure adequate returns

    2. Fix structural issues -- Project Accelerate

    3. Rejuvenate sales
       • Leverage strong product portfolio and product pipeline
       • Resume profitable growth in China

                                                      - 21 -
Project Charge: off to an encouraging start
On-tra c k to achieve £2.5b target, Profit actions focus of next phase
Steering Committee
JLR Board of Management and JLRA Plc board
representation
Charge Leadership team
Chief Transformation Officer
Charge Management Office
Operational workstreams
Cash balance Investment Working capital
PBT Retails Organisation
27Significant actions across 14 work streams
To delive r ta rge t sa vings of £2.5b w ith more to imple me nt
Inventory & People & Commercial Product Tiger
Investment Overheads Commercial FME
Volumes Organisation Pricing/VME Teams
Production Non-core Manufacturing Product Tax
China Working Capital
Purchasing Assets & Logistics & Programmes & Treasury
To realise in the days ahead
People & Product cost
Investment Volumes Inventory Commercial
organisation “Tiger teams”
Non-product and non- Production schedules Continue to target 4,500 workforce Agile, cross Improve model year
core investment further adjusted global destocking of reduction announced functional teams to transition to reduce
reduction and including at Engine inventory and actively following release of rapidly implement pressure on VME
cancelation Manufacturing Centre reduce company Own 1,500 employees in product profit
e.g. real-estate in Wolverhampton and Use Vehicle stock 2018. £200m one improvement. More targeted and
Changshu time separation Actions in place for efficient fixed
charge 2020 Model Year. marketing spend
£700m £300m £960m, of which >£400m through workforce reduction
28Environment continues to be challenging
Challenges
Challenges Challenges • Continued Macro headwinds
• Brexit • Lower consumer confidence
Challenges • Diesel uncertainty
• High Incentives • Diesel uncertainty • Slowing economy
• Tariff risks Positives :
• Tier 1 & 2 demand good
Positives • Premiumisation is a mega
trend
• Strong SUV demand
-24
24 -China market
Macroeconomic environment is challenging
GDP growth rate [YoY%] Industrial value added
• Economic outlook pessimistic despite significant expansion of state
[Cumulative growth rate YoY%]
7.8 owned enterprise’s value added
State owned enterprises
7.3 10
6.9
6.7 6.8 6.6
6.4 6.3 Previous
6.2 Forecast • GDP growth of private enterprises, the key consumers of premium car
New 0
market drops
May-16
Sep-16
May-17
Sep-17
May-18
Sep-18
Jan-16
Jan-17
Jan-18
6.3 Forecast
6.1 6.1
reduced
2013
2014
2015
2016
2017
2018F
2019F
2020F
2021F
-10
• Both PMI and the Shanghai Composite have dropped significantly since
PMI [Manufacturing purchasing Shanghai Composite [Stock market the second half of 2018
manager index] index]
51.6 51.5 51.9
51.5 51.3
51.3 51.4 51.2
50.8 3,400.0
50.3 50.2
50.0
49.4
More than
2,900.0
-20% YoY
Economic slowdown &
trade-war with USA
Dec Feb Apr Jun Aug Oct Dec 2,400.0
2017 Jan . 2018 Jan 2019
Source: GDP = Reuters forecast 2018-01-18, Industrial value added, PMI = National Bureau of Statistics; Shanghai Composite from 1.1.2018-21.01.2019 closing rates
25China market
Industry volumes weakening
Sa le s ince ntive s rising
Market growth rate 2018 vs. 2017 [%] Premium Total • CY18 is the first time since 1990 that the total passenger car market
+38%
+24% Premium Market more stable declined (-8%)
+13% +14% +12%
+27% +7%
+5% +3% +2% +3%
-1% -1%
+12%
• The premium market hit it’s lowest growth since 2004 with +8%
-2% -2% -2%
-6%
-11% -11%
-16% -15%
-24% -22%
Jan Feb Mar Apr May Jun Jul Aug Sep Oct Nov Dec • Premium market growth achieved by tapping into the lower segments via
2018
heavy discounts
Premium & JLR discount [%] Premium JLR
Sharp premium discount increase
-13%
-16%
• Started to focus on dealer profitability over volumes to get back to
+7%p sustainable growth
+5%p
-21%
-20%
• JLR discounts have been higher than competition, however, we are
narrowing the difference as competitors have been increasing discounting
Jan Feb Mar Apr May Jun Jul Aug Sep Oct Nov Dec
2018 in response to weaker market conditions over the course of the year
Source: Volume = insurance data by CATARC; Discounts = CAM
26China market
Immediate focus: create sustainable dealer model
Shif t to ‘Pull’ syste m
Dealer stock development [inventory in units]
• Supplies have been cut to reduce our own and dealer stock, the
Pipeline
lead-time 2019 target is 1.5 months
• Commercial policies streamlined
>2 months
− Simplified retail incentives instead of wholesale
− Additionally support to compensate for retailers losses
May
Dec
Jun
Nov
Oct
Jan
Aug
Sep
Apr
Jul
− Qualitative improvements e.g. incentives for local
registrations to grow a stable after-sales revenue income
Share of registrations within dealer’s own city [% of total sales ]
87% Avg. 2018
82% • Extensive dealer on site training launched to improve customer
85%
83% Avg. 2017 experience and drive operational excellence
77%
81%
• Alignment with dealers secured
79%
77% • Expect sales to stabilize in the next few months and grow
75%
thereafter
Jan'17
May
Jan'18
May
Dec
Feb
Mar
Nov
Feb
Mar
Nov
Jun
Aug
Sep
Oct
Jun
Aug
Sep
Oct
Apr
Apr
Jul
Jul
Source: Volume = insurance data by CATARC; Discounts = CAM 27China market
Long term premium opportunity substantial (4m+)
Overall demand for cars in China
China’s automotive car park Cars per 1.000 people in 2017
[Million units] [units]
834
711
870 611 599 598 599
513
600
210
131
130 150 160 190
Premium Market Forecast [million units] • We remain optimistic about China
• Market development likely to triple car park from todays level of 600-
800m cars, e.g. annual demand of 35-50m cars
2.8 Status conscious consumers,
2.6 willing to upgrade to premium • For JLR, by 2025, this means an annual market size of:
2.2 Slowing but ongoing SUV
1.8 1.9 share increase
1.5 Double digit growth rate for
– 4m “Core Premium” vehicles
NEV every year in forecast
– 3m upgradation opportunity from “Near Premium”
Source: Premium Forecast = IHS Market Insights per Nov. 2018; Carparc data = China State Information Center per Nov. 2018 (SIC)
28Brexit
Mitigation plans for a ‘no-deal’ scenario
‘No Deal’ Brexit
Short-term considerations Longer-term considerations
Delays at ports could disrupt the importation of components into the UK Imposition of tariffs on UK-EU and UK-EU 3rd country trade would
for manufacturing, as well as the export of finished vehicles adversely impact JLR profitability
JLR response JLR response
1) Factory downtime
• Pull forward of five scheduled Easter Holiday dates beginning 15 April 1) JLR would attempt to pass on pricing for tariffs but it is uncertain to
what extent this will be possible
• Additional five days of plant downtime added (8 - 12 April)
2) The Pound would also likely weaken against all foreign revenue
2) Production buffer stock currencies and would provide some offset against the cost of tariffs on
• JLR plans to have sufficient production buffer stock to minimise EU and EU treaty revenues
potential disruption arising during the first week of April
3) JLR would need to reassess its manufacturing and sourcing strategy
3) Governance around operational continuity
• A comprehensive cross-functional Brexit Governance programme in
place, minimising impact a ‘No Deal' Brexit where possible. Examples:
Purchasing Marketing & Sales IT Customs JLR’s external engagement on ‘No Deal’
Managing supplier Assessment of Systems updates to Ensuring customs
engagement and ‘No potential pricing support changes to compliance across EU JLR continues to actively engage with government and trade bodies
Deal’ readiness action in response to pricing and customs and EU Trade
‘No Deal’ management Agreement markets globally on the implications of a ‘No Deal’ Brexit
29Rejuvenating sales
Launching all new Range Rover Evoque
Includ i ng mild a nd plug -in hybrid optio ns
- 30 -Rejuvenating sales
Jaguar I-PACE now launched globally
Grow ing sa le s a nd strong orde r book
I-PACE retail volumes
2,195 2,230
1,200
710
c. 3 months
223 order cover
41 136 140
18
EV of the year
German Car of
the Year
European car of
- 31 - the yearRejuvenating sales
Continuing to strengthen product portfolio
All ne w Evoque la unchi n g, De f e nde r to be re ve a le d in 2019
XE XF XJ E-PACE I-PACE F-PACE F-TYPE Discovery Discovery Evoque Velar Range Range Defender 2 Other
Sport Rover Sport Rover
Calendar
Year
2011 New
2012 New
2013 New New
2014 New
2015 New New Refresh Refresh
2016 New
2017 New Refresh New New Refresh Refresh
2018 New
2019 New New
2020-24 New models, replacement models and mid-cycle refreshes to be announced
- 32 -Looking ahead
Our pla ns
Key metrics FY19 FY20-22 Beyond
Retail sales growth Negative > Premium Segment > Premium Segment
EBIT margin Marginally negative 3-6% 7-9%
PBT Negative Positive Positive
Investment spending Up to £4b Up to £4b 11-13% of revenue
Free cash flow Negative Negative in FY20; Positive
Positive thereafter
Gross debt/Ebitda ≤ 2.5x ≤ 2.5x ≤ 2.0x
• FY19 retail sales growth expected to be negative with a marginally negative EBIT margin. Disappointed with overall performance due to
unexpected slowdown in China
• Continue to invest up to £4b p.a in exciting products and technologies
• Drive long term sustainable growth in China with revised “Go-to-market” strategy whilst continuing to strengthen our brands
• Deliver Project Charge targets of £2.5b by end of March 2020 with enhanced focus on costs and profitability in the next phase
• JLR investor day scheduled for Wednesday 5th June at the British Motor Museum, Gaydon, Warwickshire, UK
We are committed to competitive, consistent, cash accretive growth over the medium to long term
- 33 -ADDITIONAL SLIDES
January and February 2019 sales performance
  China signif ica nt ly w e a ke r; North A me rica up signif ica nt ly
          Units in ‘000

                    23.7                                                                                                                                                                                                                                                  82.0

                                                                                                                            20.5

                                                                                                                                                                            13.6                                               13.9
                                                                        10.3

          North America                                                   UK                                            Europe                                            China                                         Overseas*                                        Total
  YoY            +19.3%                                               +1.9%                                              (2.1)%                                         (42.7)%                                              (2.9)%                                     (7.8)%
Industry (2.0)%                                                       (0.6)%                                             (3.4)%                                         (17.6)%                                              +0.6%
  Wholesales
  Units 21.3                                                             22.7                                              21.5                                            11.9                                               13.9                                      91.4
  YoY (14.8)%                                                         17.3%                                               (4.1)%                                         (48.0)%                                            (17.3)%                                   (14.2)%
 Retail volumes include sales from Chery Jaguar Land Rover – January and February 2019 7,186 units, January and February 2018 14,395 units
 Wholesale volumes include sales from Chery Jaguar Land Rover – January and February 2019 5,273 units, January and February 2018 13,322 units. For statutory reporting under IFRS, the Group recognises revenue on wholesales (excluding sales from CJLR). The Group recognises it’s share of profits
 from CJLR within EBIT.
 *Overseas markets includes Australia, Brazil, Colombia, India, Japan, South Korea, Mexico, MENA, Russia, Singapore, South Africa, Taiwan and certain importers
                                                                                                                                                  - 35 -
You can also read