2018 Barclays CEO Energy-Power Conference - September 5, 2018 - Investor Information
←
→
Page content transcription
If your browser does not render page correctly, please read the page content below
2018 Barclays
CEO Energy-Power Conference
              September 5, 2018

                  Copyright 2018 Apergy. All rights reserved.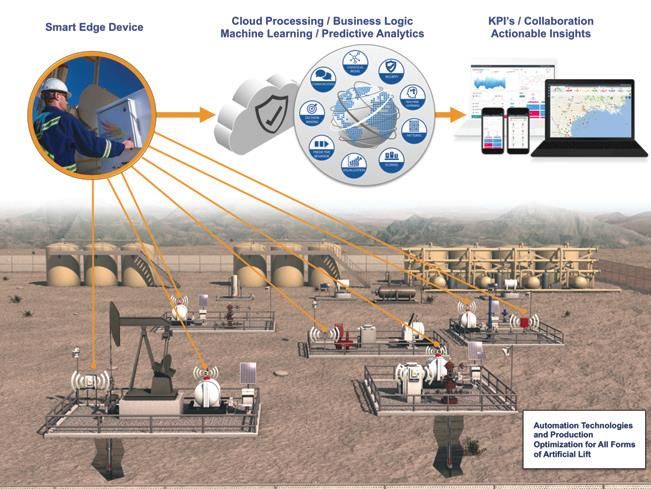
Notices and Disclaimers
    Forward-Looking Statements
    This investor presentation, and the related discussion, contains forward-looking statements within the meaning of Section 27A of the Securities Act of 1933, as amended, and Section 21E
    of the Securities Exchange Act of 1934, as amended, that are based on the beliefs and assumptions of management of Apergy Corporation (“Apergy”) and on information currently
    available to Apergy’s management. Forward-looking statements include, but are not limited to, statements related to Apergy’s expectations regarding the performance of the business,
    financial results, liquidity and capital resources of Apergy, the benefits resulting from Apergy’s separation from Dover Corporation, the effects of competition and the effects of future
    legislation or regulations and other non-historical statements. Forward-looking statements include all statements that are not historical facts and can be identified by the use of forward-
    looking terminology such as the words “outlook,” “believes,” “expects,” “potential,” “continues,” “may,” “will,” “should,” “could,” “seeks,” “approximately,” “projects,” “predicts,” “intends,”
    “plans,” “estimates,” “anticipates” or the negative version of these words or other comparable words.
    Forward-looking statements involve risks, uncertainties and assumptions. Actual results may differ materially from those expressed in these forward-looking statements. You should not put
    undue reliance on any forward-looking statements in this presentation. Forward looking statements speak only as of the day they are made and Apergy does not have any intention or
    obligation to update forward-looking statements after Apergy distributes this presentation, except as required by law.
    Apergy’s outlook is provided for the purpose of providing information about our current expectations for 2018 and the general outlook for the business in the longer term. This
    information may not be appropriate for other purposes.
    Factors that could cause Apergy’s results to differ materially from those expressed in forward-looking statements are included in the section entitled “Risk Factors” in the Information
    Statement that is an exhibit to Apergy’s Registration Statement on Form 10, originally filed with the Securities and Exchange Commission (“SEC”) on March 26, 2018, as amended and
    supplemented, and in Apergy’s other filings with the SEC. There may be other risks and uncertainties that Apergy is unable to predict at this time or that Apergy currently does not expect
    to have a material adverse effect on Apergy’s business. Any such risks could cause Apergy’s results to differ materially from those expressed in forward-looking statements.

    Non-GAAP Measures
    This investor presentation, and the related discussions, contains certain non-GAAP financial measures, which should be considered only as supplemental to, and not as superior to financial
    measures prepared in accordance with generally accepted accounting principles (“GAAP”). Please refer to the Appendix of this investor presentation for a reconciliation of these non-
    GAAP financial measures to the most directly comparable financial measures prepared in accordance with GAAP and definitions and calculation methodologies of defined terms used in
    this investor presentation. For additional information about our non-GAAP financial measures, see our filings with the SEC.
    This investor presentation is not an offer to sell or the solicitation of an offer to buy any securities of Apergy, nor will there be any sales of securities of Apergy in any jurisdiction in which
    the offer, solicitation or sale would be unlawful prior to registration or qualification under the securities laws of such jurisdiction.

1                                                        Copyright 2018 Apergy. All rights reserved.
Apergy Overview
Leading onshore-focused equipment and digital technology provider to the upstream
oil and gas industry
Most trusted brands recognized for quality, performance and customer-service
Highly engineered products, innovative technologies and digital solutions
Focused strategy and operating philosophy leveraging a customer-centric business model
Strong financial results including robust free cash flow through business cycles
Experienced and motivated team focused on collaborative approach to solving
customer problems
WE ARE APERGY…
Unlocking energy to drive value for our customers, employees and shareholders
2 Copyright 2018 Apergy. All rights reserved.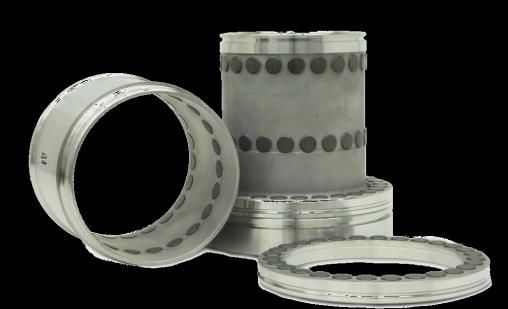
60 Year Heritage of the Most Trusted Brands
      in the Oil Field
                                                                                                 + Automation
     Portfolio     Artificial Lift                   + Drilling                            + Broadened Artificial Lift
    Expansion       (Rod Lift)                     Technologies                             (Electrical Submersible
                                                                                            Pump (“ESP”), Gas Lift)

    Underlying                                        Diamond                                      Shale Oil
                  Predominantly                        Cutting                                 Horizontal Drilling
     Industry        Rod Lift                        Superior to                                High Spec Rigs
      Trends                                          Carbide                                  Automation / IIoT                           $1.1 billion annual sales 1
                                                                                                                         Today                      NYSE: APY

                                                                                       2010s

    Portfolio                                                     2000s
    Evolution                        80s / 90s
                 60s / 70s
                                          Strong organic
                                         growth / tuck-in
                                              M&A

3                                        Copyright 2018 Apergy. All rights reserved.                                             1   Last Twelve Months ended June 30, 2018.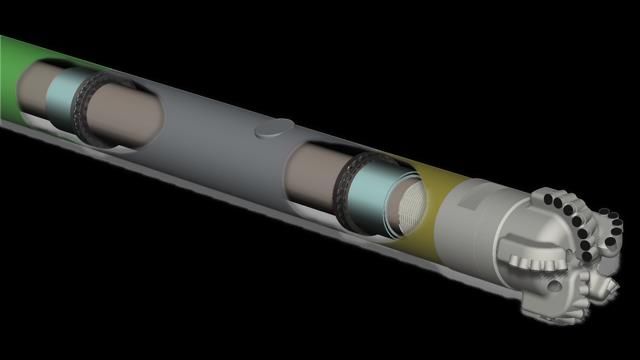
Apergy is Present Across                                                                                       Production & Automation Technologies:
                                                                                                                           Facilitating the efficient, safe and effective
                                                                                                                                                                               Drilling Technologies:
                                                                                                                                                                               Providing highly specialized, innovative,

            the Wellsite                                                                                                   extraction of oil and gas through a suite of
                                                                                                                           premier brands.
                                                                                                                                                                               and proprietary products used in
                                                                                                                                                                               drilling oil and gas wells.

                                                                                                                                                                                                       11
                            8                   8               9                                                              8
                                                                                                                                                                    11

                                                         5        1
                                                                                              9

                                                                10

                                                                                                                                                                    11                                    13

        1                   2          3            4

                                                                 6                    7
                                                                                                                                                                                   12

    ARTIFICIAL LIFT                                     DRILLING TECHNOLOGIES                              OTHER PRODUCTION EQUIPMENT                          DIGITAL

    1. Progressive Cavity Pumps   4. ESP                6. Diamond Drill Bit Insets                        8. Well Head Production Equipment                   11. IIoT Enabled Technologies
    2. Rod Lift                   5. Gas Lift           7. Diamond Bearings                                9. Chemical Injection                               12. Optimization Software
    3. Plunger Lift                                                                                        10. Flow Control Valves                             13. Remote Monitoring

4                                                            Copyright 2018 Apergy. All rights reserved.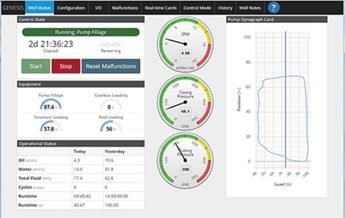
Portfolio Profile
Product Line 1 Geography 1
Artificial lift ROW
59% Middle 11%
East 5%
Canada 7%
9%
Other 77%
23% 9% Production
Drilling Equipment U.S.
Technologies Digital US
Nearly all onshore Strong international presence, including South
75% oil America, Australia, Canada, and the Middle East
Onshore production-focused portfolio with strong product & technology offering
5 Copyright 2018 Apergy. All rights reserved. 1 Revenue from last twelve months ended June 30, 2018.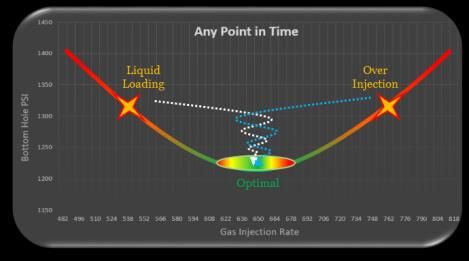
Business Aligned and Correlated with Positive
              Market Drivers
                                       U.S. Wells Drilled                                                                     Global & North America E&P CapEx
                                                                                              Footage Drilled   Capex($bn)                                                                                    % NAM
                Wells
                                                                                                 (mm ft.)
                                       Strong backlog potential – DUCs
              50,000                                                                                 500        $400                                                                                            80%
                          45,882        at highest level in last 5 years
                                                                                                                             $331                                                                               70%
              40,000                                                                                 400
                                                                                                                 300                                                                                            60%
                                                                                     27,347
                                   28,387                              24,951                                                                                                                     $249
              30,000                                                                                 300                     $149        $237                                                                   50%
                                                         21,858                                                                                                                    $220
                                                                                                                 200                                                $189                           $82          40%
              20,000                           15,204                                                200                                                                            $76
                                                                                                                                         $125       $155
                                                                                                                                                                     $74                                        30%

              10,000                                                                                 100         100
                                                                                                                                                     $88                                                        20%
                                                                                                                             $183                                                                 $168
                                                                                                                                                                                   $143
                                                                                                                                         $112                       $116                                        10%
                     --                                                                              --                                              $67
                          2014A    2015A        2016A    2017A         2018E           2019E
                                                                                                                    --                                                                                          --
Avg. Footage                                                                                                                 2014A      2015A       2016A          2017A           2018E          2019E
                           8,824    9,505      10,596    11,911        11,394          11,662
Drilled/Well (ft.)
                                                                                                                                     NAM Spending         International Spending              % NAM
End of Year Drilled
but Uncompleted            4,907    6,205       5,327    6,823         8,033 1
(“DUC”) Wells
                                    U.S. Wells Drilled      U.S. Footage Drilled                                                                    Source: Spears Drilling and Production Outlook, June 2018 and U.S. Energy
                                                                                                                                                           Information Administration Drilling Productivity Report, August 2018.
                                                                                                                                                                                                           1 As of June 30, 2018.
6                                                           Copyright 2018 Apergy. All rights reserved.
How Apergy Wins
Best Products Customer Benefit
Customer Intimacy
Helping customers achieve
Best “Speed” their objectives –
enhanced productivity and
cash flow generation
Ongoing Innovation
Problem-Solving Mindset
7 Copyright 2018 Apergy. All rights reserved.Drilling Technologies
23%
Drilling
Technologies
Undisputed industry leader in polycrystalline
LTM Q2-18 $255mm diamond cutters for oil & gas drilling
Revenue
% Total Apergy
Uniquely positioned to leverage long-term
Geography1,2 Product Innovation1
favorable industry trends – U.S. shale,
ROW
horizontal drilling, increasing laterals
China 6% Revenue
Europe
8%
5%
39%
from new Critical partner to customers in achieving
products
introduced drilling productivity
81% in last 3
US
61%
years • 95%+ of cutters are designed to meet unique
requirements and finished to exact customer
Product Type1 Brands1 specifications
• Drill bit is mission-critical piece of equipment to
Other
12%
avoid downtime and drilling failures
88% Superior industry reputation for innovation,
Polycrystalline
Diamond quality and customer service
Cutters (PDC)
1 Revenue from the last twelve months ended June 30, 2018.
8 Copyright 2018 Apergy. All rights reserved.
2 Represents geography by sales destination.Production & Automation Technologies
Leading provider of production and automation
LTM Q2-18
$858mm
Production & equipment and digital solutions in North America
77% Automation
Revenue Technologies and targeted global basins
% Total Apergy
Geography 1 Product Mix 1 Trusted brands known for superior technology,
Other highest quality / reliability and strong
APAC ROW
EMEA 1%
Production
Equipment
aftermarket offering
8% 13%
4%
Rest of
Americas
11% Digital 11%
76%
Broad portfolio facilitates the efficient, safe and
Artificial Lift
76% cost effective extraction of oil and gas, resulting
US
in revenue opportunities over life of well
US Basin 1 Brands
Enables lower production costs for operators and
Other
Permian optimizes well efficiency
23%
42%
17%
Emerging leadership in new digital offerings
Rockies
9% 9%
Mid-Con Bakken
1 Revenue from the last twelve months ended June 30, 2018.
9 Copyright 2018 Apergy. All rights reserved.Positioned to Benefit from Growth Trends in Artificial Lift
ESP Hydraulic & Gas Lift 1 Rod Lift
2017 Mkt. Size $3.7bn $0.5bn $3.4bn
LTM Q2-18 % of
Artificial Lift Revenue
2 29% 9% 38%
Favored for handling initial production (IP) Brought in as flow rate drops Installation at later stage in well life for lower
Use Cases rates Fill lifting gap for deep and high rate flow rate
Most effective for dewatering horizontal wells Low cost and maintenance requirements
Higher ESP demand from shifts in Applications in unconventional wells Strong Permian switching demand expected in
Market Trends unconventional drilling practices ’19-’20E
Longer laterals, increased frac stages Increased efficiency – smaller footprint pumps
Early life of
Flow Rate (bb/d)
well
Later life of
well
Life of Well
Apergy offers the right equipment and the best application engineering knowledge at
every stage in the well lifecycle to design optimal solutions for customers
Source: Kimberlite, Evercore ISI, Spears DPO & OMR, PWC Artificial Lift Study, Internal Analysis.
10 Copyright 2018 Apergy. All rights reserved. 1 Represents weighted average growth rate of hydraulic and gas lift markets.
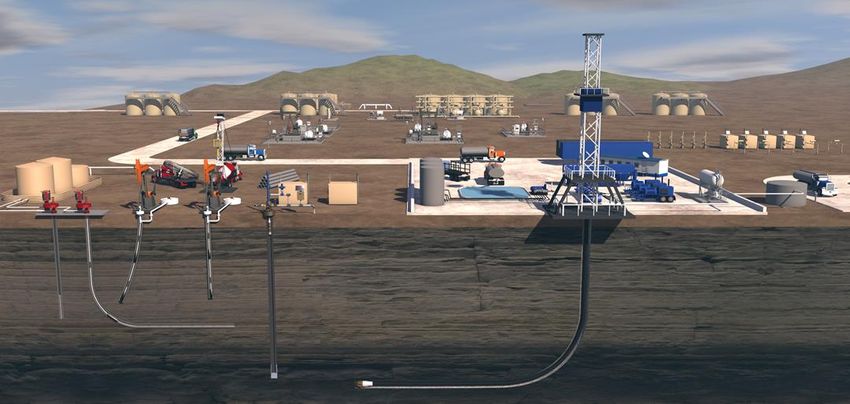
2 Other including PCP and plunger lift is 23% of revenue.Leader in Digital Technologies:
Monitor, Analyze, Optimize
Recognized as innovative leader in Cloud Processing / Business Logic KPIs / Collaboration
Smart Edge Device
digital IIoT solutions that support and Machine Learning / Predictive Analytics Actionable Insights
integrate all of our customer’s digital
needs
Offers full portfolio of connected
devices, cloud based analytics
and actionable insights
Provide ‘tiered services’ to offer fit for
purpose service packages to our
customers through deep expertise and
reliable analytical technologies
$35
Digital revenue
$30
CAGR – 44%
$25
$20
$ millions
$15
$10
$5
$0
Q1-17 Q2-17 Q3-17 Q4-17 Q1-18 Q2-18
11 Copyright 2018 Apergy. All rights reserved.Growth Accelerators That Drive Above Market Growth
Drive ESP Share Expansion Leveraging strong product / service offering with
1 established relationships to drive ESP share expansion
Artificial in Growing Basins
Lift
Capitalize on Rod Lift Capitalize on significant rod lift switching demand from
2 ESP / Gas Lift as decline rate stabilizes
Conversions
Continue Diamond Sciences High velocity innovation driving share, performance
3 Innovation leadership and widening technological moat
Drilling
Technologies
4 Expand Diamond Bearing
Patented superior technology that lowers cost of drilling
Adoption
Significantly Grow Digital Enhance customer safety and productivity through ‘fit for
Digital 5 purpose’ digital solutions
Offering
12 Copyright 2018 Apergy. All rights reserved.ESP Momentum in the Permian Basin
Well Completion Growth vs. ESP Growth Momentum
Apergy New Install Growth Permian Basin 1
200%
% Growth Since Q4 2016 199% 2017 actual ESP market growth: ~25% over
174%
2016
Δ of
+121% Apergy 2017 ESP growth: 75% growth
150%
131%
across all regions
116% • 131% growth in Permian, compared to
2
99% 55% growth in completions
100%
78% 2018 ESP growth continues at rapid pace
55%
62%
Leverage existing Apergy rod lift customer
50%
31%
41% relationships to drive ESP growth
28%
13% • Strong pent-up demand with pilots underway
that have potential to significantly impact top
0%
Q1-17 Q2-17 Q3-17 Q4-17 Q1-18 Q2-18 line growth
% New Apergy Install Change % Permian Completions Change
Source: EIA Drilling Productivity Report August 2018.
13 Copyright 2018 Apergy. All rights reserved. 1 Permian completion data as of August 2018.
2 Growth rate reflects growth in average installs and completions in Q4 ‘17 vs. average in Q4 ‘16.Leading Innovation in Diamond Sciences
Apergy Offering Cumulative Patents Issued Since 2008
Custom designed and manufactured drill bit inserts
673 702
Long-lasting diamond bearings 608
540
Drill Bit Inserts 477
401
267
166
96
53
22
Bearings
Drill Bit
14 Copyright 2018 Apergy. All rights reserved.Growth Momentum in Diamond Bearings
Leveraging diamond science in a natural adjacency Diamond Bearings 10-Year Revenue Trend
$30
Diamond bearings is a fast-growing product line
$25
• Provides higher load capability $20
• Allows designs without seals, less prone to failure
Millions
$15
$10
• Longer life with lower repair costs and longer repair $5
intervals $0
We lead the market in diamond bearings solutions
through broad product line and patent portfolio
We expect to see continued adoption in downhole Diamond Thrust and Radial Bearings
applications, chemical mixing, and applications beyond
oil & gas
Focus on driving growth and setting industry standard
for diamond bearings
15 Copyright 2018 Apergy. All rights reserved.
Source: U.S. Synthetic.Broad Portfolio of Digital Products & Solutions That
Enhance Customer Safety & Productivity
ESP LOOKOUT™ Monitoring Gas Lift Automation Asset Integrity Management
24/7 ESP monitoring by exception Modified Turner Critical Velocity
program to reduce failures Calculation - Adjusts Gas Injection
Bi-weekly optimization program Rate as well conditions change by
with operator, reviewing each well & leveraging wellhead readings in flow Reciprocating, rotating and vibrating
providing operating recommendations correlation equations equipment monitoring and analysis
Best-in-class service and • Next-generation IIoT solution that
response time Bloodhound Method - Adjusts Gas provides intuitive infrastructure
Injection Rate to seek a rate that • Insights and predictions to
yields maximum Bottom Hole optimize output, minimize risks
Pressure Drawdown (Leverages RT DH and reduce unplanned downtime
Gauge readings)
Remote and portable analyzers and
online monitoring
16 Copyright 2018 Apergy. All rights reserved.Financial Overview Copyright 2018 Apergy. All rights reserved.
Strong Performance Through The Cycle
($ in millions)
$1,531
$1,358
$1,077 $1,175
$1,010
Revenue &
$751 2014 – 2016 revenue
Growth Rate decline lowest among peers
2013 2014 2015 2016 2017 2018F
8% 13% (30%) (30%) 34% 16%
$412 $439 Resilient industry-leading
Adjusted $230 $218
$280 1 margins
EBITDA $117
& Margin − 2013–2018 average margin
2013 2014 2015 2016 2017 2018F of 23% vs. 16% peer median
30% 29% 21% 16% 22% 24%
Note: Adjusted EBITDA is a non-GAAP measure. Please see the appendix for reconciliations to the most directly comparable GAAP measure. Peers include Baker Hughes GE, Core Labs, Dril-Quip, Flotek, Forum Energy, Gardner
Denver, Halliburton, Hunting, National Oilwell Varco, Oil States, Schlumberger, Schoeller-Bleckmann, Superior Energy Services, and Weatherford.
1 Apergy is unable, without unreasonable efforts, to provide a quantitative reconciliation of non-GAAP projections of 2018 adjusted EBITDA because net income or loss and income taxes cannot be estimated as a result of the level
of unpredictability and uncertainty associated with these items. For these same reasons, Apergy is unable to assess the probable significance of these excluded items.
18 Copyright 2018 Apergy. All rights reserved.Efficient Capital Structure and Capital Allocation
Strong Balance Sheet Disciplined Capital Allocation Priorities
June 30,
$ in Millions Organic growth investments
2018
Continued funding of research and
Cash $31 development
Productivity improvements
Total Debt 1 $707 Reducing debt and leverage
Selective acquisitions to expand our
Total Debt / EBITDA 2 2.8x technology and product portfolio and
broaden geographic reach
Available Liquidity 3 $272
Strong balance sheet to support strategic objectives and maintain financial flexibility through the cycle
1 Represents indebtedness including original issue discount and deferred financing costs.
2 As defined in Apergy’s credit agreement dated May 9, 2018.
3 Available liquidity defined as $241.5 million available but undrawn capacity under Apergy’s revolving credit facility plus $30.8 million in cash
and cash equivalents as of June 30, 2018. At June 30, 2018, Apergy had $8.5 million of outstanding letters of credit.
19 Copyright 2018 Apergy. All rights reserved.Strong Investment Thesis
Leading equipment and digital technology provider to the upstream oil and gas industry
Industry leadership with portfolio of trusted brands with reputation for quality, performance and service
Substantial presence in growing basins, segments and regions with >80% of revenue in North America
Capitalizing on increasing customer adoption of digital solutions to drive wellsite productivity
Proven business model and operating philosophy with strong relative performance across cycles, including
industry leading margins and stable FCF generation
Flexible balance sheet
Returns-focused capital allocation strategy with track record of organic and inorganic growth
Executive management team with proven track record of success
WE ARE APERGY…
Unlocking energy to drive value for our customers, employees and shareholders
20 Copyright 2018 Apergy. All rights reserved.Appendix Copyright 2018 Apergy. All rights reserved.
Summary Segment Financial Metrics
     ($ in millions)
                                                                                Revenue                                                          Adj. Segment EBITDA & Margin %

                                                      $912                                                         $858                              $191
                                                                                                $782                                                                                                              $165
                                                                          $638                                                                                                               $142
          Production &                                                                                                                                                    $98
           Automation                                                                                                                                  21%
                                                                                                                                                                                               18%                  19%
                                                                                                                                                                           15%
          Technologies
                                                      2015                2016                  2017           LTM Q2-18                             2015                2016                2017            LTM Q2-18

                                                                                                                   $255
                                                                                                $228                                                                                                               $97
                                                                                                                                                                                               $86
                                                      $164
             Drilling                                                     $113                                                                        $46
          Technologies                                                                                                                                                    $23                  38%                  38%
                                                                                                                                                       28%
                                                                                                                                                                           20%

                                                      2015                2016                  2017           LTM Q2-18                             2015                2016                2017            LTM Q2-18

     Note: Adjusted Segment EBITDA is a non-GAAP measure calculated by adding back depreciation and amortization expense and restructuring charges to segment earnings. Please see appendix for reconciliation to the most directly
     comparable GAAP measure.

22                                                               Copyright 2018 Apergy. All rights reserved.
Reconciliation from Net Income to Adjusted EBITDA
($ in millions)
2013 2014 2015 2016 2017
Net income (loss) attributable to Apergy $217 $223 $52 ($13) $111
+ Net income attributable to noncontrolling interest 1 1 1 2 1
+ Interest expense, net (0) 0 1 0 0
+ Provision for (benefit from) income taxes 103 110 24 (8) (22)
+ Depreciation and amortization 77 89 120 112 112
+ Restructuring and other charges 0 3 21 15 7
+ Royalty expense 17 18 10 7 10
Adjusted EBITDA 1 $412 $439 $230 $117 $218
Note: Totals may not foot due to rounding.
1. Adjusted EBITDA, a non-GAAP measure, is defined as net earnings (loss) excluding, income taxes, depreciation and amortization, interest expense, restructuring and other charges, and royalty expense.
23 Copyright 2018 Apergy. All rights reserved.Reconciliation from Net Income to Adjusted EBITDA
($ in millions)
Q1-17 Q2-17 Q1-18 Q2-18
Net income (loss) attributable to Apergy $13 $19 $25 $22
+ Net income (loss) attributable to noncontrolling interest 0 0 0 (0)
+ Interest expense 0 0 0 6
+ Provision for (benefit from) income taxes 6 9 7 9
+ Depreciation and amortization 27 27 30 32
+ Separation and supplemental benefit costs 0 0 0 5
+ Restructuring and other charges 0 0 0 2
+ Royalty expense 2 3 2 0
Adjusted EBITDA 1 $49 $57 $64 $77
Note: Totals may not foot due to rounding.
1. Adjusted EBITDA, a non-GAAP measure, is defined as net earnings (loss) excluding, income taxes, depreciation and amortization, interest expense, separation and supplemental benefit costs, restructuring and other charges, and
royalty expense.
24 Copyright 2018 Apergy. All rights reserved.Reconciliation from Segment Earnings to Adj. Segment
EBITDA
($ in millions)
Production & Automation Technologies 2015 2016 2017
Operating profit $58 ($22) $25
+ Depreciation and amortization 104 100 100
+ Restructuring and other charges 19 13 7
+ Royalty expense 10 7 10
Adjusted segment EBITDA 1 $191 $98 $142
Drilling Technologies 2015 2016 2017
Operating profit $27 $8 $74
+ Depreciation and amortization 16 12 12
+ Restructuring and other charges 2 2 0
1
Adjusted segment EBITDA $46 $23 $86
Note: Totals may not foot due to rounding.
1. Adjusted segment EBITDA, a non-GAAP measure, is calculated by adding back deprecation and amortization expense, restructuring and other charges, and royalty expense to segment earnings (loss).
25 Copyright 2018 Apergy. All rights reserved.Reconciliation from Segment Earnings to Adj. Segment
EBITDA
($ in millions)
Production & Automation Technologies Q1-17 Q2-17 Q1-18 Q2-18
Operating profit $8 $10 $10 $23
+ Depreciation and amortization 24 24 27 29
+ Restructuring and other charges 0 0 0 2
+ Royalty expense 2 3 2 0
Adjusted Segment EBITDA $34 $37 $40 $54
Drilling Technologies Q1-17 Q2-17 Q1-18 Q2-18
Operating profit $15 $20 $24 $21
+ Depreciation and amortization 3 3 3 3
+ Restructuring and other charges 0 0 0 0
Adjusted segment EBITDA $18 $23 $27 $24
Note: Totals may not foot due to rounding.
1. Adjusted segment EBITDA, a non-GAAP measure, is calculated by adding back deprecation and amortization expense, restructuring and other charges, and royalty expense to segment earnings (loss).
26 Copyright 2018 Apergy. All rights reserved.You can also read