Barclays CEO Energy-Power Conference Presentation September 6, 2018

Page created by Arthur Holmes
 
CONTINUE READING
Barclays CEO Energy-Power Conference Presentation September 6, 2018
Barclays CEO Energy-Power Conference Presentation
September 6, 2018
Barclays CEO Energy-Power Conference Presentation September 6, 2018
Disclaimer

Forward-Looking Statements

The information in this presentation includes “forward-looking statements.” All statements, other than statements of historical fact included in this presentation,
regarding our management, strategy, future operations, financial position, estimated revenues and losses, projected costs, prospects, plans and objectives of
management are forward-looking statements. When used in this presentation, the words “could,” “believe,” “anticipate,” “intend,” “estimate,” “expect,” “project”
and similar expressions are intended to identify forward-looking statements, although not all forward-looking statements contain such identifying words. These
forward-looking statements are based on Solaris’ current expectations and assumptions about future events and are based on currently available information as to
the outcome and timing of future events. When considering forward-looking statements, you should keep in mind the risk factors and other cautionary statements
described under the heading “Risk Factors” included in Solaris’ Annual Report on Form 10-K filed with the Securities and Exchange Commission on May 6, 2018
and subsequent Quarterly Reports, including the From 10-1 filed with the Securities and Exchange Commission on August 1, 2018. We caution you that these
forward-looking statements are subject to all of the risks and uncertainties, most of which are difficult to predict and many of which are beyond our control, incident
to the transportation, storage and delivery of proppant. These risks include, but are not limited to, the level of domestic capital spending by the oil and natural gas
industry natural or man-made disasters and other external events that may disrupt our manufacturing operations, volatility of oil and natural gas prices, changes in
general economic and geopolitical conditions, large or multiple customer defaults including defaults resulting from actual or potential insolvencies, technological
advancements in well service technologies, competitive conditions in our industry, our ability to fully protect our intellectual property rights and changes in the
long-term supply of and demand for oil and natural gas. Should one or more of these risks or uncertainties occur, or should underlying assumptions prove incorrect,
our actual results and plans could differ materially from those expressed in any forward-looking statements.

You are cautioned not to place undue reliance on any forward-looking statements, which speak only as of the date of this presentation. Except as otherwise required
by applicable law, we disclaim any duty to update and do not intend to update any forward-looking statements, all of which are expressly qualified by the statements
in this section, to reflect events or circumstances after the date of this presentation.

This presentation includes financial measures that are not presented in accordance with generally accepted accounting principles ("GAAP"), including EBITDA and
Adjusted EBITDA. While management believes such measures are useful for investors, they do not have any standardized meaning and are therefore unlikely to be
comparable to similar measures presented by other companies. The presentation of non-GAAP financial measures should not be used as a replacement for, and
should not be considered in isolation from, financial measures that are in accordance with GAAP. Please see the Appendix for reconciliations of those measures to
comparable GAAP measures.

Industry and Market Data

This presentation has been prepared by Solaris and includes market data and other statistical information from third-party sources, including independent industry
publications, government publications or other published independent sources. Although Solaris believes these third-party sources are reliable as of their respective
dates, Solaris has not independently verified the accuracy or completeness of this information. Some data are also based on the Solaris’s good faith estimates, which
are derived from its review of internal sources as well as the third-party sources described above.

Trademarks and Logos

Solaris owns or has rights to various trademarks, service marks and trade names that is uses in connection with the operation of its business. This presentation also
contains trademarks, service marks and trade names of third parties, which are the property of their respective owners. Solaris’ use or display of third parties’
trademarks, service marks, trade names or products in this presentation is not intended to and does not imply, a relationship with Solaris or an endorsement or
sponsorship by or of Solaris. Solely for convenience, the trademarks, service marks and trade names referred to in this presentation may appear without the ©, TM
or SM symbols, but the omission of such references is not intended to indicate, in any way, that Solaris will not assert, to the fullest extent under applicable law, its
rights or the right of the applicable owner of these trademarks, service marks and trade names.                                                                          1
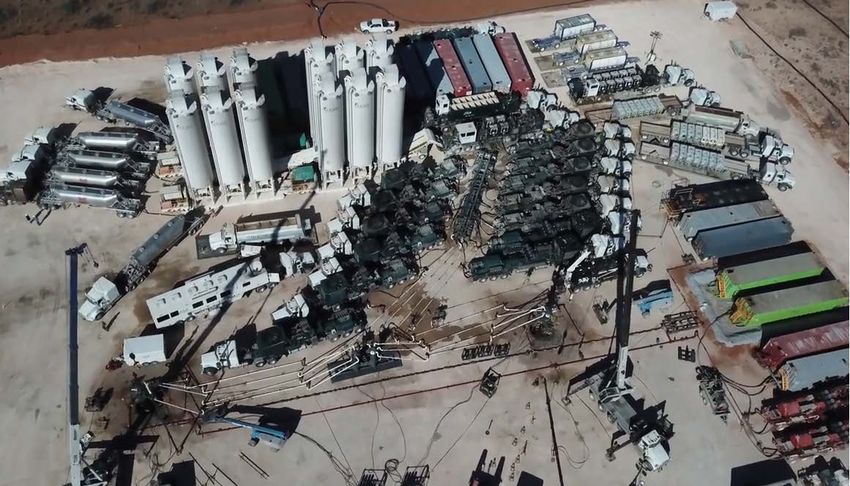
Barclays CEO Energy-Power Conference Presentation September 6, 2018
Company Snapshot

  Ticker                                                    SOI (NYSE)

  IPO Date                                                 May 11, 2017
  Market Cap                                               ~$800 million
  Long-term Debt                                           $0.0 million
  2019 Consensus
                                                               4.3x
  EV/EBITDA Multiple(2)
  2019 Consensus FCF
                                                                  11%
  Yield(2)

Ownership (1)                                                              EBITDA Growth (2)

                                                                           in $ millions                     $1 2 6

                                               Management
                                                  1 7%

                     Float 54 %                        Yorktown
                                                         23%
                                                                                                      $4 0

                                                   Other                                       $7
                                                    6%                               $2

                                                                                    2015       2016   2017   2018E
(1)   As of August 30, 2018
(2)   2018E reflects Consensus FACTSET estimates
                                                                                                                      2
Barclays CEO Energy-Power Conference Presentation September 6, 2018
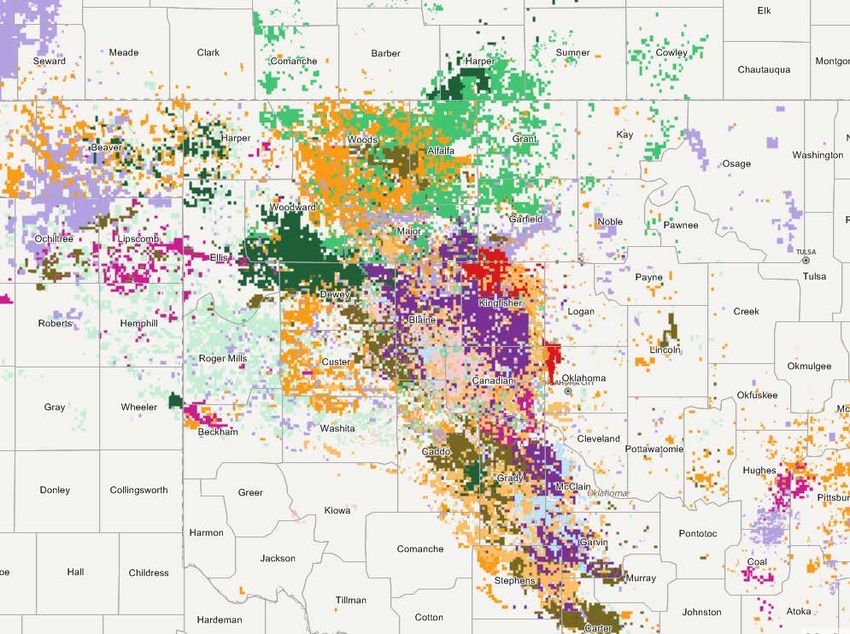
Leading Independent Provider of Well Site Logistics
Solutions
Leading Well Site Storage and Delivery Systems                          Digitalizing the Supply Chain
                                                                           Drive supply chain efficiencies through real time, remote
                                                                            monitoring of proppant inventory across supply chain:
                                                                              PropView® and Railtronix™

   Fleet of 138 Mobile Proppant Management Systems that address        Kingfisher Transload Facility
    challenges related to the transportation, storage and delivery of      High-capacity, unit train capable transload facility in
    proppant                                                                Kingfisher, Oklahoma supporting STACK/SCOOP
      Manufacturing capacity of up to 8 systems per month                    Underpinned with seven-year contract with leading
                                                                               STACK E&P operator
   Manufacture and rent Systems directly to leading E&P operators
    and pressure pumpers

      >95% of fleet deployed to customers with multiple Systems

      Blue-chip, diverse customer mix, including leading E&P
       companies and pressure pumpers

                                                                                                                                        3
Barclays CEO Energy-Power Conference Presentation September 6, 2018
Solaris Has A Culture And History Of Innovation

          Number of Systems in Fleet                                                                                   May-2018
                                                                                   Q1-2017                             Reconciling
          Key Events                                                             Urethane Fill                      Solution Deployed
                                                  Oct-2015
                                                 PropViewTM                     Pipe Extension
          WTI Price
                                                                                   Deployed                   Jan-2018
                                                Beta Deployed                                                   Non-
                                                                         Q4-2016                              pneumatic
                                     Jul-2015                                                                 Deployed
                                                                        Repurchased
                                    First 12-pack
                                                                             and
                                      Deployed                                                          Dec-2017
                                                                         Upgraded
                                                                        sold Systems                    Railtronix
                             May-2015                                                                   Acquisition
                            First Central
                                                                   Sep-2016
                             Conveyer                                                            Aug-2017
                                                                  PropViewTM
                             Belt Built                                                          Kingfisher
                                                                  Mobile App
                                                                                                  Ground
                                                                   Deployed
               Mar-2015                                                                           Breaking
            Redesigned Control
                                                            Apr-2016                     May-2017
              System Using
                                                              Dual                        IPO on
              Allen-Bradley
                                                            Discharge                      NYSE
                                                            Deployed
           Sep-2014
          Acquisition of
          Manufacturing                                Feb-2016
          Facility and IP                               System
                                                        Tarping
                                                       Deployed
 April-2014
    License
Agreement with
   Loadcraft

            Solaris’ Has the Culture and Team to Constantly Improve Product and Service Offering
                                                                                                                                        4
Barclays CEO Energy-Power Conference Presentation September 6, 2018
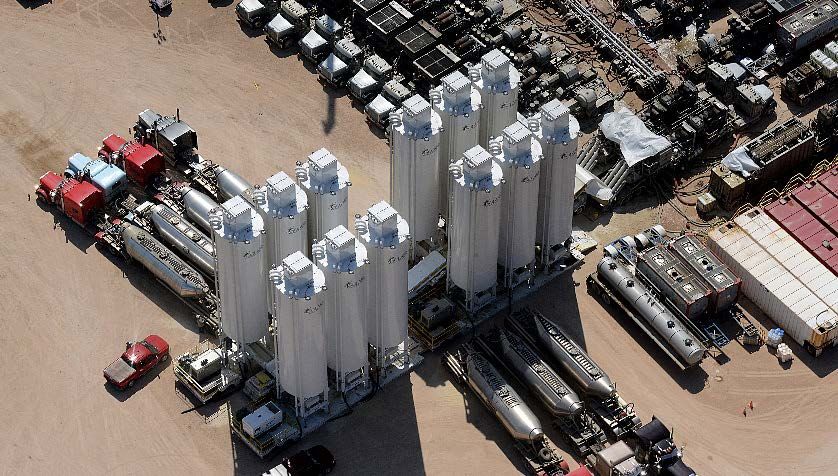
Solaris Active Across Lower-48

                      Solaris Currently has 138 Systems Operating Across Eight Basins

                                                                                        MARCELLUS / UTICA
       ROCKIES

                                                                                                   9

  0         1
                                                                                            1

                                                                                          SCOOP/STACK

   DELAWARE                                                                                        18

                                                                                           3

            40
                                                                                            BARNETT
                              MIDLAND

                                                                        EAGLE FORD         0        1
                                  25
                                  27
   9
                                                                                 35
                                                                                          HAYNESVILLE
                         13
                         22

                                                                                                   9
                                                                           9                2
  Systems at IPO (May 11, 2017)         Systems as of August 30, 2018

                                                                                                        5
Barclays CEO Energy-Power Conference Presentation September 6, 2018
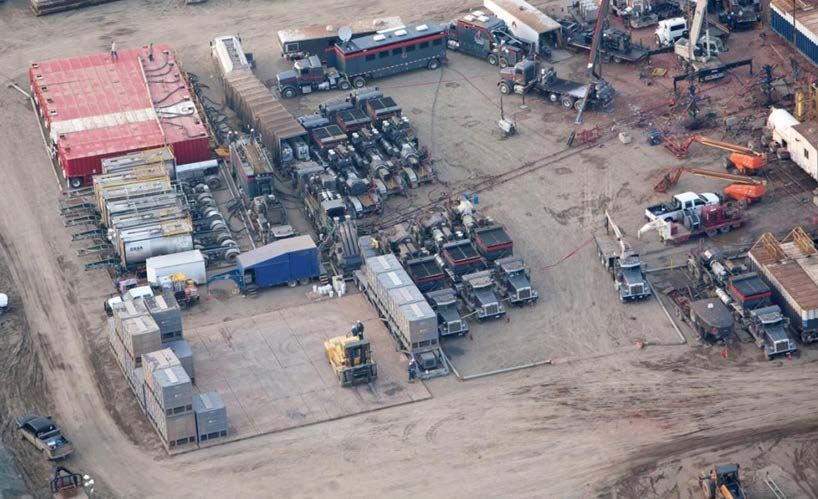
Diverse, Blue Chip Operator and Pressure Pumper
Customer Base

       Select Operator Customers                  Select Pressure Pumping Customers

                     Solaris has a broad and growing customer mix
                                                                                      6
Barclays CEO Energy-Power Conference Presentation September 6, 2018
Growth Driven by Overall Market Growth
Combined with Technology Displacement
                                                                                                                   Well Site Sand Storage Systems by
Increasing Sand Intensity Levels Are Pervasive                                                                     Technology Type (1)

MM Lbs                                                                                              MM Tons           Traditional SandKing   Traditional SandKing
                                                                                                                                             technology has lost
  14                                                                                                          30                             share to boxes and
                    Total Proppant Demand (MM tons)                                                                   Other New Technologies silos, with Solaris’
                                                                                                                                             systems having the
                    Proppant per Well (MM lbs)                                                                                               fastest market
  12                                                                                                                  SOI
                                                                                                              25                             adoption rate
                                                                                                                       519
 10
                                                                                                              20
                                                                                                                                                       ~450
   8                                                                                                                                           399
                                                                                                              15                                       25%
   6                                                                                                                           314

                                                                                                              10                       253
   4
                                                                                                                                                       45%
                                                                                                              5
   2

   0                                                                                                          0                                        30%
         1Q14

         4Q14

         1Q16

         4Q16

         1Q18
         1Q15

         4Q15

         1Q17

         4Q17
         3Q14

         3Q16
         3Q15

         3Q17
         2Q14

         2Q16

         2Q18
         2Q15

         2Q17

Source: Company data, Coras Research                                                                                 Dec-14 Dec-15 Dec-16 Dec-17 Current
(1) Reflects estimated marketed US Frac fleet count to approximate number of well site sand storage systems

                                                                                                                                                               7
Barclays CEO Energy-Power Conference Presentation September 6, 2018
Bringing Order to Chaos:
Solaris Versus Traditional Technology
                                    Issues with Traditional Offerings

   Inadequate on-site
    inventory and offloading
                                     Traditional                         Rolling
    capacity                         Sand Kings                          Storage

   Complicated operations
    and expansive well site
    footprint

   Opaque inventory
    information and limited
    communication

   HS&E issues, including
    silica dust

                                           Our Solution

                               Solaris’ Mobile Proppant Management System

   Supply chain buffer
                                                              Solaris’
   Greater storage and                                       Solution
    proppant accessibility
   More accessible
    unloading points
   Enclosed system with
    fewer moving parts and
    dust suppression
   Efficient use of space
   Fully automated
   Real-time data
                                                                                   8
Barclays CEO Energy-Power Conference Presentation September 6, 2018
Elegant Solution to a Complicated Problem

                                                                            High Capacity Throughput
   Simple, modern, fully-integrated control system
   High volume input and output capacity
   Mobile and flexible equipment
     Supply Chain Savings                  Well Site Savings

      Increased on-site inventory /       Increased inventory stage
      access to inventory                 execution efficiency

                                          Built-in dust control
      Increased truck offloading points

                                          Lower labor requirements
      Smaller truck fleet size required
      to deliver proppant
                                          Proppant inventory loss savings
      Decreased truck demurrage
                                          Reduced fuel requirements
      Real-time inventory levels and
      consumption rates                   Increased asset utilization

Seamless Rig-Up and Integration                                             Simultaneous Belly Dump and Pneumatic Loading

                                                                                             Belly Dump       Pneumatic
                                                                                               Truck            Truck

                                                                                                                          9
Proppant Logistics are Bottleneck Prone; In Basin
Sand Increases Need for Wellsite Inventory Buffer
                                                             Illustrative    Solaris Data                                                                  Illustrative
                                   Proppant Flow         20 MM lb Completion  Solution                                              Proppant Flow      20 MM lb Completion

                                                           ~10,000 tons of                                                                              ~10,000 tons of
                                       SAND MINE                sand                                                                    SAND MINE            sand

                                                                                            IN BASIN / REGIONAL SAND SUPPLY CHAIN
NORTHERN WHITE SAND SUPPLY CHAIN

                                                            ~100 railcars
                                     RAIL TO BASIN

                                                                                                                                       Lost buffer of inventory
                                                                                                                                       along the supply chain
                                                           ~10,000 tons of
                                       TRANSLOAD             throughput
                                    STORAGE FACILITY

                                    DELIVERY TO THE        ~400 truck loads                                                          DELIVERY TO THE    ~400 truck loads
                                                                               and
                                       WELLSITE                                PropView ®                                               WELLSITE

                                                          ~2.5 million lbs /                                                                            ~2.5 million lbs /
                                                             6 silos; or       PropView ®                                                                  6 silos; or
                                   WELLSITE STORAGE       ~5.0 million lbs /                                                        WELLSITE STORAGE    ~5.0 million lbs /
                                    AND DELIVERY               12 silos                                                              AND DELIVERY            12 silos

                                                     Solaris Provides Key Buffers and Data Along Supply Chain
                                                                                                                                                                         10
Value Proposition to Customers:
Trusted Solution and Low Cost Insurance Policy
Solaris System Costs
Our Patented Design

   Two issued patents; two utility patent applications and one provisional patent application relating to Systems, services and other technologies

Silo Loading and Delivery Process                                             Aerial View of System
                                                                              Generator            Dual Conveyor Belts                Generator
       Six to twelve silos per       Gravity              Silo
       System                                                                                                                                Silos
       Four fill tubes per silo

       2.5 to 5 million lbs of
       inventory available at the
       blender

                                                                            Base
                                                                            unit

                        ~50,000 pounds of
                      proppant per truckload

                                                                                     Shuttle                                   Blender
                             Shuttle Conveyor Belt                                Conveyor Belt
                                                                                  Electrically driven belts

                                                                                  Single point of control for the entire system
                                                                                                                                                  12
Digitalization of the Supply Chain
PropView®: Real-Time, Remotely Available Inventory Data
   PropView® provides real-time inventory levels, both at the well site and remotely via any browser or Solaris’ App.

                                                                                                                         13
Digitalization of the Supply Chain
PropView® + Railtronix™: Real-Time Inventory Data

   The Railtronix™ / PropView® integration provides real-time visibility of proppant from source mine to well head

                                                                                                                      14
Kingfisher Facility Fully Operational

New High-Capacity Transload Facility                       Long-Term Contract with Leading STACK E&P Operator

   The only independent, high-speed, unit-train capable      Seven-year agreement
    transload facility dedicated to the STACK/SCOOP
                                                              Minimum quarterly proppant volume commitment provides run-rate
   300 acres directly on the Union Pacific Railroad           annual revenue of $13 million
   Within 50 miles of 67 active horizontal rigs (1)          Rail-to-truck operations commenced January 2018; dedicated unit
                                                               train loop and 30,000 tons of silo storage commencing August 2018
   Began transloading service in January 2018

   Completed phase one construction in July 2018             Customer is a multi-basin Solaris Mobile Proppant Management
                                                               System customer
Central to Current STACK / SCOOP Rig Activity              Proximity to Operators’ Acreage Will Reduce Supply Chain Costs

                                    50 mile
                                     radius

                             100 mile                                                     50 mile
                              radius                                                       radius

                                                                               100 mile
          Legend                                                                radius

        Horizontal Oil Rig

Source: Baker Hughes North America Rotary Rig Count.       Source: 1Derrick.
(1)     Source: IHS Enerdeq, as of March 6, 2018.
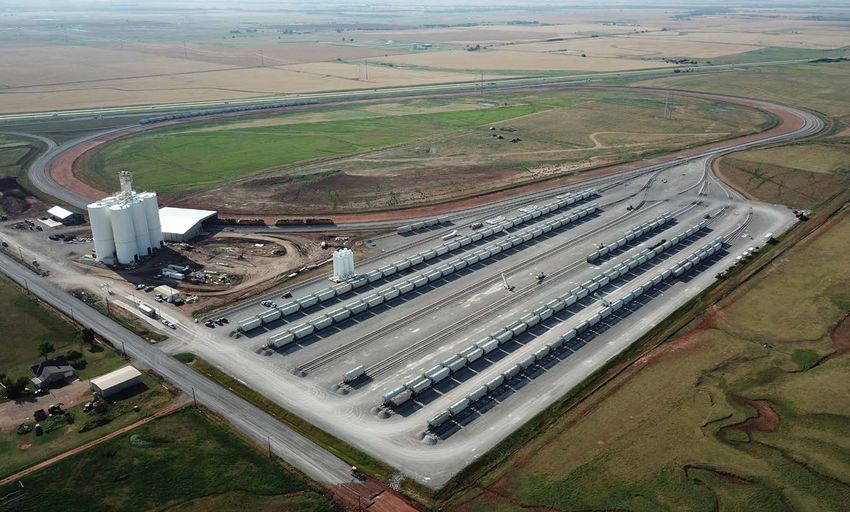
                                                                                                                              15
Kingfisher Facility Phase One Construction
Completed
300 Acres Central to the STACK/SCOOP Plays

    30,000 Tons of Storage                   Unit Train Loop

                             Manifest Loop

                                                               Rail-to-truck Service

                                                                                       16
Bringing Order to Chaos…Again
Solaris’ New Mobile Chemical Silo Systems
   Chemicals, acid, friction reducer, biocide, etc. stored in multiple totes and iso-containers today

   Replaced with 3 silos with inventory control and monitoring, precise flow measurement and improved HS&E

                                                                                                         Footprint will be
                                                                                                         reduced to three
                                                                                                         Solaris silos

                                                                                                                             17
Continued Growth in Solaris’ Financial Performance…

   Quarterly Revenue and Revenue Days ($ in Millions)       Q2 2018 Performance Commentary
                                                   $47 .2
                                                                2Q 2018 revenue and Adjusted EBITDA grew 31% and 37%,
                                                                 respectively, versus 1Q 2018
                                     $36.0
                                                                Growth in revenue and Adjusted EBITDA are primarily
                       $25.2                                     attributable to an increase in revenue days
          $1 8.5
                                                                 − 2Q 18 revenue days grew to 9,850, a 28% sequential
                                                                   increase

                                                                 − Average rental rates flat versus Q1 2018
          3Q 17        4Q 17         1Q 18         2Q 18        Added 24 systems to the fleet in 2Q 2018
Revenue    4,564       6,146         7,673
 Days:                                             9,850         − Ended quarter with 122 systems in fleet

   Quarterly Adjusted EBITDA and Margin ($ in Millions)     Capex ($ in Millions)

                                                  $30.0                             $49.9
                                                                                                                 $44.9
                                                                                                    $41 .2
                                    $21 .9

                      $1 5.2                                         $27 .6

          $1 1 .2

          3Q 17       4Q 17         1Q 18         2Q 18              3Q 17          4Q 17           1Q 18        2Q 18
                                                            Ending
Margin:     61%         60%           61%          64%       Fleet     59             77             98           122
                                                             Size:

                                                                                                                         18
…Driven by Sustained Margins Over Cycles and
Secular Growth

                                                                             100%                                                                         3 5,046           36,000
        Sy stem Rental and Service Gross Margin / Adjusted EBITDA Margin %

                                                                             90%

                                                                             80%
                                                                                                                              7 5%
                                                                                                                                                                            27,000
                                                                                                                                                        7 0%
                                                                             70%
                                                                                                              6 5%
                                                                                                                                                               62%
                                                                                    58%                                               59 %
                                                                             60%

                                                                                                                                                                                     Rev enue Days
                                                                             50%                                                 1 6 ,712                                   18,000

                                                                             40%                                     37 %

                                                                             30%
                                                                                                                                                                            9,000
                                                                             20%                                 5,745
                                                                                           1 2%
                                                                             10%      2 ,579

                                                                              0%                                                                                            -
                                                                                      2015                       2016             2017               Annualized 1H 2018

                                                                                     System Rental and Service Margin %     Adjusted EBITDA Margin               Revenue Days

                                                                                                                                                                            (1)

(1)   1H 2018 revenue days, gross margin and Adjusted EBITDA margin annualized.

                                                                                                                                                                                                     19
Drivers of Solaris Growth in 2018 and Beyond

       Leading well site storage and inventory management solution and continuing to grow, e.g.,
       manufacturing up to 8 systems per month

            Kingfisher Phase One completed July 2018. Opportunities to drive additional
            volumes through facility

              Continued integration and expansion of inventory management data solutions –
              expansion of Railtronix and PropView offerings

            R&D efforts to improve supply chain management and well site handling of other
            well site consumables, including chemicals, friction reducers, etc.

       Free cash flow generation in 2019…return to shareholders, fund continued growth and
       M&A activity

                                                                                               20
Appendix
EBITDA and Adjusted EBITDA Reconciliation

                                                                                    Three months ended,                                                                      Y ear ended
($ in 000s)                                        June 30, 2018         March 31, 2018           December 31, 2017        September 30, 2017 December 31, 2017 December 31, 2016 December 31, 2015

N et i ncome (l oss)                                         $21 ,448                $1 3,41 5                   $9,244                 $7 ,406               $22,487                    $2,803               $(1 ,37 3)
Depr eciation and amor tization                                                                                    2,359                  1 ,7 42                6,635                     3,7 92                 2,395
                                                               3,984                    3,202
Inter est expense, net                                                                                                26                      27                    97                        23                     22
                                                                  71                       84
                    (1)
Inc ome taxes                                                                                                    24,7 62                     61 7               25,899                        43                     67
                                                              3,27 7                  2,027
EBI TDA                                                     $28,780                 $18,728                    $36,391                  $9,792                $55,118                   $6,661                  $1,111
IPO b onuses (2)                                                                                                    581                      61 7                4,627                          -                        -
                                                                 307                      588
Stoc k -b ased c ompensation expense (3)                                                                          1 ,039                     7 95                2,21 1                     1 27                     64
                                                                 939                      925
                                   (4)
N on-r ec urring cash b onuses                                                                                         -                        -                      -                        -                        -
                                                                     -                  1 ,67 9
Loss on di sposal of assets                                                                                          47                       41                   498                          -                        -
                                                                   23                        3
N on-r ec urring organizational costs (5)                                                                              -                        -                  348                          -                        -
                                                                     -                        -
Change i n payables r elated to parties
                                                                                                                (22,939)                     (83)             (23,022)                          -                      --
pur suant to tax r eceivable agreement (6)                           -                        -
Sand mi ni ng and terminal business
                                                                     -                        -                        -                        -                      -                        -                   446
dev el opment c osts (7)
N on-r ec urring supplier settlement (8)                             -                        -                        -                        -                      -                        -                    38
         (9)
Other                                                                                                               1 07                      36                   1 43                         -                        -
                                                                  -                        -
Adjusted EBI TDA                                           $30,049                  $21,923                    $15,226                 $11,198               $39,923                    $6,788                 $1,659

EBI TDA and Adjusted EBI TDA
Margins:

EBITDA                                                      $28,7 80                 $1 8,7 28                  $36,391                  $9,7 92               $55,1 1 8                 $6,661                 $1 ,1 1 1
÷ Rev enue                                                                                                       25,204                  1 8,47 8               67 ,395                  1 8,1 57               1 4,205
                                                              47 ,1 55                 36,01 8
EBI TDA Margin                                                  61%                      52%                      144%                     53%                    82%                       37%                     8%

A djusted EBITDA                                            $30,049                  $21 ,923                   $1 5,226                $1 1 ,1 98             $39,923                   $6,7 88                $1 ,659
÷ Rev enue                                                                                                       25,204                  1 8,47 8               67 ,395                  1 8,1 57               1 4,205
                                                              47 ,1 55                 36,01 8
Adjusted EBI TDA Margin                                         64%                      61%                       60%                      61%                   59%                       37%                   12%

(1)            Income taxes include add back for federal and state taxes, including $22,637 in the three months and twelve months ended December 31, 2017 related to the Tax Cuts and Jobs Act.
(2)            Stock-based compensation expense related to restricted stock awards with one-year vesting that were granted to certain employees and consultants in connection with the Offering.
(3)            Represents stock-based compensation expense related to restricted stock awards with three-year vesting and options issued under the Plan.
(4)            Certain performance-based cash awards paid in connection with the purchase of Railtronix upon the achievement of certain financial milestones.
(5)            Certain non-recurring organization costs in 2017 associated with our IPO.
(6)            Other income related to the change in payables related to parties pursuant to the tax receivable agreement includes ($21,936) related to the Tax Cuts and Jobs Act.
(7)            Represents salaries and related expenses, professional fees, transactional costs, rent and travel expenses incurred in the development of sand mining and terminal assets, which expenses did not recur
               in 2016.
(8)            Represents reserve for deposits made to a supplier, the majority of which was recovered.
(9)            Non-recurring transaction costs.
                                                                                                                                                                                                                   22
System Rental and Service Gross Margin
  Reconciliation
                                              Six months ended                                  Year ended
($ in 000s)                                     June 30, 2018        December 31, 2017       December 31, 2016           December 31, 2015

System rental and service Revenue:
Proppant management system rental                          $62,532                 $54,653                  $14,594                    $8,296

Proppant management system services                         17,446                  12,537                    3,563                      3,167
Total system rental and service revenue                   $79,978                 $67,190                  $18,157                    $11,463

System rental and services operating costs:

Cost of proppant system rental                               3,101                   2,627                       1,431                       994

Cost of proppant system services                            20,785                  14,184                       4,916                   3,847
Total cost of system rental and services                  $23,886                 $16,811                   $6,347                     $4,841

System rental and service gross margin                    $56,092                 $50,379                  $11,810                     $6,622

System rental and service gross margin                     $56,092                 $50,379                  $11,810                    $6,622
÷ System rental and service revenue                         79,978                  67,190                   18,157                     11,463
System rental and service gross margin %                     70%                      75%                        65%                     58%

                                                                                                                                             23
Margins Driven By System Design and Protected by
High Switching Cost

                                                             High Switching Costs Relative to Savings from
           Margin Structure is Sustainable
                                                                     Potential Cheaper Solutions

Low Personnel Requirement                                   Risk of Switching is Material

    Solaris rents proprietary Systems, but we do not           Risk includes running out of sand or malfunctioning
     operate the Systems                                         equipment – causes delayed completions

    TRAIN, MAINTAIN, MOBILIZE                                     E&P companies: risk of higher well costs and
                                                                    delayed revenue

Low Maintenance Spend                                              Pressure pumpers: risk of fewer stages pumper per
                                                                    day
    Solaris’ equipment is not under pressure and has
     minimal moving parts
                                                            More Than Just a Silo
    Virtually 100% uptime with maintenance performed
     in the field                                               Customers rely on Solaris inventory data to manage
                                                                 entire supply chain

Economies of Scale                                              Alternative storage solutions not plug and play or
                                                                 comprehensive supply chain solution
    Solaris is the leading provider of next generation
     proppant well site storage and inventory management
     solutions (~30% market share today)

       Growing fleet at up to 8 systems / month

    Internal manufacturing model drives low
     manufacturing costs and ability to iterate on design
     modifications easily
                                                                                                                      24
Solaris System Versus Containerized Solutions

Solaris System on “Postage Stamp” Size Location                             Containerized System on Location

                                                                     Solaris System                          Containerized System

 Maximum Storage on Location                                        2.5 Million Pounds                          1.68 Million Pounds

 Implied Proppant Storage per Square Foot                              1,040 Pounds                                ~300 Pounds

 Well Site Equipment                                          6 Silos, 2 Base Units, 1 Conveyor    40 Boxes, Rig Mats, 1 Conveyor, Min. 1 Forklift

 Personnel Required to Operate Equipment                                      1                                        3–4

 Proppant Offloading Method                                            24 Fill Tubes                                 1 Forklift

 Truckloads Required to Complete a 25 Million Pound Well                    520                                        ~595

         Onsite Non-Truck Equipment Movements                                0                              ~2,380 Forklift Movements

         Frequency of Non-Truck Equipment Movements
                                                                            N/A                             Box Move Every 2.5 Minutes
         During Fracing Operations

                                                           Fewer People, Less Moving Parts, Dust
 HS&E Benefits                                                                                                    Dust Reduction
                                                                        Reduction

                                                                                                                                                     25
You can also read