RESULTS PRESENTATION 1Q21 Jan - Mar Madrid, 14th May 2021 - Grenergy

Page created by Steven Gross
 
CONTINUE READING
RESULTS PRESENTATION 1Q21 Jan - Mar Madrid, 14th May 2021 - Grenergy
RESULTS
PRESENTATION
1Q21 Jan - Mar
Madrid, 14th May 2021
RESULTS PRESENTATION 1Q21 Jan - Mar Madrid, 14th May 2021 - Grenergy
DISCLAIMER
   By attending this presentation and/or by accepting this presentation you will be                 cial condition or results of operations by the Company and should not be relied upon
   taken to have represented, warranted and undertaken that you have read and                       when making an investment decision. Certain financial and statistical information in this
   agree to comply with the contents of this disclaimer.                                            document has been subject to rounding off adjustments. Accordingly, the sum of
   The information contained in this presentation (“Presentation”) has been prepared by             certain data may not conform to the expressed total.
   Grenergy Renovables S.A. (the “Company”) and has not been independently verified and              Certain statements in this Presentation may be forward-looking. By their nature,
   will not be updated. No representation, warranty or undertaking, express or implied, is          forward-looking statements involve a number of risks, uncertainties and assumptions
   made as to, and no reliance should be placed on, the fairness, accuracy, completeness or         which could cause actual results or events to differ materially from those expressed or
   correctness of the information or opinions contained herein and nothing in this Presenta-        implied by the forward-looking statements. These include, among other factors, chan-
   tion is, or shall be relied upon as, a promise or representation. Neither the the Company        ging economic, business or other market conditions, changing political conditions and
   nor any of its employees, officers, directors, advisers, representatives, agents or affiliates     the prospects for growth anticipated by the Company’s management. These and other
   shall have any liability whatsoever (in negligence or otherwise, whether direct or indirect,     factors could adversely affect the outcome and financial effects of the plans and events
   under contract, tort or otherwise) for any loss howsoever arising from any use of this           described herein. Any forward-looking statements contained in this Presentation and
   Presentation or its contents or otherwise arising in connection with this Presentation.          based upon past trends or activities should not be taken as a representation that such
   This Presentation is for information purposes only and is incomplete without reference           trends or activities will continue in the future. The Company does not undertake any
   to, and should be viewed solely in conjunction with, the Company’s publicly available            obligation to update or revise any forward-looking statements, whether as a result of
   information and, if applicable, the oral briefing provided by the Company. The informa-           new information, future events or otherwise.
   tion and opinions in this presentation are provided as at the date hereof and subject to         The market and industry data and forecasts that may be included in this Presentation
   change without notice. It is not the intention to provide, and you may not rely on these         were obtained from internal surveys, estimates, experts and studies, where appropriate
   materials as providing, a complete or comprehensive analysis of the Company’s finan-              as well as external market research, publicly available information and industry publica-
   cial or trading position or prospects.                                                           tions. The Company, it affiliates, directors, officers, advisors and employees have not
   This Presentation does not constitute investment, legal, accounting, regulatory, taxation or     independently verified the accuracy of any such market and industry data and forecasts
                                                                                                    and make no representations or warranties in relation thereto. Such data and forecasts
   other advice and does not take into account your investment objectives or legal, accoun-
                                                                                                    are included herein for information purposes only. Accordingly, undue reliance should
   ting, regulatory, taxation or financial situation or particular needs. You are solely responsi-
                                                                                                    not be placed on any of the industry or market data contained in this Presentation.
   ble for forming your own opinions and conclusions on such matters and for making your
   own independent assessment of the Company. You are solely responsible for seeking                The distribution of this Presentation in other jurisdictions may be restricted by law and
   independent professional advice in relation to the Company. No responsibility or liability is    persons into whose possession this presentation comes should inform themselves about
   accepted by any person for any of the information or for any action taken by you or any          and observe any such restrictions.
   of your officers, employees, agents or associates on the basis of such information.               NEITHER THIS PRESENTATION NOR ANY OF THE INFORMATION CONTAINED HEREIN
   This Presentation contains financial information regarding the businesses and assets of           CONSTITUTES AN OFFER OF PURCHASE, SALE OR EXCHANGE, NOR A REQUEST FOR
   the Company. Such financial information may not have been audited, reviewed or                    AN OFFER OF PURCHASE, SALE OR EXCHANGE OF SECURITIES, OR ANY ADVICE OR
   verified by any independent accounting firm. The inclusion of such financial information            RECOMMENDATION WITH RESPECT TO SUCH SECURITIES.
   in this Presentation or any related presentation should not be regarded as a representa-         The securities of the Company may not be offered or sold in the United States of Ameri-
   tion or warranty by the Company, its affiliates, advisors or representatives or any other         ca except pursuant to an effective registration statement under the Securities Act of
   person as to the accuracy or completeness of such information’s portrayal of the finan-                             1933 or pursuant to a valid exemption from registration                   01
RESULTS PRESENTATION 1Q21 Jan - Mar Madrid, 14th May 2021 - Grenergy
KEY HIGHLIGHTS

                   FINANCIAL                                                         OPERATIONAL
                                                                                                                                   ESG
                 PERFORMANCE                                                          EXECUTION

      € 105M capital increase to secure our
                 capital needs                                                       Total pipeline of 6.1GW
                                                                                                                        ESG action plan 2021 on track
                Leverage reduced to 3.1x
                                1                                                     198MWs in Operation

                 1Q21 Net Profit of 0.4M€                                          417MWs Under Construction                  Just published our
                        EBITDA of 1.8M€                                                 448MWs Backlog                   Sustainability report 2020

                                                                              >1 GW of projects either in operation,
                      Revenue of 18.7M€                                             construction or backlog            Carbon Footprint and reduction
                   Energy sales of 3.1M€                                                                                     targets disclosed
                                                                                2.9GW Advanced Development

                                                                                                                                                        02
1 Leverage calculated as Net debt divided by last 12m EBITDA (20€ for 1Q21)
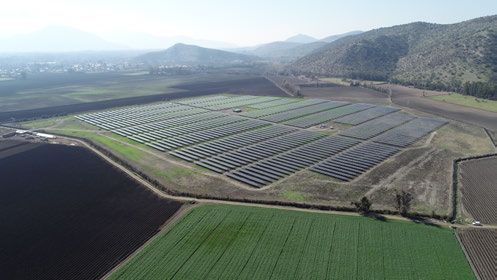
RESULTS PRESENTATION 1Q21 Jan - Mar Madrid, 14th May 2021 - Grenergy
INDEX

        1
        FINANCIAL RESULTS

        2
        PIPELINE & OPERATIONS

        3
        ESG

                                03
RESULTS PRESENTATION 1Q21 Jan - Mar Madrid, 14th May 2021 - Grenergy
1 RESULTS
 FINANCIAL
RESULTS PRESENTATION 1Q21 Jan - Mar Madrid, 14th May 2021 - Grenergy
REVENUE 1Q21
                                                                           Total Revenue +18.7M€

                            1Q20 Revenue                                                                                               1Q21 Revenue

                                              0.4
                                                                                   1Q21 vs 1Q20; €M
                              0.0                            33.3
               32.9                                                                         +3.1M€
                                                                                  Energy division sales in 1Q 21
                                                                                                                                                  0.5
                                                                                             + 27%
                                                                                      Revenue increase in                               3.1                18.7
                                                                                       Services* division
                                                                                  D&C** revenue impacted by
                                                                                          seasonality.                          15.1
                                                                                    Reiterated B2S range of
                                                                                  100-200MW for next periods

               D&C           Energy        Services         Total                                                               D&C    Energy   Services   Total

                                                                                                                                                                   05
SOURCE: Company ı * Services includes O&M (Operation and Maintenance) and AM (Asset Management) ı ** Development and Construction
RESULTS PRESENTATION 1Q21 Jan - Mar Madrid, 14th May 2021 - Grenergy
EBITDA 1Q21
                                                                                  Total EBITDA +1.8M€

                                 1Q20 EBITDA                                                                                         1Q21 EBITDA

                                                                                           1Q21 vs 1Q20; €M
                          0.0           0.0                                                         +2.7M€
           6.5                                                                           Energy division EBITDA in 1Q 21
                                                      -0.9
                                                                                           D&C* EBITDA impacted by                          0.1
                                                                     5.6                         seasonality
                                                                                                                                                       -1.3
                                                                                            Reiterated B2S range of
                                                                                          100-200MW for next periods              2.7

                                                                                                                                                                  1.8

                                                                                                                           0.2
           D&C          Energy       Services     Corporate         Total                                                  D&C   Energy   Services   Corporate   Total

           29%                           1%                         24%                     EBITDA Margin1                 4%     88%       18%                  32%

                                       Solar and Wind projects producing EBITDA in the energy division
                                                                                                                                                                         06
SOURCE: Company ı 1 EBITDA Margin calculation just considering third party sales ı *D&C = Development & Construction
CAPEX 1Q21
                     Grenergy invested 33M€ in Solar PV and Wind projects under construction

                    €M

                                                                                     11.2

                                                                         3.6

                                                                                                  33.5
                                                           10.5

                                          3.7

                         4.4

                  Development Capex   Wind Project:    Wind Project:   Quillagua   Escuderos   Total Capex
                                        Kosten        Duna Huambos

                               Capex expected to grow with Escuderos ongoing construction
                                                                                                             07
SOURCE: Company
FREE CASH FLOW AT GROUP LEVEL 1Q21

              €M                                                                                                1.2
                                                                                                     13.7
                                                                                                                        109.7

                                                                                      105.0

                                    0.8           -1.3
                          1.8

                  20.6
                                                              -33.5

                                                                          1.5

                  Cash   EBITDA   Change in     Taxes and     Growth   Change in   Share Capital   Financial   Other   Cash 1Q21
                  FY20            operating     Financial     Capex    investing     Increase        debt      debts
                                     WK       Exp. Cash out               WK

                                                                                                                                   08
SOURCE: Company
CHANGE IN NET DEBT AND LEVERAGE
                                                    Overall leverage decrease to 3,1x Net Debt/EBITDA

                                                             Change in net debt                                                Leverage1
       €M                                                                                                               2019 Full year
                                                                                                                        1H20
                                                                                                                        FY20
                                                                                                              -61.2     1Q21

              -128.4                                                                        -5.2     -1.6                      5,4x 5,4x

                                                                                105.0
                                                                                                                                           3,1x

                                 1.2                                                                                    2,0x
                                                -33.7
                                                                  1.5

              2020          Funds from        Growth          Investing     Share Capital   IFRS16   Other     1Q21            ND/EBITDA
             Net Debt       Operations        Capex              WK           Increase                       Net Debt

                                             Successfully securing our capital needs with an ABB in 1Q21
                                                                                                                                                  09
SOURCE: Company ı 1 Leverage calculated as Net debt divided by last 12 moth EBITDA
SHARE CAPITAL INCREASE: USE OF PROCEEDS
                    Grenergy has successfully secured its capital needs with an ABB in 1Q21

     • Size of the deal: 105M€       • Admission to trading 22nd March 21           • Total Shares: 27,926,911         • 40% free float after the deal

                                                                            ABB Key figures:
                                              350-400M€
                                                                            • The book had c.50 lines with strong international demand.
                                 300-350M€
   Capex                                                                    • Long-only accounts represented the majority of the allocations, with the
Investment                                                                    top 10 allocations taking over 60% of the book.
                200-250M€
 ~ 1000 M€                                                                  • Largest equity offering by a Spanish-listed renewables company in 2021
                                                                              year-to-date.

                   2021            2022           2023                      This operation allows us:
                +500MWs          +800MWs      +1000MWs                      • To obtain the necessary funds for achieving our IPP targets &
                                                                              strengthening the organizational structure.
                     Sound financial structure                              • To accelerate our international expansion and pipeline of projects.
              • Project debt (85/15 structure)                              • To triple our equity balance and reduce total leverage.
  Capex       • Strong cash position (109M€, March 2021)                    • To increase share liquidity per day and let new international investors get
 Finance      • Funds from Operation from:                                    in as company shareholders.
                 · Service and Energy div. recurrent cash in                • To show management belief in our share by purchasing new shares in the
                 · Build and Sale secure income                               deal.

                                                                                                                                                            10
2   PIPELINE &
    OPERATIONS
PIPELINE UPDATE
      Project portfolio
                                                                                  Highly visible 6.1 GW pipeline

                    Estimated COD2                                                    Project Classification1 1Q21                                                                             6.0GW
                                                                                                                                                                                               FY20
           2025                                        < 50%                                             Early Stage
                                                                                                                                                                                             2,547MW
                                                    Success Rate                                          2,344MW                                                -203MW

           2024
                                                       > 50%                                   Advanced Development
                                                                                                                                                                                             2,839MW
                                                    Success Rate                                     2,869MW                                                     +30MW
           2023
                                                       > 80%                                                Backlog
                                                                                                                                                                                              353MW
                                                    Success Rate                                            448MW                                                +95MW

           2022                                                                                        Ready to Build

                                                                                                   Under Construction
                                                      > 100%                                            417MW                                                    +120MW                       297MW
                                                    Success Rate                                                                                                                              198MW
            2021                                                                                         In operation
                                                                                                            198MW

1
    This classification of the pipeline phases has been made by the company itself on the basis of its previous experience in projects carried out, using its own internal criteria and procedures.    12
2
    Commercial Operation Date
PIPELINE UPDATE
  Total pipeline increased by 1.6 GW YoY

                                            >1 GW of projects either in operation, construction or backlog

               SOLAR PV                                                                           WIND
                                                 Under               Advanced Early     Total                                Under             Advanced Early    Total
               MW                                Const     Backlog     Dev    Stage    pipeline   MW                         Const   Backlog     Dev    Stage   pipeline
                                    In                                                                              In
               Probability       Operation                                                        Probability    Operation
                                                  100%       80%       >50%    50%
PIPELINE UPDATE
  Projects Under Construction & Backlog

                     865MW to be commissioned in the next months with a strong contracted profile

                      Country                   Project                    Type    MW              B20         Resource        COD
                                                                                                                (Hours)

                      Chile                     Quillagua                  Solar   103             Yes           2,950         4Q20
                      Mexico                    San Miguel de Allende      Solar    35             Yes           2,300         1Q21
                      Peru                      Duna                       Wind     18             Yes           4,900         4Q20
                      Peru                      Huambos                    Wind     18             Yes           4,900         4Q20
                      Argentina                 Kosten                     Wind     24             Yes           5,033         1Q21
                      Total in Operation                                           198
                      España                    Escuderos                  Solar   200             Yes             2,128       3Q21
                      Chile                     PMGD (10 projects)         Solar   103             Yes         1,924-2,442   2Q21-4Q21
                      Chile                     PMGD (4 projects)          Solar    42             No          1,924-2,442   2Q21-4Q21
                      Colombia                  Distribution               Solar    72             Yes             1,957       4Q21
                      Total UC                                                     417    (Vs. 297 previous report)
                      España                    Belinchon                  Solar   150             Yes           2,150         3Q22
                      España                    Jose Cabrera               Solar   50              No            2,156         4Q22
                      Chile                     Quillagua2                 Solar    111            Yes           2,950         4Q21
                      Chile                     PMGD (6 projects)          Solar    61             Yes        2,000-2,734    4Q21-2Q22
                      Chile                     PMGD (6 projects)          Solar    64             No         2,000-2,734    4Q21-2Q22
                      Colombia                  Distribution (1 project)   Solar    12             Yes           1,990         4Q21
                      Total Backlog                                                448    (Vs. 353 previous report)
                                                                                                                                         14
SOURCE: Company ı COD: Commercial Operation Date 19
PIPELINE UPDATE
  Projects in Advanced Development

                   On track to deliver solid growth with 2.9 GW of projects in advanced development
                                 with a geographical and technological diversification
                                                                                            Resource
                           Country          Project                     Type     MW                           COD        Offtaker    Negotiation
                                                                                             (Hours)
                           España           Ayora                       Solar    172           2,212          4Q22     PPA 70-80%     Advanced
                           España           Tabernas                    Solar    300           2,358          4Q22     PPA 70-80%     Advanced
                           España           Tres Cantos                 Solar    575           2,000          2Q23     PPA 70-80%       Initial
                           Colombia         Distribution (5 projects)   Solar     58        1,915-1,957       4Q23     PPA 70-80%     Advanced
                           Colombia         Compostela                  Solar    120           2,079          1Q23     PPA 70-80%       Initial
                           Chile            PMGD (12 Projects)          Solar    120       2,200-2,700     4Q22-2Q23   PMGD Regime   Completed
                           Chile            Victor Jara                 Solar    240          2,800          2Q23        PPA 60%       Initial
                           Chile            Algarrobal                  Solar    240          2,800          3Q23        PPA 60%       Initial
                           Chile            Teno                        Solar    240          2,186           1Q23       PPA 60%        Initial
                           Chile            Gabriela                    Solar    264          2,800           4Q22       PPA 60%        Initial
                           Chile            Lawal                       Solar    100          2,200           1Q24       PPA 60%        Initial
                           Chile            Amanita                     Solar    35           2,000           2Q23       PPA 60%        Initial
                           Chile            Tamango                     Solar    45           2,000           2Q23       PPA 60%        Initial
                           Chile            PMGD (2 projects)           Wind      18          4,000           2Q23     PMGD Regime   Completed
                           Peru             Matarani                    Solar    80           2,750           4Q22       PPA 100%       Initial
                           Peru             Lupi                        Solar    150          2,900           4Q22       PPA 100%    In progress
                           Peru             Emma_Bayovar                Wind     72           4,000           4Q22      PPA 100%     In progress
                           Peru             Nairas                      Wind     40           5,100           4Q22      PPA 100%     In progress
                           Total                                                2,869   (Vs. 2,839 previous report)

                                                                                                                                                   15
SOURCE: Company ı COD: Commercial Operation Date
STRATEGY AND OPERATIONAL TARGETS - B20
  2021 IPP Projects on track - 500MW
                            200MW - ESCUDEROS Sola                                             72MW - 6 distribution proj
                                                     r PV                                                                ects
                             project under constructio                                            Under Construction
                                                      n                                          15 years PPA signed with Ce
                                 12 yerar PPA signed with GA                                                                lsia
                     Backlog 200MW - Belincho               LP                                       Ongoing PPA negotiations
                                             n and   Jose Cabrera RTB 4Q21

                                                           - 14 PMGD projects U nder Construction
                                                     145MW                     ancial negotiations
                                                                             ing fin
COD: Commercial Operation Date                           Backlog 236MW - Ongo r construction                                       16
SOURCE: Company                                                       2 projects unde
FOCUS - SOLAR PV CAPEX
                                                                Solar PV CAPEX evolution and 2022 estimates

                                     2020 Post Covid                          2021                        2022 Post CNY1           Tiers 1 Module capacities (GW)
                            EUR     Price W  Cost per MW              Price W   Cost per MW             Price W  Cost per MW
             Modules                0,193       193.000                0,20       200.000               0,180       180.000
                                                                                                                                                            2020       2021     2022
             Trackers               0,086        86.000               0,100       100.000               0,090        90.000           Longi                  24         45
             Inverters              0,040        40.000               0,040        40.000               0,038        38.000
                                                                                                                                      Jinko                  19         30
             Cable                  0,035        35.000                0,04        40.000               0,035        35.000
             Logistics              0,009         9.000               0,030        30.000               0,015        15.000           JA Solar               15         30
             Civil works            0,027        27.000               0,027        27.000               0,027        27.000

                                                                                                                                                                                Expected to continue growing in 2022
             Others BoP              0,01        10.000               0,013        13.000                0,01        10.000           Trina Solar            15         35
             Total                              400.000                           450.000                           395.000           Canadian Solar         11,3       20
             Exchage rate                          1,14                              1,21                             1,23
                                                                                                                                      Risen Energy           10         20
       2020 post Covid                                                                                                                Q Cell                 6,5         8
           • Covid affected positively to module prices, moving down from 0.25cts/$ to slightly below 0.20cts/$.
                                                                                                                                      First Solar            5,7        6,7
                    2021
                                                                                                                                      GCL-SI                 3,5         5
           • Module prices move back to 0.23/0.24 $. However, exchange rate moved from 1,14$/€ to current 1,21$/€,
             impacting positively to module cost in euros.                                                                            Rest                   44         44
           • Significant increase in logistics and steel commodity prices is affecting negatively to shipment cost and trackers.
                                                                                                                                                             154        244
         2022 Post CNY  1
                                                                                                                                                                       58%
           • IEA said that despite relatively high commodity and freight prices, it expects module prices to be lower at the
             end of 2021 than the average Chinese price in 2020, which was around 0.205 $ per watt.
           • Steel is expected to trade at 852 USD/MT (vs 912 USD/MT) by the end of this quarter, according to Trading             Total new Solar PV Installed capacity (GW)
             Economics global macro models and analysts' expectations. Looking forward, they estimate it to trade at 697
             USD/MT in 12 months time.                                                                                                IEA forecast           135        145     162
           • Freight cost expected to get smoothly down to preCOVID levels.
                                                                                                                                                                                                                       17
1
    Company estimate
3 ESG
 COMMITMENTS
ESG ACTION PLAN 2021
Q1 Progress Report
                                                                        • Comprised by Directors of IIRR, Legal, Services and Sustainability
                                                                        • Governed by Internal Rules
                                                                        • Reports to the Remunerations and Appointments Commission
                     CREATION OF THE SUSTAINABILITY COMMITTE
                                                                        • Approved by the Board of Directors
                     HARASSMENT GLOBAL POLICY
    GOVERNANCE                                                          • Includes a set of 6 sub-policies adapted to national legislation
                     PROCUREMENT POLICY Q3                              • Whistleblowing channel in place
                     HUMAN RIGHTS POLICY                                • Approved by the Board of Directors
                                                                        • International treaties, volunteer intiatives and internatioanl standards adopted
                                                                        • Whistleblowing channel in place
                     SUSTAINABILITY REPORT 2020 PUBLISHED
                                                                        • Sustainability report published
     ESG IN OUR      SDG CONTRIBUTION MEASURED                          • Section on contribution to SDGs and KPIs included
     STRATEGY
                     ESG RATING OBTAINED
                                                                         ESG Risk Rating                                 Ranking
                                                                                                                         INDUSTRY GROUP

                                                                           13.6                    Low Risk                                  5 out of 575
                                                                                                                           Utilities
     ESG RISK        ESG RISKS RE-EVALUATED Q2
   MANAGEMENT        MITIGATION MEASURES AND PLANS RE-ASSESED Q2                                                         SUBINDUSTRY

                                                                            Negl.   Low     Med.    High    Severe
                                                                                                                           Renewable Power
                                                                                                                           Production
                                                                                                                                             3   out of 68

                                                                            0-10    10-20   20-30   30-40    40+
                     GENDER EQUALITY ROADMAP Q2-Q4
                     SOCIAL ACTION PLAN Q2-Q4                           • Carbon footprint calculations aligned with GHG Protocol
    ESG IMPACTS
                     CARBON FOOTPRINT AND REDUCTION TARGETS DISCLOSED   • Independent verification obtained
                                                                        • Emmissions reduction targets set
                     SUSTAINABILITY TRAINING Q2

                     PROCEDURES FOR INTERNAL ESG REPORTING Q2
                                                                        • United Nations Global Compact signed
      ESG            GOBAL COMPACT SIGNED                               • Commitment to support human rights, labour, environment and
  COMMUNICATION                                                           anti-corruption principles
                     ESG COMMUNICATION PLAN Q2-Q4
                                                                                                                                                             19
CARBON FOOTPRINT 2020
Emissions reduction targets

                         CARBON FOOTPRINT                                  INDEPENDENT                                               EMISSIONS REDUCTION
                           CALCULATION                                     VERIFICATION                                                  TARGETS SET
                     New sources of scope 3                           Identification of sources and                          Reduce scope 1&2            Reach scope 1&2
                      emissions included to                                 calculations were                                   emissions                   emissions
                                                                         independently verified
                    comply with GHG Protocol

                         Scope 1&2: 421.61 tCO2                                              CO2e
                                                                                                                                55%                     Net zero
                                                                                             Assessed                        tCO2e/GWh
                         Scope 3: 67,458 tCO2e                                               Organisation
                                                                                                                                 by 2030                      by 2050

                                     EMISSIONS SOURCES MAP

                  SCOPE 3                                 SCOPE 1-2                                         SCOPE 3
         Supply chain              Construction      O&M                                      Corporate
           Sea freight              Subcontractor   Company               Office buildings                  Business trips
                                      machinery      vehicles
                                                                                                                                             REDUCTION STRATEGY
                                                                                                                                 • Renewable energy sources for own consumption
          Road freight                                                                                       Third party
                                       Waste                                                                  vehicles           • Energy efficiency opportunities identification
                                                                          Home-workers
                                                                                                                                 • Transition to clean corporate cars analysis

     Solar panels production                                                                                   Waste

                                                                                                                                                                                    20
SUSTAINABILITY REPORT 2020

                                    ranking                                                                        directors
                                                                             women
                                    #5
                             out of 595 companies
                                                                            33%                                  100%
                                                                                                            with variable compensation
                           ESG Rating Sustainalytics                    in Board of Directors                  linked to ESG targets

                           employees                      training                         workers                     people

                             192                        1.600hours
                                                                                        1.300
                                                                                     for the construction
                                                                                                                      150
                                                                                                                  with electrification
                           we grow 36%                  for employees                   of our projects              commitment

                            students                     donations                        meetings                  face masks
                                2
                         renewable energy
                                                   255.653€                                189
                                                                                           with local
                                                                                                               400.000
                                                           social                                                      donated
                        sponsored degrees                                                 community

                             projects                                                 green financing                 avoided
                                0
                                                        investment

                         in protected areas            614.124€                      96.7M€
                                                                                         Green Loan
                                                                                                            250.351 tCO2
                                                                                                                  emissions by our
                            by national or              environmental                 Principles aligned        projects built in 2020
                      international legislation

                                                                                                                                         21
APPENDICES
PLATFORM WITH RELEVANT GROWTH POTENTIAL
      Project Portfolio

                                                                                                         Project Classification1

                                                                              Early Stage                                   Projects with technical and financial feasibility:
                                < 50%                                                                                         • Possibilities to secure land and grid; and/or
                            Success Rate                                       2,344MW                                        • Possibilities to sell it to third parties

                                                                                                                            Projects with an advanced technical and financial stage:
                                > 50%                              Advanced Development                                       • +50% Probability to secure land; and/or
                            Success Rate                                 2,869MW                                              • +90% Probability to get grid access; and/or
                                                                                                                              • Environmental permits requested

                                                                                                                            Projects in a final phase before construction:
                                > 80%                                            Backlog                                      • Secured land and grid access; and/or
                                                                                                                              • +90% Probability to obtain environmental permits
                            Success Rate                                         448MW                                        • Off-take agreements, PPA, or bankable scheme of stabilized
                                                                                                                              prices secured / ready to be signed

                                                                            Ready to Build                               Ready to Build: Financing close, PPA in place or negotiation of EPC

                                                                        Under Construction                               Under Construction: EPC provider has been mandated to start
                               > 100%                                        417MW                                       construction works
                            Success Rate
                                                                             In operation                                In Operation: Project responsibility transferred from the EPC
                                                                                198MW                                    provider to the project operator

                                                                                                                                                                                                      23
1
    This classification of the pipeline phases has been made by the company itself on the basis of its previous experience in projects carried out, using its own infernal criteria and procedures.
1Q21 RESULTS
Profit and Losses

                    Solar and Wind projects producing EBITDA in the energy division
                               Profit and losses
                               (€k)                                            Q1 21     Q1 20     Delta
                               Revenue                                         18,701    33,278    (44%)
                                Income from customer sales                     9,856     22,838    (57%)
                                Income from related from third party sales     8,845     10,440    (15%)
                               Procurement                                   (13,808)   (24,108)   (43%)
                                Procurement from third parties                (4,963)   (13,668)   (64%)
                                Activated cost                                (8,845)   (10,440)   (15%)
                               Gross Margin                                  4,893       9,170      (47%)
                               Personnel expenses                            (2,015)    (1,318)      53%
                               Other incomes                                   512         11      4.555%
                               Other operating expenses                      (1,618)    (2,291)     (29%)
                               Other results                                   (15)        25      (160%)
                               EBITDA                                         1,757      5,597     (69%)
                               Depreciation and amortization                 (1,018)     (196)      419%
                               EBIT                                            739       5,401      -86%
                               Financial incomes                                26         15        n.m
                               Financial expenses                            (1,734)     (565)      207%
                               Exchange rate differences                      1,249      (979)     (228%)
                               Financial result                              (459)      (1,529)    (70%)
                               Result before taxes                            280        3,872      -93%
                               Income tax                                       111      (445)      -125%
                               Net Income                                      391       3,427      -89%
                                                                                                            24
1Q21 RESULTS
Balance Sheet              Balance Sheet
                           (€k)                                  31/03/21    31/12/20    Var.

                           Non-current assets                    209,762     169,499    40,263
                           Intangible assets                       9,298        9,143      155
                           Fixed asset                            178,769    144,768     34,001
                           Assets with right of use                 11,371     5,284     6,087
                           Deferred tax assets                     10,091      10,217     (126)
                           Other fix assets                          233          87       146
                           Current assets                        187,670     88,699      98,971
                           Inventories                            24,368      18,169      6,199
                           Trade and other accounts receivable    45,936      42,755      3,181
                           Current financial investments            4,707      6,461     (1,754)
                           Other current financial assets           2,921        745      2,176
                           Cash and cash equivalents             109,738      20,569     89,169
         Triple equity     TOTAL ASSETS                          397,432     258,198    139,234

        balance due to     (€k)                                  31/3/21     31/12/20     Var.
                           Equity                                155,507      48,835    106,672
       the share capital   Non-current liabilities               151,200      143,518    7,682
           increase        Deferred tax liabilities               5,728       5,591        137
                           Non-current provisions                 4,966        3,421     1,545
                           Financial debt                        140,506     134,506     6,000
                             Bonds                                21,488      21,497       (9)
                             Debt with financial entities         109,509     108,653     856
                             Finance lease                         9,379      4,200      5,179
                             Other debts                           130          156       (26)

                           Current liabilities                    90,725      65,845    24,880
                           Current provisions                      908         839         69
                           Trade and other accounts payable       54,695      44,049    10,646
                           Financial debt                         35,122      20,957     14,165
                             Current financial liabilities          451         152       299
                             Short-term financial lease           32,683      17,069     15,614
                             Other current liabilities              815        682        133
                             Group Loan                            1,173       3,054     (1,881)

                           TOTAL LIABILITIES AND EQUITY          397,432     258,198    139,234    25
1Q21 RESULTS
     Net Debt

                                               Leverage reduced to 3.1x

                           Net Debt
                           (€k)                                            1Q21         FY20       1Q21-FY20
                           Long-term financial debt                   39,668,228    35,026,283      4,641,945
                           Short-term financial debt                   13,621,726    4,832,787      8,788,939
                           Other long term debt                          130,159       156,189       (26,030)
                           Other short term debt                        1,172,573    3,054,370      (1,881,797)
                           Other current financial assets             (4,706,757)   (6,460,724)      1,753,967
                           Cash & cash equivalents                  (105,464,054)   (12,492,510)   (92,971,544)

                           Corporate Net Debt with resource         (55,578,125)    24,116,395     (79,694,520)
                           Project Finance debt with resource        57,943,786     50,382,935       7,560,851
                           Project Finance cash with resource         (917,025)     (5,631,607)      4,714,582

                           Project Finance Net Debt with resource    57,026,761     44,751,328     12,275,433
                           Project Finance debt without resource      63,091,741    62,009,987       1,081,754
                           Project Finance cash without resource     (3,348,968)    (2,445,133)     (903,835)

                           Net Debt without resource                 59,742,773     59,564,854       177,919
                           Total Net Debt                            61,191,409     128,432,577    (67,241,168)

                                                                                                                  26
1
    IFRS audited figures
Developers and IPP of SOLAR PV & WIND projects

   Chile - Spain - Peru - Colombia - Italy - Mexico - Argentina - UK
You can also read