Modeling of sub-ionospheric VLF signal perturbations associated with total solar eclipse, 2009 in Indian subcontinent
←
→
Page content transcription
If your browser does not render page correctly, please read the page content below
Available online at www.sciencedirect.com

                                                Advances in Space Research 50 (2012) 196–204
                                                                                                                           www.elsevier.com/locate/asr

    Modeling of sub-ionospheric VLF signal perturbations associated
          with total solar eclipse, 2009 in Indian subcontinent
                       Sujay Pal a,⇑, Sandip K. Chakrabarti a,b, Sushanta K. Mondal b
                       a
                           S.N. Bose National Centre for Basic Sciences, JD Block, Sector-III, Salt Lake, Kolkata 700098, India
                                b
                                  Indian Centre for Space Physics, 43 Chalantika, Garia St. Road, Kolkata 700084, India

                                Received 14 January 2012; received in revised form 3 April 2012; accepted 5 April 2012
                                                           Available online 17 April 2012

Abstract

   During the total solar eclipse of 2009, a week-long campaign was conducted in the Indian sub-continent to study the low-latitude D-
region ionosphere using the very low frequency (VLF) signal from the Indian Navy transmitter (call sign: VTX3) operating at 18.2 kHz.
It was observed that in several places, the signal amplitude is enhanced while in other places the amplitude is reduced. We simulated the
observational results using the well known Long Wavelength Propagation Capability (LWPC) code. As a first order approximation, the
ionospheric parameters were assumed to vary according to the degree of solar obscuration on the way to the receivers. This automatically
brought in non-uniformity of the ionospheric parameters along the propagation paths. We find that an assumption of 4 km increase of
lower ionospheric height for places going through totality in the propagation path simulate the observations very well at Kathmandu and
Raiganj. We find an increase of the height parameter by h0 ¼ þ3:0 km for the VTX-Malda path and h0 ¼ þ1:8 km for the VTX-Kolkata
path. We also present, as an example, the altitude variation of electron number density throughout the eclipse time at Raiganj.
Ó 2012 COSPAR. Published by Elsevier Ltd. All rights reserved.

Keywords: Solar eclipse; D-region ionosphere; VLF waves; Electron density; Modeling VLF signals

1. Introduction                                                               8.387 N, Long: 77.753 E) transmitting at 18.2 kHz is
                                                                              located near the southern tip of India almost on the mag-
   It is well known that a solar eclipse produces distur-                     netic equatorial plane. This allows the paths in all the bear-
bances in the ionosphere and provides us with a unique                        ings within India to be roughly of uniform geophysical
opportunity to verify our theoretical understanding about                     condition and no disturbances due to equatorial crossing
how the ionosphere reacts to impinging radiation, or, for                     is expected. Second, the magnetic meridian passing through
that matter, withdrawal of it. The present paper is con-                      VTX vertically splits the Indian sub-continent into roughly
cerned with the modeling of the signatures of the total solar                 two halves. In the eastern half, the signal is attenuated in
eclipse (TSE) which took place on the 22nd of July 2009 in                    the day time, and in the western half, it is just the opposite
India. During this time, the Indian Centre for Space Phys-                    (Chakrabarti et al., 2010, 2011, 2012). Thus spreading
ics (ICSP) conducted a campaign in which data from more                       around receivers in the sub-continent allowed us to study
than a dozen places in India and Nepal were collected                         the signals under varied wave propagation conditions in
before, during, and after the eclipse. The campaign was                       a short path (< 3000 km).
even more exciting because of the fact that the nearest                           There are several papers in the literature which reported
transmitter, namely, the Indian navy station VTX (Lat:                        the effects of the solar eclipse over both short and long paths
                                                                              using VLF waves. The first report on the effect of the eclipse
 ⇑ Corresponding author. Tel.: +91 33 2335 5706/7/8x442; fax: +91 33
                                                                              was reported exactly half a century ago (Bracewell, 1952).
2335 3477.
                                                                              Subsequently, several workers have presented the results
   E-mail address: sujay@bose.res.in (S. Pal).                                of amplitude and phase variations, typically from a single

0273-1177/$36.00 Ó 2012 COSPAR. Published by Elsevier Ltd. All rights reserved.
http://dx.doi.org/10.1016/j.asr.2012.04.007
S. Pal et al. / Advances in Space Research 50 (2012) 196–204 197
observations (Sengupta et al., 1980; Lynn, 1981; Buckmas- In this paper, we interpret the signals observed during
ter and Hansen, 1986; Mendes da Costa et al., 1995). How- the 2009 total solar eclipse at several places by modeling
ever, very few papers discussed the modeling of VLF signals the propagation of the VLF waves in the earth-ionosphere
perturbations associated with a solar eclipse. Clilverd et al. waveguide. For this purpose, we selected four propagation
(2001) presented results of the total solar eclipse in Europe paths having quite different bearings. For the simulation
on August 11, 1999. They had five receiving sets which purpose, we assume that the ionospheric parameters vary
observed several stations each and thus had altogether 17 according to the degree of solar obscuration along the
different paths. While their path lengths varied from propagation path. This naturally brought in a non-unifor-
90 km to 14,510 km, majority were < 2000 km. The major mity in the ionospheric parameters for different receiver
conclusion of Clilverd et al. (2001) was that, for shorter locations.
propagation paths (< 2000 km), the amplitude change was
positive, i.e., the signal was enhanced. For path lengths
2. Observed effects of solar eclipse
> 10,000 km, the amplitude change was negative. These
authors also gave an explanation of the nature of the signals
We use ICSP made VLF antenna/receiver systems to
using Long Wavelength Propagation Capability (LWPC)
monitor VLF signals. Each set consists of a loop type rect-
waveguide code (Ferguson, 1998). They found an 8 km rise
angular antenna and Gyrator II type receiver. The system
in h0 parameter during eclipse conditions over short paths,
was controlled by PC with a sound card for real time data
while over the medium-length paths, the estimation was a
acquisition.
rise of 5 km in h0 parameter. A similar result was reported
In Fig. 1, we show the path of totality during July 22nd,
by Fleury et al. (2000), who found an increase of about
2009 eclipse. While ICSP obtained data at twelve places
5 km in the h0 parameter at mid-eclipse. The path lengths
(Chakrabarti et al., 2011, 2012), we chose in this paper four
were within 1000 km and they used a constant b ¼ 0:5
representative propagation paths of varying character and
parameter throughout the eclipse time while changing h0 lin-
noise-free signals for the modeling purpose. The VTX-
early from daytime to night-time values. They also assumed
Kolkata propagation path (1946 km) is very much below
the disturbance of height to be uniform along the whole
the belt of totality, while the VTX-Malda (2151 km) path
radio path.
nearly touches the southern boundary of totality. The
Fig. 1. The propagation paths from the VTX transmitter to four receiving sites showing the path of totality as shaded area over the Indian subcontinent
during the total solar eclipse on 22nd July, 2009. The Figure is modified from that provided by Espenak & Anderson in NASA 2009 eclipse bulletin by
including our propagation paths.198 S. Pal et al. / Advances in Space Research 50 (2012) 196–204
80
75
70
Kolkata
65
60
75
Signal amplitude (dB) 70
65 Malda
60
55
75
70 Raiganj
65
60
55
75
70
Kathmandu
65
60
0 2 4 6 8 10 12 14 16 18 20 22 24
Time in hours (IST)
Fig. 2. The diurnal variation of 18.2 kHz VLF signal amplitude for (from top panel to bottom panel) Kolkata, Malda, Raiganj and Kathmandu. Blue
curves are the average diurnal variation for normal day and black curves represent the variation on solar eclipse day. Vertical dotted lines represent the
times of the first contact of eclipse, the phase of maximum eclipse and the last contact at the receiving places respectively.
VTX-Raiganj (2207 km) path entered the totality belt while present the data for Kolakta, Malda, Raiganj and Kath-
the VTX-Kathmandu propagation path (2296 km) actually mandu, respectively. The blue curves are the average diur-
crossed the path of totality. nal variations for a normal day which are obtained by
In Fig. 2, we present the diurnal variation of 18.2 kHz averaging the data of two days before and two days after
VLF signal amplitude for places under study in the normal the eclipse. The black curves represent the variation on
and eclipse days. From top panel to the bottom panel, we the solar eclipse day. Vertical dotted lines represent the
4
Kolkata 1 Malda
Eclipse effect (dB)
3
0
2
-1
1
0 -2
320 340 360 380 400 420 440 460 320 340 360 380 400 420 440 460
1 2
Raiganj Kathmandu
Eclipse effect (dB)
0
-1 1
-2
0
-3
-4
-1
-5
-6 -2
320 340 360 380 400 420 440 460 320 340 360 380 400 420 440 460
Time in minutes (IST) Time in minutes (IST)
Fig. 3. The variation of the differential amplitude of the VTX signal at four receiving stations during the eclipse time. This variations of amplitude are
obtained by subtracting an average unperturbed data from the eclipsed data on 22nd July, 2009. The time is in Indian Standard Time (IST = UT + 5:30).
The time of first contact, eclipse maximum (or, second and third contacts, when available), and the last contact are indicated by vertical dashed lines at
each receiver.S. Pal et al. / Advances in Space Research 50 (2012) 196–204 199
Table 1
Solar eclipse parameters at different receiving stations.
Place & geog. lat, long Bearing & dist. (km) Coverage % Sunrise 1st (IST) E(°) Mid (IST) E(°) 2nd (IST) E(°)
0 0 0
Kolkata 22 34 N; 88 24 E 34 37 1946 Partial 89.9 05:04 05:28:46 05 06:26:20 17 07:30:54 32
Malda 25 N; 88 090 E 29 350 2151 Partial 99.6 05:00 05:29:34 05 06:27:24 18 07:32:04 32
Raiganj 25 360 N; 88 080 E 28 360 2207 Total 100 04:59 05:29:52.3 5.6 06:27:43.1 18.1 07:32:22 32.4
Kathmandu 27 450 N; 88 230 E 19 200 2296 Partial 96.3 05:21 05:31:10 04 06:27:43 16 07:30:30 30
times of the first contact of eclipse, maximum phase of the cally selected by the code itself. These parameters are con-
eclipse and last contact at the receiving sites respectively. stants corresponding to normal and eclipses conditions.
For Malda and Raiganj stations, the normal day data The upper waveguide i.e., ionospheric parameters are spec-
beyond 10:00 h (IST) are not available due to local power ified by the electron density N e ðhÞ and the electron-neutral
failure. Note that there are no ionospheric disturbances collision frequency me ðhÞ profiles. We use Wait’s exponen-
in the signal on the eclipse day due to geomagnetic activi- tial ionosphere (Wait and Spies, 1964) for the electron den-
ties. Indeed, the Kp index for 22nd July, 2009 was 3 sity profile with gradient parameter b and reference height
between 5:30 IST (0 UT) and 8:30 IST (3 UT). The Dst h0 as given by the equation,
index was 5, 4 and 5 for 6:30 IST (1 UT), 7:30 IST (2
UT) and 8:30 IST (3 UT) respectively. So the eclipse period N e ðh; h0 ; bÞ ¼ 1:43 107 expð0:15h0 Þexp½ðb 0:15Þðh h0 Þ;
was geomagnetically quiet and the observed deviation of
the signal amplitude can be safely assumed to be due to in cm3 . The electron-neutral collision frequency (S 1 ) is gi-
the effects of eclipse alone. ven by the equation,
In Fig. 3, we show the differential amplitude variations
of the VTX signal (18.2 kHz) for the above four propaga- me ðhÞ ¼ 1:816 1011 expð0:15hÞ:
tion paths during eclipse time only. Along the X-axis, the
time given is in Indian Standard Time (IST = UT + 5:30). These profiles are quite standard and generally agree with
These variations of amplitude are obtained by subtracting directly observed normal D-region ionospheric profiles
an unperturbed data (which is obtained by averaging the (Sechrist, 1974; Cummer et al., 1998).
data of two days before and after the eclipse day) from To choose the unperturbed ionospheric profiles for the
the eclipsed data on the 22nd July, 2009. In the top left propagation paths under study, we run the LWPC code
panel, we show the result of VTX-Kolkata path. The at 05:30 AM, 06:30 AM and 07:30 AM (all times in
eclipse was partial and the maximum obscuration of the IST = UT + 5:30) respectively and find the amplitudes at
solar disk was 90%. Here, the change in amplitude is each receiver location. Then we look at the average ampli-
positive. The signal is amplified by +2 dB close to the max- tudes observed at that receiver during those times. We take
imum of the eclipse. The top right panel, the bottom-left the values b ¼ 0:3 km1 and h0 ¼ 74:0 km as appropriate
and bottom-right panels are for VTX-Kathmandu, VTX- for the VTX-Kathmandu, VTX-Raiganj and VTX-Malda
Raiganj and VTX-Malda respectively. The signal ampli- propagation paths as unperturbed ionosphere (Zigman
tude was reduced by about 2 dB in all these places. et al., 2007). The parameter set b ¼ 0:3 km1 and
Table 1 shows the parameters of and at the receiving sta- h0 ¼ 74:0 km does not fit the VTX-Kolkata result very well.
tions which concern our study. We show the locations with For VTX-Kolkata path, matching LWPC data with aver-
geographic latitude and longitude, bearing angle, distance age observational amplitude of 65.45 dB with respect to
between the transmitter and the receiver, the percentage 1 l Vm1 at 6:30 AM (IST) requires b ¼ 0:35 km1 and
of eclipse coverage, the time of the first contact, the time h0 ¼ 76:0 km. These parameters were obtained by assuming
at which the maximum eclipse took place, the last contact a uniform electron density profile throughout the path. We
and the elevation (E) of the Sun (with respect to the local stick to these parameters for an unperturbed ionosphere
horizon) in degrees at these times. along VTX-Kolkata path.
To model the partially eclipsed D-region ionosphere we
need to calculate the degree of solar obscuration as a func-
3. Modeling procedure tion of time along each path. For this, we developed a
numerical code to obtain the solar obscuration function
We use the Long Wavelength Propagation Capability SðtÞ at a particular point along a path using the formalism
(LWPC) code to calculate the amplitudes at receiving sites of Mollmann and Vollmer (2006). The input parameters
corresponding to normal and partially eclipsed-ionosphere (i.e., time of starting and ending of eclipse, magnitude of
conditions. LWPC code is a very versatile code and it uses eclipse) for the model are taken from the website of solar
the waveguide mode theory. One has to provide the suit- eclipse calculator (http://www.chris.obyrne.com/Eclipses/
able boundary conditions for the lower and upper wave- calculator.html) for the solar eclipse of July, 2009. Then
guides. The lower waveguide parameters i.e., permittivity we divided each propagation path into several ð 15Þ seg-
() and conductivity (r) of the earth have been automati- ments along the transmitter to receiver great circle path200 S. Pal et al. / Advances in Space Research 50 (2012) 196–204
(a)
1
0
-1
-2
340 360 380 400 420 440
(b)
Fig. 4. (a) The model amplitude variation (solid curve) is compared with corresponding observed changes (circle) at Kathmandu. Maximum eclipse effects
occur when h0 has increased by +4.0 km and b has increased by þ0:04 km1 at t ¼ 383 min (IST). (b) The variation of the model amplitude with distance
from the transmitter for unperturbed conditions (solid line), maximum eclipse conditions (dotted curve) and at t ¼ 420 min (dashed curve). The location of
the receiver is indicated by a vertical line.
and calculated the degree of solar obscuration as a function received at Kathmandu. The maximum eclipse effect occurs
of time. when h0 is increased by +4.0 km and b is increased by
As a first order approximation, we assumed that the ion- +0.04 km1 at t ¼ 383:0 min (IST) while the observed max-
ospheric parameters b and h0 vary linearly with obscuration imum eclipse effect occurs at around t ¼ 389:5 min. The
function from the unperturbed one, though the ionospheric variation of the model amplitude with distance from the
response to solar eclipse are generally non-linear phenom- transmitter (in km) for unperturbed (no eclipse) condition
ena (Lynn, 1981; Patel et al., 1986). Thus the parameters (solid line), maximum eclipse condition (dotted curve)
vary with time and distance from the transmitter. There- and at t ¼ 420:0 min (dashed curve) are shown in
fore, if the maximum deviations for b and h0 are given at Fig. 4(b). The location of the receiver is indicated by a ver-
any time, the perturbed parameters will be obtained by tical line.
summing the unperturbed values of the the parameters Fig. 5(a) and (b) show similar plots for the VTX-Raiganj
with the product of the deviation and solar obscuration propagation path. Here also the maximum eclipse effects
function. occur when h0 has increased by +4.0 km and b has
increased by +0.04 km1 at t ¼ 383:0 min and the observed
4. Results maximum eclipse effect occurs at around t ¼ 377:5 min.
In Fig. 6(a) and (b), we show similar plots for the VTX-
In Fig. 4(a), we show the amplitude variation (solid Kolkata propagation path. The maximum eclipse effects
curve) obtained by the model fit and compare it with the occur when h0 has increased by þ1:8 km and b has
corresponding observed changes (circle) of VTX signal as increased by+0.02 km1 at t ¼ 390:0 min at Kolkata.S. Pal et al. / Advances in Space Research 50 (2012) 196–204 201
(a) 1
0
-1
-2
-3
340 360 380 400 420 440
(b)
Fig. 5. A plot similar to Fig. 4 for the VTX-Raiganj propagation path. Maximum eclipse effects occur when h0 has increased by +4.0 km and b has
increased by þ0:04 km1 at t ¼ 383 (IST) minute at the region with the totality of eclipse.
Fig. 7(a) and (b) correspond to the VTX-Malda propaga- using the so called Wait’s formula (Wait and Spies, 1964)
tion path where h0 has increased by þ3:0 km and b has using the calculated variation of b and h0 parameters with
increased by +0.02 km1 due to the maximum eclipse at time. We note that in lower heights the near neutrality is
t ¼ 385:0 min at Malda. achieved during the mid eclipse. At a height of 90 km,
These results for the VTX signal are quite reasonable. In of course, there are still some electrons. The effects of the
particular, we find that the path which crosses the whole eclipse at even higher height where the Wait’s formula is
eclipse belt (i.e., that of VTX-Kathmandu) required the no longer applicable would be of great interest and would
highest shift in height, while the path which is farthest from be dealt with elsewhere.
totality (VTX-Kolkata) required the least height variation.
Our derived results are also comparable to what Guha 5. Discussions
et al., 2010 found, where an increase of height parameter
about +3.5 km and an increase of gradient parameter In this paper, we have modeled the effects of the solar
about +0.03 km1 have been reported for a given station. eclipse of July 22nd, 2009 on the VLF signals. We chose
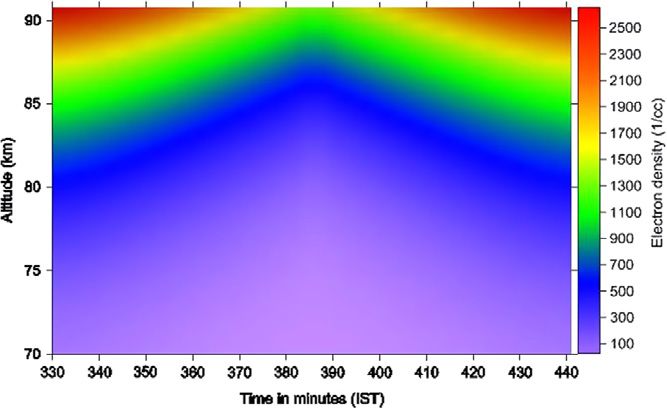
During totality, a near-nighttime condition is expected four propagation paths in the Indian subcontinent which
to prevail in the lower ionosphere and thus the number represent four different situations, starting from a com-
density of electrons should be reduced as the D-region pletely partial eclipse (VTX-Kolkata), to marginally touch-
nearly disappears. To show this, we consider the data at ing totality (VTX-Malda), totality (VTX-Raiganj) and
Raiganj which witnessed totality (see, Table 1). In Fig. 8, crossing the path of totality (VTX-Kathmandu). We notice
we show how the distribution of the electron density that there is no direct correspondence between the degree
(cm3 ) with altitude changes with time during the eclipse of obscuration and the deviation of the signal. For
at Raiganj. The electron density at Raiganj is calculated instance, except the Kolkata data, all other signals were202 S. Pal et al. / Advances in Space Research 50 (2012) 196–204
(a)
3
2
1
0
-1
340 360 380 400 420 440
(b)
Fig. 6. (a) A plot similar to Fig. 4 for the VTX-Kolkata propagation path. Maximum eclipse effects occur when h0 has increased by +1.8 km and b has
increased by +0.02 km1 at t ¼ 390 (IST) minute at Kolkata. (b) The variation of the model amplitude with distance from the transmitter for unperturbed
conditions (solid line), maximum eclipse conditions (dotted curve) and at t ¼ 420 min (dashed curve) (7:00 AM IST). The location of the receiver is
indicated by a vertical line.
actually attenuated during the eclipse maximum. It would 2000 km (see, Table 1). In our case, for instance, any path
mean, in the language of the Wave-hop theory, that which has experienced the totality gives a negative devia-
whether or not the interference between the sky wave and tion, perhaps due to the significant change in the path
the ground wave would be constructive or destructive length (phase) at the totality belt. What appears to be rel-
would depend on the path length of each wave and not evant here is the cumulative effects of the ionospheric dis-
by the local value of ionization. turbances due to solar eclipse.
In the Introduction we briefly presented the results of Our model is based on the waveguide mode theory
Clilverd et al. (2001). They found a positive deviation of assuming a linear variation of ionospheric parameters with
amplitude for shorter paths (< 2000 km) and a negative the degree of solar obscuration. Our result generally agrees
deviation of amplitude for longer paths ð> 10; 000 km). with what is observed and this gives us the confidence that
While we indeed found a positive deviation for a ‘margin- the outcome is totally due to the propagation effect. There
ally shorter’ path (1946 km), the negative deviation started appears to be still some discrepancies between our result
appearing even if the distance is ‘marginally’ above and that of the observation, especially close to the sunriseS. Pal et al. / Advances in Space Research 50 (2012) 196–204 203
(a)
1
Differential Amplitude (dB)
0
-1
-2
-3
340 360 380 400 420 440
Time in minutes (IST)
(b) 82
80
78
Amplitude (dB)
76
74
72
70
68
1000 1100 1200 1300 1400 1500 1600 1700 1800 1900 2000 2100 2200 2300 2400 2500
Distance from Transmitter (km)
Fig. 7. A plot similar to Fig. 4 for VTX-Malda propagation path. Here the maximum eclipse effects occur when h0 has increased by +3.0 km and b has
increased by +0.02 km1 at t ¼ 385:0 min at Malda.
sunrise time is contaminated by increasing attenuation
due to lowering of the lower ionosphere. A complete agree-
ment could perhaps be reached when the sunrise effects are
also included. This is beyond the scope of the present paper.
Acknowledgements
S. Pal and S. K. Mondal acknowledge the support from
a CSIR Fellowship. SKC acknowledges the support from a
RESPOND project. The authors deeply acknowledge the
NOAA National Geophysical Data Center for providing
data related to the geomagnetic indices. The authors also
thank Dr. D. Sulic for providing support with the LWPC
Fig. 8. Altitude variation of electron number density (cm3 ) obtained code.
from Wait’s formula during eclipse time at Raiganj. Note that at lower
height, the number density is 0 due to the near night condition when the
D-layer completely disappeared. The ionization of the D-region at lower References
altitudes recover at a faster rate than the ionization at higher altitudes.
Bracewell, R.N. Theory of formation of an ionospheric layer below E
layer based on eclipse and solar flare effects at 16 kc/sec. J. Atmos.
region. This means that our crucial assumption that the
Terr. Phys. 2, 226–235, 1952.
variation of ionospheric parameters with the solar obscura- Buckmaster, H.A., Hansen, C.H. 26 February 1979 total solar eclipse
tion is linear at all points of the propagation path may not induced LF (60 kHz) phase retardation. J. Atmos. Terr. Phys. 48, 393–
be quite accurate. Furthermore, the data close to the 397, 1986.204 S. Pal et al. / Advances in Space Research 50 (2012) 196–204
Chakrabarti, S.K., Sasmal, S., Pal, S., Mondal, S.K. Results of VLF Guha, A., De, B.K., Roy, R., Choudhury, A. Response of the equatorial
campaigns in summer, winter and during solar eclipse in indian lower ionosphere to the total solar eclipse of 22 July 2009 during
subcontinent and beyond. AIP Conf. Proc., 1286. AIP, New York, sunrise transition period studied using VLF signal. J. Geophys. Res.
2010. 115, A11302, 2010.
Chakrabarti, S.K., Pal, S., Sasmal, S., et al. VLF Observational Results od Lynn, K.J.W. The total solar eclipse of 23 October 1976, observed at VLF.
Total Eclipse of 22nd July, 2009 by ICSP Team. IEEE Con. J. Atmos. terr. Phys. 43, 1309–1316, 1981.
Publication, 2011. Mendes da Costa, A., Rizzo Piazza, L., Paes Leme, N.M. Lower
Chakrabarti, S.K., Mondal, S.K., Sasmal, S., et al., VLF signals in Ionosphere effect observed during the 30 June 1992 total solar eclipse.
summer and winter in the Indian sub-continent using multi-station J. Atmos. Terr. Phys. 57, 13–17, 1995.
campaigns, IJP, 2012, in press. Mollmann, K.P., Vollmer, M. Measurements and predictions of the
Clilverd, M.A., Rodger, C.J., Thomson, N.R., et al. Total solar eclipse illuminance during a solar eclipse. Eur. J. Phys. 27, 1299, 2006.
effects on VLF signals: observations and modeling. Radio Sci. 36 (4), Patel, D.B., Kotadia, K.M., Lele, P.D., Jani, K.G. Absorption of radio
773, 2001. waves during a solar eclipse. Earth Planet Sci. 95, 193–200, 1986.
Cummer, S.A., Inan, U.S., Bell, T.F. Ionospheric D region remote Sechrist Jr., C.F. Comparisons of techniques for measurement of D-region
sensing using VLF radio atmospherics. Radio Sci., 33 1781–1792, electron densities. Radio Sci. 9, 137–149, 1974.
1998. Sengupta, A., Goel, G.K., Mathur, B.S. Effect of the 16 February 1980
Ferguson, J.A. Computer programs for assessment of long-wavelength solar eclipse on VLF propagation. JATP 42, 907, 1980.
radio communications, version 2.0. Technical document 3030, Space Wait, J.R., Spies, K.P. Characteristics of the Earth-Ionosphere waveguide
and Naval Warfare Systems Center, San Diego, 1998. for VLF radio waves. NBS Tech Note, U.S. 300, 1964.
Fleury, R., Lassudrie-Duchesne, P. VLF-LF Propagation Measurements Zigman, V., Grubor, D., Sulic, D. D-region electron density evaluated
During the 11 August 1999 Solar Eclipse. IEEE Con. Publication, from VLF amplitude time delay during X-ray solar flares. JASTP,
2000. 775–792, 2007.You can also read