Nighttimeߚlike quasi periodic echoes induced by a partial solar eclipse
←
→
Page content transcription
If your browser does not render page correctly, please read the page content below
GEOPHYSICAL RESEARCH LETTERS, VOL. 37, L09107, doi:10.1029/2010GL042855, 2010
  Click
  Here
    for
 Full
Article

Nighttime‐like quasi periodic echoes induced by a partial solar
eclipse
Smitha V. Thampi,1 Mamoru Yamamoto,1 Huixin Liu,1 Susumu Saito,2 Yuichi Otsuka,3
and Amit Kumar Patra4
Received 9 February 2010; revised 29 March 2010; accepted 31 March 2010; published 14 May 2010.

[1] The first observations of solar eclipse induced mid‐               which allow the excitation of plasma instability and the
latitude plasma irregularities using the middle and upper              generation of plasma irregularities as happens routinely
atmosphere radar (MU radar) at Shigaraki (34.85°N,136.1°E,             during post‐sunset hours. They surmised that the irregular-
25.0°N geomagnetic) are presented. The observations were               ities could grow on the density gradients formed by the
done during the partial solar eclipse on 22 July, 2009. The            metallic ion layers when molecular ions are recombined
observations show that the sudden withdrawal of solar                  during the solar eclipse. Observations to support this notion,
radiation could deplete the background E‐region densities,             however, have so far been limited to Gadanki only.
thereby unmasking the long‐lived metallic ions within the                 [4] In this context, it would be interesting to examine
strong and patchy Sporadic E‐layers. As a result of this,              mid‐latitude E region observations during the solar eclipse
Quasi‐Periodic (QP) echoes were generated, which were                  since the generation of mid‐latitude E region plasma irreg-
detected by the MU radar. These echoes resemble the                    ularities are believed to be heavily linked with the gradients
normal post‐sunset QP echoes observed over mid‐latitudes               associated with the plasma density structures. Importantly,
as revealed by the multi‐channel interfereometry imaging.              with regard to the Quasi‐Periodic (QP) echoes [Yamamoto
This example shows that over mid‐latitudes E‐region                    et al., 1991], which are generated after the sunset, it would
plasma irregularities can be generated during a partial solar          be much more interesting. Although the MU radar (middle
eclipse, revealing a hitherto unobserved aspect of mid‐                and upper atmosphere radar) incoherent scatter observations
latitude ionospheric responses to eclipses. Citation: Thampi,          from Shigaraki (34.85°N, 136.1°E, 25°N mag. lat.) during a
S. V., M. Yamamoto, H. Liu, S. Saito, Y. Otsuka, and A. K. Patra       partial solar eclipse have been studied [Zhang et al., 1991],
(2010), Nighttime‐like quasi periodic echoes induced by a partial      attention was not paid to address the mid‐latitude plasma
solar eclipse, Geophys. Res. Lett., 37, L09107, doi:10.1029/           irregularities possibly because much of the features includ-
2010GL042855.                                                          ing those of the QP echoes were then just discovered by
                                                                       Yamamoto et al. [1991].
1. Introduction                                                           [5] In this paper, we study the MU radar observations
                                                                       of E‐ region irregularities during the partial solar eclipse
   [2] A solar eclipse provides a unique opportunity to inves-         on 22 July 2009. The most important and unique finding
tigate the changes in the ionosphere as a response to the              reported here is the observations of QP echoes for a period
sudden and transitory withdrawal of solar radiation. One               of ∼30 minutes during the eclipse. To the best of our
important effect is the reduction in plasma density, which             knowledge, these are the first set of QP echoes observed
has been reported to be as high as 40% in the E and F1                 during the eclipse. This is an interesting report of QP echoes
regions [e.g., Van Zandt et al., 1960]. Another one is the             in the daytime hours as well. Considering that QP echoing
triggering of gravity waves [Chimonas and Hines, 1970].                phenomenon is a nighttime one [Yamamoto et al., 1992] and
In the ionosphere they are due to the rapid photochemical              solar eclipse provides night‐like ionospheric conditions and
and dynamical changes in the transition region between F1              triggers gravity waves, these observations would be sig-
and F2 layers during the eclipse [Altadill et al., 2001] or            nificant on two counts: (1) to understand the solar eclipse
the disturbance linked with the ozone cooling in the lower             effect to induce/enhance plasma turbulence and (2) to
altitudes, which can propagate upward to the thermosphere‐             develop a better understanding on the origin of QP echoes.
ionosphere system [Fritts and Luo, 1993].                              The observations are summarized in section 2 and a dis-
   [3] More recently, Patra et al. [2009] using the Gadanki            cussion on the possible generation mechanism of QP echoes
radar observations from a low latitude location in India               is provided in section 3.
have reported that solar eclipse can induce/enhance plasma
irregularities in the E region. Patra et al. [2009] argued that        2. Observations
solar eclipse could provide night‐like ionospheric conditions
                                                                         [6] The solar eclipse of 22 July 2009 was the longest total
                                                                       solar eclipse during the 21st century with the maximum
   1
     Research Institute for Sustainable Humanosphere (RISH), Kyoto     eclipse occurring over the ocean about 100 km south of the
University, Kyoto, Japan.                                              Bonin Islands, south east of Japan. Over the radar beam
   2
     Electronic Navigation Research Institute, Tokyo, Japan.
   3
     Solar-Terrestrial Environment Laboratory, Nagoya University,      location, the eclipse was partial, with a maximum obscura-
Nagoya, Japan.                                                         tion of about 77% (Figure 1a). The event occurred in the
   4
     National Atmospheric Research Laboratory, Gadanki, India.         interval 00:49–3:24 UT with the maximum obscuration at
                                                                       02:06:06 UT (Japan Standard Time, JST = UT + 9 h). The
Copyright 2010 by the American Geophysical Union.                      MU radar observations were done in a multi‐channel mode
0094‐8276/10/2010GL042855

                                                                L09107                                                         1 of 6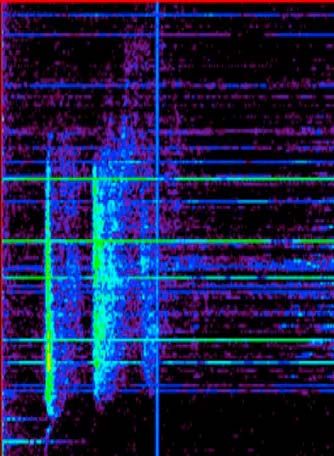
L09107                         THAMPI ET AL.: QP ECHOES INDUCED BY SOLAR ECLIPSE                                            L09107

Figure 1. (a) LT variation of the magnitude of the eclipse. (b–d) RTI, Doppler velocity and spectral width plots obtained
from the MU radar observations on 22 July 2009.

[Saito et al., 2006]. The observation parameters are sum-           [8] Figure 2 shows few samples of FAI echo distribution
marized in Table 1. The observations were conducted al-           in the horizontal and vertical plane. They are generated by
ternately for the E‐ and F‐ region field‐aligned irregularities   the radar imaging technique with the MU radar Ultra‐multi
(FAIs). There were no F‐region echoes, and in this paper we       channel receiver system [Saito et al., 2006]. For horizontal
present only the E‐region observations.                           images, the echoes were projected to an altitude of 100 km
   [7] Figure 1b shows the Range‐Time‐Intensity (RTI)             along the geomagnetic field line, while for the vertical
map, and Figure 1c and Figure 1c show corresponding               images they were projected on a plane that included the
Doppler velocities and spectral widths. The RTI plots dis-        center of the radar beam. The solid lines in the images
play echoes from the E‐region FAI, with the presence of           represent the center of the radar beam and −3dB beam
typical morning time “continuous echoes” up to ∼09:35             width positions. Color indicates the Doppler velocity and
JST. These are similar to that reported earlier by Yamamoto       color intensity indicates echo power. Figure 2a corresponds
et al. [1991]. The echoes re‐appeared around 10:35 JST,           to the time when continuous echoes were observed. The
around 30 minutes after the commencement of the eclipse.          irregularities in this case are confined to smaller altitude
These echoes appeared at a higher range, and displayed            region below 100 km, and the low brightness shows that
discrete and coherent patterns in the RTI maps, which are         the echo power is smaller. Figures 2b and 2c correspond
similar to the “QP type”, observed usually in the post‐           to two snapshots when the QP echoes were observed.
sunset period. These QP type echoes lasted for ∼30 minutes,       Unfortunately, in the present case, the time resolution of the
with ∼8–10 minutes periodicity. Figure 1c shows the corre-        observations (100 seconds) is not good enough to unam-
sponding Doppler velocities. Positive values denote Dopp-
ler velocities away from the radar (upward and northward).
The Doppler velocities of the echoes range from around            Table 1. Parameters of MU Radar Observations
−40 m s−1 to +60 m s−1, and the fine structure mimics the             Parameter                                    Value
fine structure in the RTI maps to some degree. The Doppler
                                                                  Center frequency                  46.5 MHz
velocities for the QP echo period were in general larger          Peak power                        1 MW
than that for the continuous type echoes, which is similar to     Number of beams                   6
the previous observations for the post‐sunset QP echoes           Beam directions                   (−20.62, 52.56), (−13.47, 51.09),
[e.g., Yamamoto et al., 1991]. However, the Doppler veloc-          (Azimuth, Zenith)                  (−6.72, 51.82) (0.00, 52.07),
                                                                                                       (6.72, 51.82), (13.70, 53.83)
ities are somewhat smaller in magnitude compared to the           Beam width                        (4.6°, 5.4°)
post‐sunset QP striations. The spectral widths are compa-           (Azimuth, Zenith)
rable in magnitudes for both continuous and QP echoes. It         Receiving channels                25
should be noted that the slow Doppler velocities and large        Pulse width                       4 ms (600 m)
spectral widths are characteristic of gradient drift waves,       Interpulse period                 1400 ms
                                                                  Time resolution                   100 s
which is the case of QP echoes.
                                                             2 of 6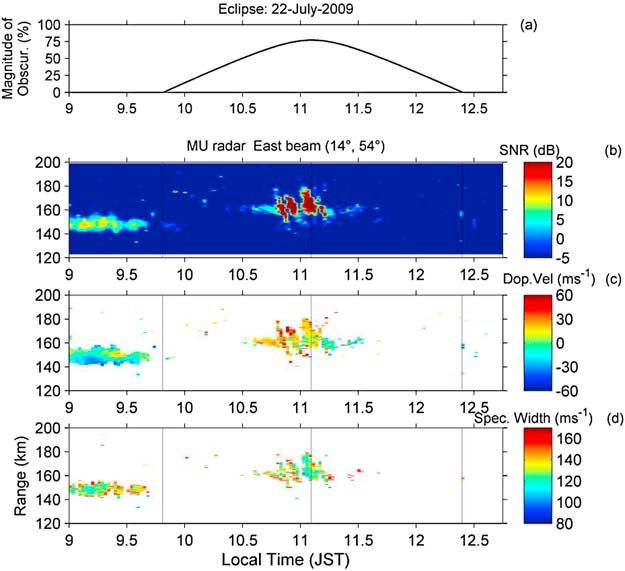
L09107 THAMPI ET AL.: QP ECHOES INDUCED BY SOLAR ECLIPSE L09107
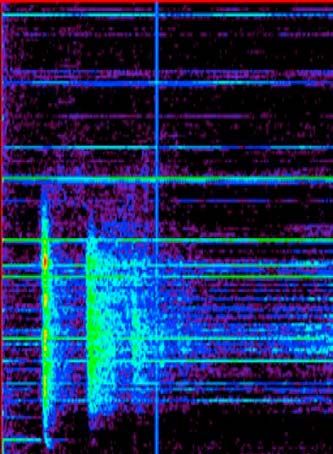
Figure 2. Radar images obtained from the MU radar observations on 22 July 2009.
biguously detect the horizontal motion of the irregularity E region echoes are observed) variation from 09:00–
patches. However, the morphological differences of the 13:00 JST, on three consecutive days, and Figures 3b and
‘continuous’ and ‘QP’ echoes are clear from the images. 3c show two ionograms, one during the eclipse and another
For the QP echoes, the altitude of echoing region is from on the next day. On all the three days, strong Es layers were
100–120 km, and the band of the echoing region is similar seen. If we compare the altitude of Es layer with that of
to the “ribbon” shape, reported by Hysell et al. [2002] and FAI, it can be seen that the altitude of continuous echoes in
Saito et al. [2006]. The echoes drifted closer to the radar the morning appeared at a lower altitude (not illustrated),
with apparently decreasing altitudes. All these features whereas the QP echoes during eclipse occurred at the same
resemble the night‐time QP echo morphology. altitude as Es layer (Figure 3b). This is also a characteristic
[9] A Frequency‐modulated‐continuous‐wave (FM‐CW) similar to the nighttime QP echoes. Since the Es layer is
sounder is being continuously operated at the MU radar dense and structured and replete with long‐lived metallic
location. It should be remembered that the region viewed by ions inside [Young et al., 1967; Ogawa et al., 2002], the
the MU radar and the region viewed by the ionosonde reduction in the E‐region background density would not be
(vertical incidence) are separated by ∼100 km. Figure 3a reflected in the f t Es values. The presence of large f t Es is a
shows the f t Es (the maximum frequency at which the desirable condition for the generation of QP echoes, if the
3 of 6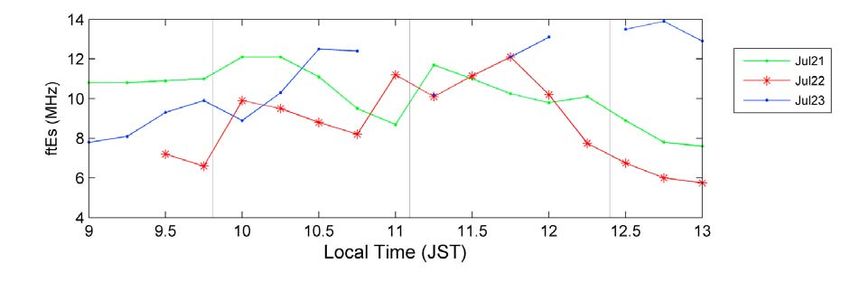
L09107                         THAMPI ET AL.: QP ECHOES INDUCED BY SOLAR ECLIPSE                                        L09107

Figure 3. (a) Ionosonde observations of f t Es from Shigaraki on 21, 22 and 23 July 2009. The data gaps are because the
determination of f t Es was ambiguous at those times, due to noise. (b–c) Ionograms during the eclipse and on the next
day.

necessary gradients are generated. The eclipse provided the       plasma density) plays an important role in the production of
necessary condition for the gradients to be persistent for        FAI.
sufficiently long duration for the instability to be generated.     [11] The MU radar incoherent scatter (IS) observations of
In the next section, we discuss the possible mechanism for        the E‐region were made during a partial solar eclipse on
the formation of QP echoes during the eclipse.                    September 23, 1987 [Zhang et al., 1991]. The eclipse started
                                                                  at Shigaraki at 10:00 JST and ended at 12:55 JST, and the
                                                                  maximum obscuration was 60%. Note that the local time
3. Discussion                                                     is similar to the July 2009 eclipse, while the maximum
                                                                  obscuration is 77% in the present case. It was seen that the
  [10] Most plasma irregularities in the mid‐latitude E‐region    electron densities at different heights in the E‐region
are believed to be produced by the gradient‐drift insta-          showed a simultaneous decrease after ∼30 minutes from the
bility induced by steep plasma gradients in the Es layer [e.g.,   commencement of the eclipse, and the E‐region density
Ecklund et al., 1981]. For explaining the quasi‐periodic          showed a 20% decrease relative to that of a normal day.
nature of the observed echoes, there have been several sug-       The time variation of these profiles showed a good agree-
gestions, like the gravity wave modulation of the gradient        ment with that of the solar EUV flux, which is quite
drift instabilities [Woodman et al., 1991], Kelvin Helm-          expected since the E‐region densities are directly con-
holtz (KH) billows [Larsen, 2000], and direction dependent        trolled by the solar radiation. In the present case, since the
Es layer instability [Cosgrove and Tsunoda, 2002]. It is          obscuration was 17% more, we can expect more depletion
proposed that polarization electric fields associated with the    in the E‐region density. The normal background E‐layer
horizontal inhomogeneity of an Es layer plays an important        density values could not be obtained since we do not have
role in the generation of QP echoes [Haldoupis et al., 1996;      IS observations. The IRI‐2007 model [Bilitza and Reinish,
Maruyama et al., 2000; Ogawa et al., 2002]. The fact that         2008] run for the same day gives the f 0 Es value of ∼3.3 MHz,
QP echoes always occur at night with preference for the pre‐      which is quite smaller than the f t Es.. It must be remembered
midnight sector and the close association of QP echoes with       that, in the present observations, QP echoes were seen after
Es layers provides strong evidence that rN (gradient in

                                                             4 of 6
L09107 THAMPI ET AL.: QP ECHOES INDUCED BY SOLAR ECLIPSE L09107
∼40 minutes from the start of the eclipse. Just like in the sufficient density gradients, and also due to the shortening
night time, during the eclipse, the molecular ion density of the polarization electric fields. During the solar eclipse
should decrease with a 1 min time scale, in the E‐region. the density gradients are formed by the long‐lived metallic
However, the metallic ions have a very long photochem- ion layers when molecular ions are recombined.
ical lifetime, owing to their weak recombination rates.
The recombination coefficient (a) for metallic ions is
nearly 5 orders of magnitude smaller that than that of 4. Conclusion
molecular ions [Zhou and Morton, 2005]. It is also reported [15] The first observations of solar eclipse induced mid‐
that the blanketing type sporadic‐ E layers are composed of latitude plasma irregularities using MU radar are presented.
metallic ions with the smallest recombination coefficients, During the eclipse, QP echoes were observed, which resem-
and the ions with larger recombination coefficients have an bled the normal post‐sunset QP echoes. Blanketing type
abundance outside the layer compared to that inside the Sporadic E‐layers were observed, which indicates the pres-
blanketing type sporadic E‐layer [Whitehead, 1966; Young ence of long‐lived metallic ions. The sudden withdrawal of
et al., 1967]. This means that, during a solar eclipse, the solar radiation could deplete the background E‐region
fast reduction in the back ground E‐region molecular ions densities, thus making it conducive for the gradient drift
would favor the metallic ions inside the Es layer to provide instability. This observation is a unique example of the mid‐
the density gradients that can destabilize the plasma. latitude ionospheric response to a partial solar eclipse.
[12] The quasi‐periodic nature of the observed echoes
can be related to the patchy Es layer itself, similar to the
explanation for the nighttime QP echoes. There is plentiful [16] Acknowledgments. The MU radar belongs to and is operated
by the Research Institute for Sustainable Humanosphere (RISH) of Kyoto
evidence that the sporadic E layers can be patchy [Miller University. The work of S.T. and H.L. is supported by the Japan Society
and Smith, 1978; Whitehead, 1989; Huang et al., 1995; for the Promotion of Science (JSPS) foundation.
Kelley et al., 1995] irrespective of day or night, indicating
that the wind‐system is rather complex. These gradients in
the zonal direction can generate polarization fields and References
generate QP striations [Maruyama, 1995; Haldoupis et al., Altadill, D., J. G. Solé, and E. M. Apostolov (2001), Vertical structure of a
1996; Maruyama et al., 2000]. Recently, Hysell et al. gravity wave like oscillation in the ionosphere generated by the solar
eclipse of August 11, 1999, J. Geophys. Res., 106, 21,419–21,428,
[2009] reported patchy sporadic‐E layer ionization along doi:10.1029/2001JA900069.
with small‐scale plasma waves and associated QP struc- Bilitza, D., and B. W. Reinish (2008), International Reference Ionosphere
tures. The Es layer parameters were measured by the 2007: Improvements and new parameters, Adv. Space Res., 42, 599–609,
doi:10.1016/j.asr.2007.07.048.
430 MHz IS radar at the Arecibo observatory, and the QP Chimonas, G., and C. O. Hines (1970), Atmospheric gravity waves induced
structures were detected by 30 MHz coherent radar at by a solar eclipse, J. Geophys. Res., 75, 857–875.
St. Croix. They concluded that the electrodynamics of the Cosgrove, R. B., and R. T. Tsunoda (2002), A direction‐dependant instabil-
patchy sporadic E ionization in the nighttime, could give ity of sporadic E layers in the nighttime midlatitude ionosphere, Geophys.
Res. Lett., 29(18), 1864, doi:10.1029/2002GL014669.
rise to the QP echoes. Ecklund, W. L., D. A. Carter, and B. B. Balsley (1981), Gradient drift irreg-
[13] The solar eclipse helped the patchy type Es layer to ularities in mid‐latitude sporadic E, J. Geophys. Res., 86, 858–862,
become unmasked during the day, providing necessary doi:10.1029/JA086iA02p00858.
Fritts, D. C., and Z. Luo (1993), Gravity wave forcing in the middle atmo-
gradients for gradient drift instability to work. The rapid sphere due to reduced Ozone heating during a solar eclipse, J. Geophys.
reduction in the E‐region density, caused by the eclipse Res., 98, 3011–3021, doi:10.1029/92JD02391.
would also reduce the field line integrated Pedersen con- Haldoupis, C., K. Schlegel, and D. T. Farley (1996), An explanation for the
type‐1 radar echoes from the mid‐latitude E‐region ionosphere, Geophys.
ductivity, so that the polarization electric field can be Res. Lett., 23, 97–100, doi:10.1029/95GL03585.
maintained. It must be remembered that the QP echoes were Huang, C.‐M., E. Kudeki, S. J. Franke, C. H. Liu, and J. Rottger (1995),
short‐lived during the eclipse, which could mean that the Brightness distribution of midlatitude E region echoes detected at the
required polarization electric fields were available only for Chung‐Li VHF radar, J. Geophys. Res., 100, 14,703–14,715, doi:10.1029/
95JA00133.
a short duration. It may also be noted that if the gradients Hysell, D. L., M. Yamamoto, and S. Fukao (2002), Imaging radar observa-
are sufficiently steep, these polarization electric fields need tions and theory of type I and type II quasi‐periodic echoes, J. Geophys.
not be large to produce the instability. From the equatorial Res., 107(A11), 1360, doi:10.1029/2002JA009292.
Hysell, D. L., E. Nossa, M. F. Larsen, J. Munro, M. P. Sulzer, and S. A.
region, Sridharan et al. [2002] observed significantly large González (2009), Sporadic layer observations over Arecibo using coher-
enhancements of the VHF backscatter, with ‘bursty’ type of ent and incoherent scatter radar: Assessing dynamic stability in the
echoes from the E‐region during a partial solar eclipse. lower thermosphere, J. Geophys. Res., 114, A12303, doi:10.1029/
This was attributed to the generation of steep electron 2009JA014403.
Kelley, M. C., D. Riggin, R. F. Pfaff, W. E. Swartz, J. F. Providakes, and
density gradients associated with blanketing Es. Apart from C.‐S. Huang (1995), Large amplitude quasiperiodic fluctuations associ-
this, gravity waves that are generated in the MLTI region ated with a midlatitude sporadic E layer, J. Atmos. Terr. Phys., 57, 1165–
during solar eclipses [Altadill et al., 2001] also might have 1178, doi:10.1016/0021-9169(94)00130-G.
Larsen, M. F. (2000), A shear instability seeding mechanism for quasiperi-
aided the formation of QP striations, but we do not have odic radar echoes, J. Geophys. Res., 105, 24,931–24,940, doi:10.1029/
concrete evidence for this. 1999JA000290.
[14] The present observations from the mid‐latitudes con- Maruyama, T. (1995), Shapes of irregularities in the sporadic E layer pro-
ducing quasi‐periodic scintillations, Radio Sci., 30, 581–590,
firm that the mid‐latitude Es plasma process is mainly con- doi:10.1029/95RS00830.
trolled by the density gradients, plausibly generated by a Maruyama, T., S. Fukao, and M. Yamamoto (2000), A possible mechanism
highly dynamic wind system existing in the mid‐latitudes for echo striation generation of radar backscatter from midlatitude spo-
even during daytime, but QP echoes are not observed radic E, Radio Sci., 35, 1155–1164, doi:10.1029/1999RS002296.
Miller, K. L., and L. G. Smith (1978), Incoherent scatter radar observations
possibly due to the continuous supply of background ion- of irregular structure in mid‐latitude sporadic E layers, J. Geophys. Res.,
ization, which prevents the formation and sustenance of 83, 3761–3775.
5 of 6L09107 THAMPI ET AL.: QP ECHOES INDUCED BY SOLAR ECLIPSE L09107
Ogawa, T., O. Takahashi, Y. Otsuka, K. Nozaki, M. Yamamoto, and Yamamoto, M., S. Fukao, R. F. Woodman, T. Ogawa, T. Tsuda, and S. Kato
K. Kita (2002), Simultaneous middle and upper atmosphere radar (1991), Midlatitude E region field‐aligned irregularities observed with the
and ionospheric sounder observations of mid‐latitude irregularities MU radar, J. Geophys. Res., 96, 15,943–15,949, doi:10.1029/91JA01321.
and sporadic E layer, J. Geophys. Res., 107(A10), 1275, doi:10.1029/ Yamamoto, M., S. Fukao, T. Ogawa, T. Tsuda, and S. Kato (1992), A mor-
2001JA900176. phological study on midlatitude field aligned irregularities observed with
Patra, A. K., R. K. Choudhary, and J.‐P. St. Maurice (2009), Solar eclipse‐ the MU radar, J. Atmos. Terr. Phys., 54, 769–777, doi:10.1016/0021-9169
induced E‐region plasma irregularities observed by the Gadanki radar, (92)90115-2.
Geophys. Res. Lett., 36, L13105, doi:10.1029/2009GL038669. Young, J. M., C. Y. Johnson, and J. C. Holmes (1967), Positive ion compo-
Saito, S., M. Yamamoto, H. Hashiguchi, and A. Maegawa (2006), Observa- sition of a temperate‐latitude sporadic E layer as observed during a rocket
tion of three dimensional structures of quasi‐periodic echoes associated flight, J. Geophys. Res., 72, 1473–1479, doi:10.1029/JZ072i005p01473.
with mid‐latitude sporadic E layers by MU radar ultramulti‐channel sys- Zhang, X. R., T. Sato, I. Kimura, S. Fukao, and S. Kato (1991), Profiles
tem, Geophys. Res. Lett., 33, L14109, doi:10.1029/2005GL025526. of electron density in the lower ionosphere observed by the MU radar,
Sridharan, R., C. V. Devasia, N. Jyoti, D. Tiwari, K. S. Viswanathan, J. Geomagn. Geoelectr., 43(3), 179–187.
and K. S. V. Subbarao (2002), Effects of solar eclipse on the electro- Zhou, Q. H., and Y. T. Morton (2005), Incoherent scatter radar study of
dynamical processes of the equatorial ionosphere: A case study during photochemistry in the E‐region, Geophys. Res. Lett., 32, L01103,
11 August 1999 dusk time total solar eclipse over India, Ann. Geophys., doi:10.1029/2004GL021275.
20, 1977–1985.
Van Zandt, T. E., R. B. Norton, and G. H. Stonehocker (1960), Photo‐
H. Liu, S. V. Thampi, and M. Yamamoto, Research Institute for
chemical rates in the equatorial F2 region from the 1958 eclipse, J. Geophys. Sustainable Humanosphere (RISH), Kyoto University, Kyoto 611‐0011,
Res., 65, 2003–2009, doi:10.1029/JZ065i007p02003. Japan. (smithathampi.rish@gmail.com)
Whitehead, J. D. (1966), Mixtures of ions in the wind shear theory of spo-
Y. Otsuka, Solar‐Terrestrial Environment Laboratory, Nagoya University,
radic E, Radio Sci., 1, 198–203. Furo‐cho, Chikusa‐ku, Nagoya 464‐8601, Japan.
Whitehead, J. D. (1989), Recent work on mid‐latitude and equatorial A. K. Patra, National Atmospheric Research Laboratory, Gadanki 517
sporadic E, J. Atmos. Terr. Phys., 51, 401–424, doi:10.1016/0021-9169
112, India.
(89)90122-0. S. Saito, Electronic Navigation Research Institute, 7‐42‐23 Jindaijihigashi‐
Woodman, R. F., M. Yamamoto, and S. Fukao (1991), Gravity wave
machi, Chofu, Tokyo 182‐0012, Japan.
modulation of gradient drift instabilities in mid‐latitude sporadic E irreg-
ularities, Geophys. Res. Lett., 18, 1197–1200, doi:10.1029/91GL01159.
6 of 6You can also read