CORPORATE PRESENTATION - DATA AS OF SEP-18 PRO-FORMA FOR PAVILION ACQUISITION AND EURCENTER DISPOSAL
←
→
Page content transcription
If your browser does not render page correctly, please read the page content below
CORPORATE
            PRESENTATION
DATA AS OF SEP-18 PRO-FORMA FOR
       PAVILION ACQUISITION AND
            EURCENTER DISPOSAL
                     February 2019

                    REAL ESTATE SIIQ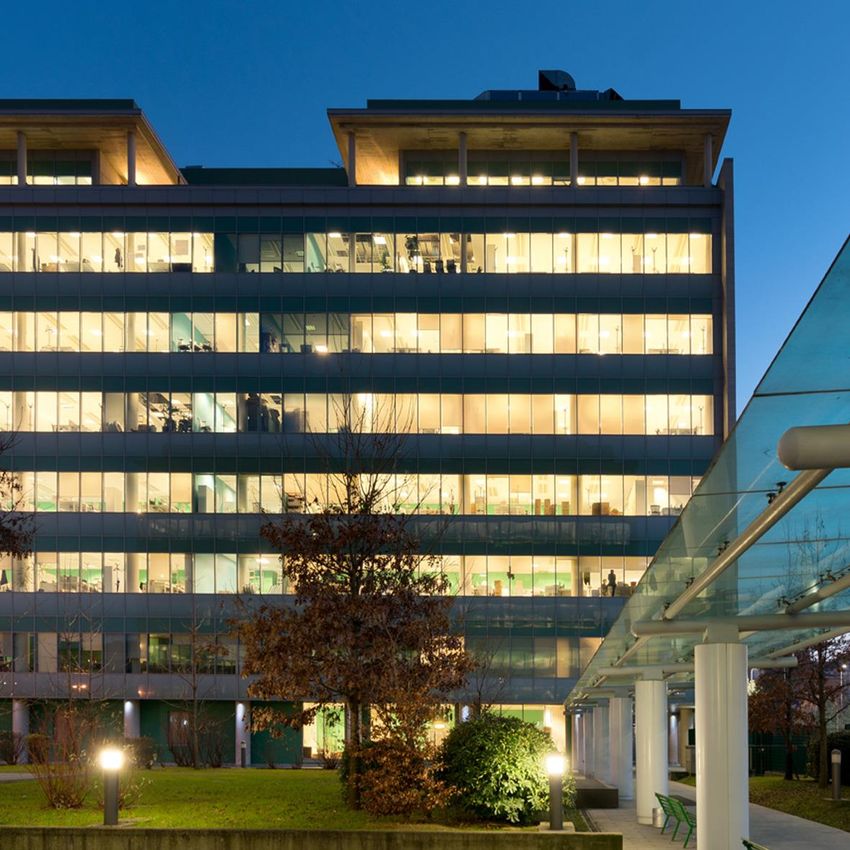
COIMA – A VERTICALLY INTEGRATED PLATFORM

     LEGACY & TRACK RECORD                   PRIVATE & LISTED FORMAT

         ESTABLISHED IN 1974

      2 MILLION SQM DEVELOPED

             €5 BILLION
     ASSETS UNDER MANAGEMENT

                                                PARTNER TO BLUE CHIP
     MULTI ASSET EXPERTISE                          INVESTORS

     LOGISTICS             RESIDENTIAL
                                         PRIMARY ASIAN
                                         PENSION FUND

                  OFFICE

    HOSPITALITY              RETAIL

                                                               CORPORATE PRESENTATION   2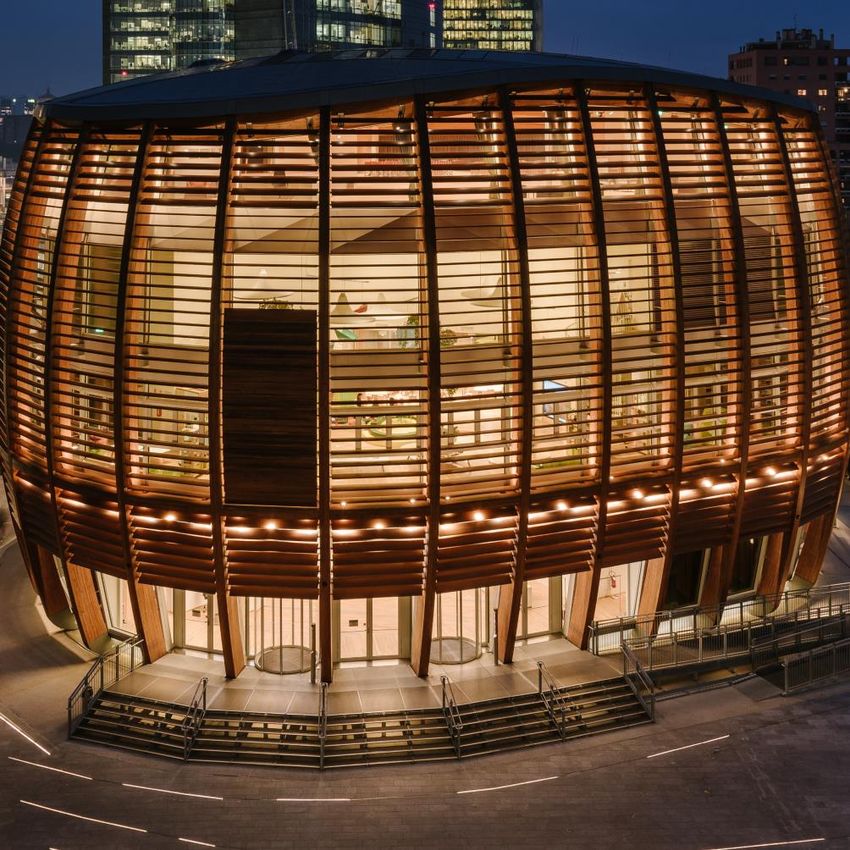
COIMA – 50% SHARE OF GRADE A MILAN OFFICES

  OVER 10 BUILT TO SUIT HQs          APPROX. 1 MILLION SQM      OVER 15,000
  DEVELOPED IN THE LAST              OF GRADE A OFFICES         CORPORATE EMPLOYEES
  15 YEARS                           DEVELOPED                  RELOCATED

   BANCA AKROS            DELOITTE            SAMSUNG        UNICREDIT            NIKE

   BNP PARIBAS            GOOGLE               PHILIPS       MICROSOFT           HSBC

                                                                              CORPORATE PRESENTATION   3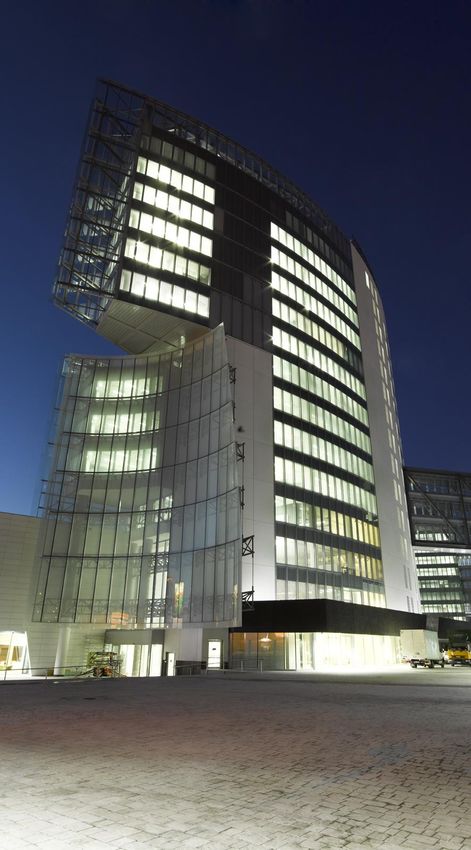
COIMA RES – THE ONLY ITALIAN OFFICE REIT

                   1   THE GATEWAY TO ITALIAN REAL ESTATE
                       THE ONLY ITALIAN OFFICE REIT

                   2   FOCUSSED PORTFOLIO
                       €640m GAV, 80% OFFICES, 90% IN MILAN, 34% IN PORTA NUOVA

                   3   GROWTH POTENTIAL
                       44% OF ASSETS WITH A GROWTH PROFILE

                   4   CONSERVATIVE LEVERAGE
                       35% LTV, 2% COST

                   5   BEST IN CLASS GOVERNANCE
                       7 OF 9 BOARD MEMBERS ARE INDEPENDENT

                   6   TRANSPARENCY
                       EPRA GOLD AWARD IN REPORTING TWO YEARS IN A ROW

                   7   SUSTAINABILITY
                       60% OF PORTFOLIO LEED CERTIFIED

                                                                       CORPORATE PRESENTATION   4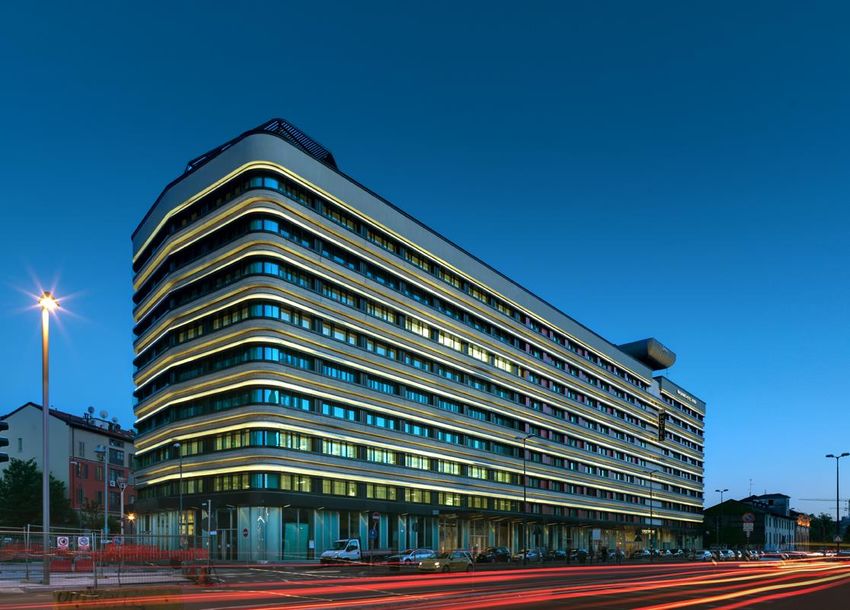
COIMA RES – ATTRACTIVE RETURN PROFILE

      NAV GROWTH & RETURN ON EQUITY                                                            FUNDAMENTALS, UPSIDE & YIELD

                                                                                   11.10

                                                                                           3%                     40%
                                                                           10.97
                             RETURN ON
  NAV GROWTH
                               EQUITY1
  +7% IN L12M                                                     10.78
                             +9% IN L12M
 +14% SINCE IPO
                            +18% SINCE IPO                10.68

                                                                                           LIKE FOR LIKE RENTAL   UPSIDE ON CONSENSUS
                                                                                           GROWTH IN MILAN        TARGET PRICES
                                                  10.39
                                          10.34

                                  10.15
                          10.06

                  9.89
          9.79

                                                                                           4%                     7%
   9.76

                                                                                           DIVIDEND YIELD         IMPLIED NET
                                                                                                                  PORTFOLIO YIELD

                             EPRA NAV per share

                  Note:
                  1)         Calculated as EPRA NAV per share growth plus dividend paid                               CORPORATE PRESENTATION   5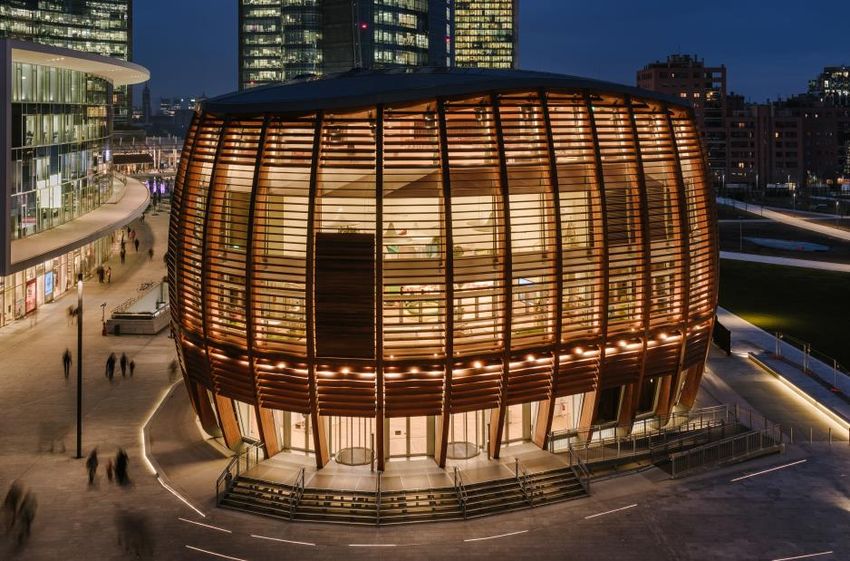
Portfolio and value creation

Financials

Appendix

                               01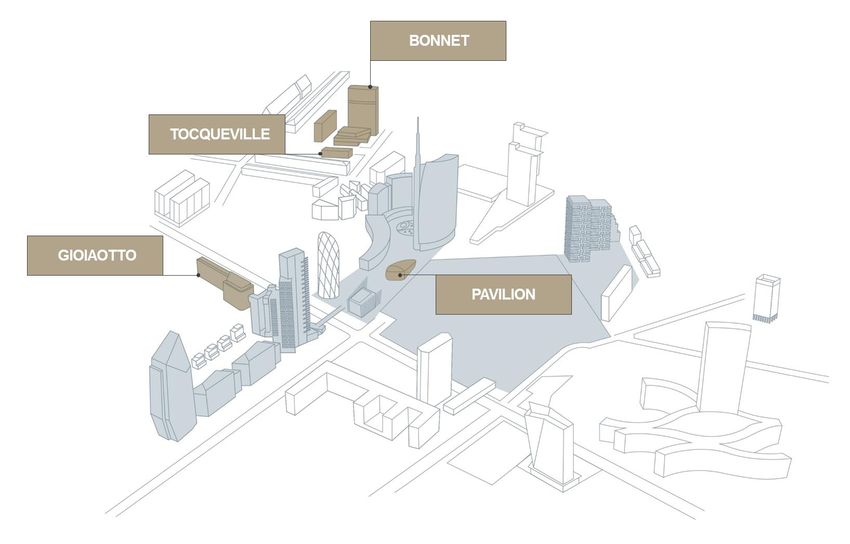
DISCIPLINED EXECUTION SINCE IPO
IPO PLAN VS ACTUAL DELIVERY PORTFOLIO EVOLUTION SINCE IPO1
“IPO proceeds to be invested over 2 years” ✓
– Investment programme completed in ~ 24 months IPO2 Today
“Maintain LTV below 50%” ✓
– More conservative LTV maintained (below 40%)
“Pay first dividend 24 months from IPO” ✓
– First dividend paid 12 months earlier vs IPO plan
Offices 0% ~80%
"Focus on commercial real estate in Italy" ✓
– Created a high quality Milan office focused portfolio
Additional achievements
Milan €570m of bank debt
– Cost maintained at ~ 2.0%, maturity extended to ~ 5 years
Received EPRA Gold Award 2 years in a row
Growth
– Annual Report and Sustainability Report for 2016 and 2017 0% ~44%
assets
Joined European Innovation & Sustainability Think Tank with five
other leading REITs
Notes:
1) Figures expressed as a % of Gross Asset Value
2) The initial IPO portfolio consisted of 96 Deutsche Bank branches spread across Italy worth €140m
CORPORATE PRESENTATION 7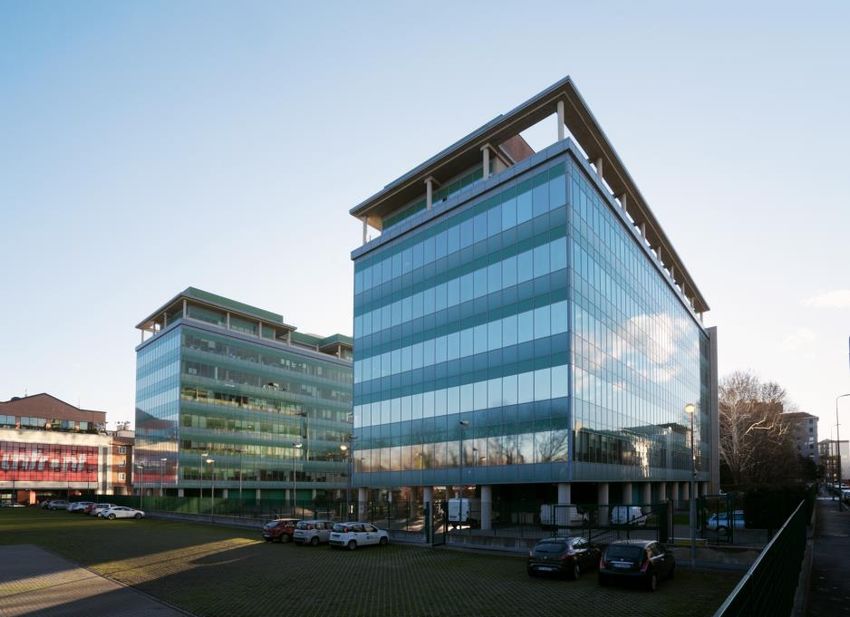
PORTFOLIO - OVERVIEW1
A €640m high quality portfolio focused on Milan offices with a 44% “growth” component

                                       CORE                                                                        CORE +                                              VALUE-ADD

  €640 MILLION
  GROSS ASSET
     VALUE
  (PRO-FORMA)
                                       CORE                                                                                                                            Bonnet – Milan

  5.0% EPRA NET                                                                                                                                                         Value-add
   INITIAL YIELD                                                          Gioiaotto – Milan        Pavilion – Milan    Tocqueville – Milan   Monte Rosa – Milan      (being upgraded)
                                                                                                                                                                  ~ 14% of growth assets
                                                                                      Core +                                        Core +
 5.8% EXPECTED                                                              (rental growth and capital                        (rental growth and
 NET STABILISED                                                               appreciation potential)                       candidates for upgrade)
      YIELD           Vodafone – Milan          Deruta – Milan               ~ 44% of growth assets                         ~ 42% of growth assets

 6.7 YEARS WALT

  4.5% VACANCY
                                                                                                                        Growth assets
                                                                                                                         ~ 44% of GAV
   80% OFFICES                      Deutsche Bank                                                                      (4.6 years WALT)
                                     Core
                                ~ 56% of GAV
                              (7.5 years WALT)

   Asset in Milan Porta Nuova

              Note:
              1)      Data as of September 30th, 2018, pro-forma for Pavilion acquisition and Eurcenter disposal                                            CORPORATE PRESENTATION      8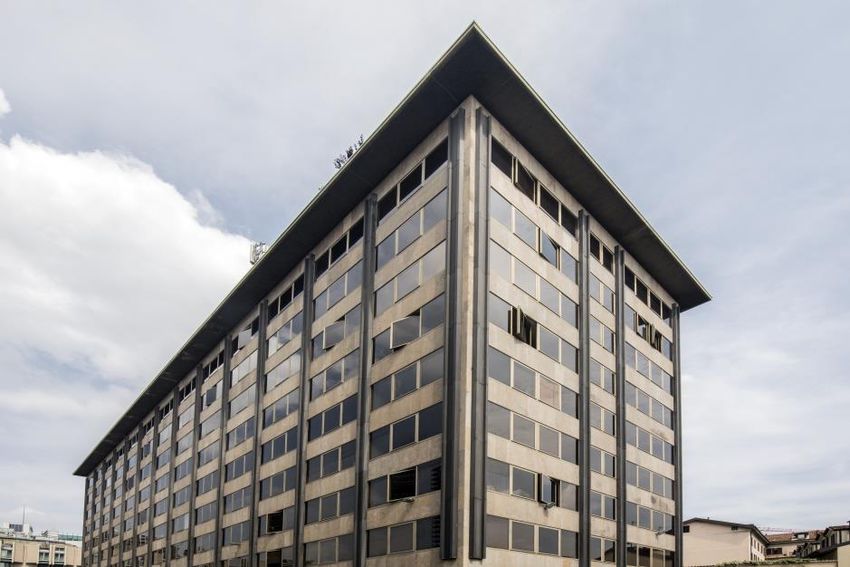
PORTFOLIO - BREAKDOWN1
34% of COIMA RES assets are in Milan Porta Nuova, a fast growth business district in Milan
  BREAKDOWN BY USE2,3                                                                                     BREAKDOWN BY GEOGRAPHY

              Bank
            Branches
              15%
                                                                                                                        Other             Milan               ~ 90%
    Hotel                                                                                                               14%               Porta             of portfolio
     4%                                                                                                                                   Nuova
                                                                                                                                                             in Milan
                                                                   ~ 80%                                                                   34%            (vs 72% as of Dec-17)
                                     Office
                                      81%                  of portfolio made
                                                            of office assets
                                                               (stable vs Dec-17)
                                                                                                                                                                34%
                                                                                                           Milan                                           of portfolio
                                                                                                           others
                                                                                                            52%
                                                                                                                                                         in Porta Nuova
                                                                                                                                                          (vs 18% as of Dec-17)

  BREAKDOWN BY STRATEGY                                                                                   BREAKDOWN BY TENANT

                Value-                                                                                                          Other
                 add                                                                                            NH Hotel
                                                                                                                                 9%
                 6%                                                                                               4%
                                                                                                             PwC
                                         Core
                                         56%
                                                                                                              5%                          Vodafone             > 70%
                                                                     44%                                Techint                             38%
                                                                                                                                                           of portfolio
   Core +                                                   of portfolio with                             5%
    38%
                                                                                                                                                            leased to
                                                            growth features                                Sisal
                                                              (vs 27% as of Dec-17)                         6%                                          investment-grade
                                                                                                                                                             tenants
                                                                                                                 IBM
                                                                                                                  9%                    Deutsche
                                                                                                                           BNP            Bank
                                                                                                                           10%            14%

                   Note:
                   1)      Data as of September 30th, 2018, pro-forma for Pavilion acquisition and Eurcenter disposal
                   2)      Office portion includes c. 2,200 sqm of ground floor retail
                   3)      Pavilion classified as office space
                                                                                                                                                     CORPORATE PRESENTATION       9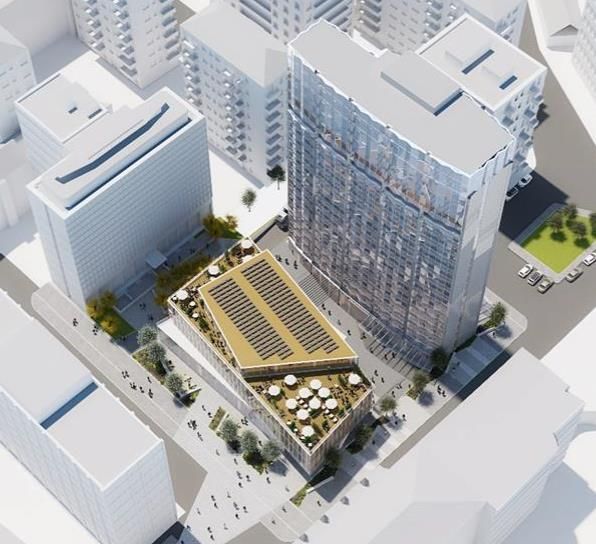
PORTFOLIO - DETAILS                                                            (SEP-18, PRO-FORMA FOR PAVILION ACQUISITION AND EURCENTER DISPOSAL)

                                             DEUTSCHE           VODAFONE
                                                                                  GIOIAOTTO1           BONNET             DERUTA         MONTE ROSA         TOCQUEVILLE          PAVILION            TOTAL
                                               BANK              VILLAGE

                                                                                      Milan              Milan                                                   Milan              Milan
Location                                     Across Italy          Milan                                                   Milan              Milan                                                      -
                                                                                    P. Nuova           P. Nuova                                                P. Nuova           P. Nuova

Asset class                                  Bank Branch           Office         Office, Hotel      Office, Retail        Office             Office             Office            Office                -

Product type                                     Core               Core             Core +           Value-add             Core              Core +            Core +             Core +                -

% of ownership                                  100.0%            100.0%              86.7%             35.7%             100.0%             100.0%             100.0%            100.0%                 -

Gross Asset Value (“GAV”)                      €98.9m            €209.1m             €77.0m            €38.0m2            €51.9m             €60.4m             €58.5m            €46.3m            €640.0m

WALT (years)                                      8.1                8.3               5.8                1.9                3.3               4.3                1.86              9.07                6.7

EPRA occupancy rate                              82%               100%               100%                n.a.             100%                91%               100%              100%7              95.5%

Gross initial rent                              €5.1m             €14.0m              €3.5m             €0.3m2             €3.6m              €3.7m             €2.4m              €1.3m7            €33.9m

EPRA net initial yield                           4.3%               6.2%              4.0%                n.a.              6.3%               5.0%              3.6%              2.4%7               5.0%

Expected net stabilised yield5                   5.0%3              6.2%              4.9%               5.7%4              6.3%               5.6%              4.9%4              7.2%               5.8%

                     Notes:
                     1) Financial figures consider Gioiaotto as being 100% consolidated
                     2) Including Bonnet on a look through basis
                     3) Calculated excluding vacant branches
                     4) Calculated including expected capex (soft and hard costs)
                     5) The Expected Net Stabilised Yield reflects in the numerator the stabilised NOI plus any other asset-management initiatives. In the denominator, it reflects the current appraised asset
                         value plus capex or other expenditures expected to generate incremental income included in the numerator
                     6) Not considering break options given under-rented nature of the asset
                     7) From the date in which the IBM leasing contract becomes effective, i.e. Q1 2019
                                                                                                                                                                                   CORPORATE PRESENTATION         10
PORTA NUOVA - OVERVIEW
34% of COIMA RES assets are in Milan Porta Nuova, the most sustainable & innovative business district in Italy
HIGHEST
CONCENTRATION OF
COIMA SGR AWARDS: LEED BUILDINGS IN
ITALY
“BEST URBAN (31 EXISTING
REGENERATION + 9 IN PIPELINE)
PROJECT - Porta Nuova”
MIPIM (2018) +10% RENTAL AND
OCCUPANCY GROWTH
“BEST OFFICE & FORECAST
BUSINESS (2019-2021)
DEVELOPMENT -
Fondazione Feltrinelli & 38 PRIME CORPORATE
Microsoft House” TENANTS, MORE
MIPIM (2018) EXPECTED TO JOIN
“BEST TALL BUILDING HOME TO 35,000+
WORLDWIDE - Bosco EMPLOYEES
Verticale”
CTBUH (2015) +30% EXPECTED
INCREASE IN NUMBER
OF EMPLOYEES
(2018-2022)
COIMA RES ASSETS IN PORTA NUOVA
Source: Green Street Advisors, COIMA CORPORATE PRESENTATION 11EURCENTER - VALUE CREATION IN DISPOSALS
Asset sold for €90.3m: 13% premium to acquisition price, 20% levered IRR
DISPOSAL OF MATURE ASSET
IN ROME 2016 2016-2018 2018
SALE AT 13% PREMIUM TO
ACQUISITION PRICE AND AT ACQUISITION ASSET DISPOSAL
4% PREMIUM TO LAST BOOK MANAGEMENT
VALUE
LEVERED IRR OF 20% Eurcenter €6.4m revaluation Eurcenter disposal
(UNLEVERED IRR OF 11%) acquisition booked for Eurcenter for €90.3m
for €80.2m
IMPLIED NET STABILISED EXIT
YIELD OF 4.75% IN LINE WITH
ROME EUR PRIME YIELD 5.4% Net Initial Yield 5.3% Net Initial Yield 3.6% Net Initial Yield1
Project to increase Total capital gain of
the Eurcenter net €6.5m to be booked in
rentable area by 3.1% 2018
authorised in May
2017
Note:
1) Considering expected net rent of €3.2m in 2019 given AXA portion will be vacated from December 31th, 2018 CORPORATE PRESENTATION 12PAVILION / IBM - VALUE CREATION IN LEASING
Achieved > 200 bps additional yield vs underwriting plan and brought forward cash flow by 3 years
Signed preliminary purchase agreement with UniCredit in May 2018 for €46.3m (c. 3,200 sqm NRA)
Signed a 9 + 6 years lease agreement with IBM in August 2018 for 100% of the complex
LEASING TO SINGLE BLUE CHIP – effective from Q1 2019
TENANT (IBM) – initial gross rent of c. €400/sqm increasing to c. €1,000/sqm after the first 12 months
No material capex for COIMA RES to host IBM in the Pavilion
NO MATERIAL CAPEX FOR Acquisition closed in Nov-18
COIMA RES Strong asset revaluation potential
CASH FLOW FROM YEAR 1 Capex /
Acquisition Capex Free Rent Full Rent
Free Rent
Underwriting ---
2018 2019 2020 2021 2022
EXPECTED NET STABILISED business plan
YIELD OF 7%+ at acquisition Cash flow for
negative negative zero positive
COIMA RES
Acquisition Incentivised Rent Full Rent Full Rent Full Rent
IBM ---
2018 2019 2020 2021 2022
leasing Cash flow for
positive positive positive positive
COIMA RES
CORPORATE PRESENTATION 13BONNET - VALUE CREATION IN RETROFIT
A “next generation” project in the heart of Porta Nuova
Value-add project in the heart of Milan Porta Nuova
– Joint venture1 between COIMA RES and COF II
Cutting edge sustainable and innovative technologies
– Award winning2 firm PLP Architecture leading the project
– Smart Building infrastructure: > 5,000 monitoring sensors, cloud based analytics
– Approx. 65% of energy use from renewable sources (NZEB)
– Targeting LEED Gold, WELL Gold and Cradle to Cradle certifications
Place-making
– Creation of a new public space (c. 2,500 sqm) Integrated
– ~ €1m to be invested in improving c. 6,000 sqm of public area Internet of
Things
– Seamless integration of streets connecting to Corso Como & Porta Nuova platform
VALUE CREATION AT EACH STEP OF THE PROCESS AIMED AT DELIVERING THE MOST COMPETIVE PRODUCT
ACQUISITION PRE-DEVELOPMENT DEVELOPMENT LEASING COMPLETION
Fast pre-development ~6% savings on
& entitlement process consultants Leasing activity Return targets
(12-18 months) formally commenced
“Off market”
General contractor in September 2018 Gross yield
acquisition at
+20% increase in appointed on budget on cost ~6%
attractive purchase
commercial areas LEED certification
price
(2 additional floors on LEED certification accelerates leasing Levered IRR ~12%
tower plus brand new ~7-11% valuation activity3 by 3x
building) premium3
Note:
1) COIMA RES owns 35.7% stake (remaining stake owned by COIMA Opportunity Fund II)
2) PLP Architecture track record includes high profile projects such as "The Edge" in Amsterdam (named the world's most sustainable building)
3) Based on study by Re+build, CBRE and GBCI CORPORATE PRESENTATION 14DEUTSCHE BANK - VALUE CREATION IN DERISKING
Sold c. 30% of initial IPO portfolio (€41.5m) at a valuation in line with IPO contribution value
PORTFOLIO AT IPO (MAY-16) DISPOSALS SINCE IPO CURRENT PORTFOLIO
#: 96branches1 #: 26 branches2 #: 70 branches3
Book Value @ IPO: €140.1m Sale Price: €41.5m Book Value @ Jun-18: €98.9m
Delta vs Book Value @ IPO: 0.1% premium
54 6 5 49 6
2 2
1 1
5 5
6 6
1 1 1 1
8 8
12 12
North North North
#: 67 branches #: 5 branches #: 62 branches (4 vacant)
Book Value @ IPO: €83.9m (60% of total) Sale Price: €3.5m Book Value @ Jun-18: €81.9m (83% of total)
Delta vs Book Value @ IPO: 1.7% premium
Centre Centre
#: 8 branches South #: 8 branches (1 vacant)
Book Value @ IPO: €17.0m (12% of total) #: 21 branches Book Value @ Jun-18: €16.9m (17% of total)
Sale Price: €38.0m
South
Delta vs Book Value @ IPO: 0.1% discount
#: 21 branches
Book Value @ IPO: €39.2m (28% of total)
Note:
1) of which 6 vacant
2) of which 1 branch sold in 2016 (North of Italy), 2 branches sold in 2017 (North of Italy), 21 branches sold in Jan-18 (South of Italy) and 2 branches sold Sep-18 (North of Italy)
3) of which 5 vacant (Livorno, Torino, Padova, Milano, Novedrate), ERV of vacant branches is €1.1m, Book Value of vacant branches is €11.9m as of June 30 th, 2018
CORPORATE PRESENTATION 15ASSET MANAGEMENT - PORTFOLIO ROTATION
Approx. €732m in acquisitions and €132m in disposals (at a blended premium of 8% to acquisition price)
OVERVIEW OF PORTFOLIO ROTATION SINCE IPO (€m)
800
Total disposals
worth 18% of total
600 acquisitions
400
732
522
200
106 104
-
(2) (39)
(92)
(132)
(200)
Disposals at 3% Disposals in line Disposals at 12% Disposals at 8%
premium to with acquisition premium vs premium vs
acquisition price price acquisition price acquisition price
(400)
2016 2017 2018 Total
Acquisitions Disposals
CORPORATE PRESENTATION 16PORTFOLIO - VALUE CREATION IN NUMBERS
Value creation of €40m since IPO (c. +6% capital growth)
CHANGE IN VALUE1 (€m)
50.0
Partially 40.3
Crystallised Strong revaluation
40.0 crystallised 34.4
through disposal expected
through disposals
30.0
20.0
11.7 10.1
10.0 4.8 5.9 4.8
0.3 1.8 - 0.8
Deutsche Vodafone Gioiaotto Eurcenter Bonnet Deruta Monte Pavilion Tocqueville Total Total
Bank Village Rosa (ex-Bonnet)
Change in value since IPO
CHANGE IN VALUE1 (%)
25.0%
20.0% 17.9% 18.4%
15.0% 12.6%
10.2%
10.0%
5.5% 4.9%
5.0% 2.4% 3.1%
0.2% 1.4%
-
-
Deutsche Vodafone Gioiaotto Eurcenter Bonnet Deruta Monte Pavilion Tocqueville Total Total
Bank Village Rosa (ex Bonnet)
Change in value since IPO
Note:
1) Data as of September 30th, 2018 taking into account Eurcenter disposal and Pavilion acquisition taking into account revaluations as well as
capital gain or capital losses for assets sold CORPORATE PRESENTATION 17Portfolio and value creation
Financials
Appendix
02FINANCIAL HIGHLIGHTS (9M 2018)
BALANCE SHEET SEP-18 DEC-17 Δ% Δ
GAV1 €680.8m €610.7m 11.5% €70.1m
EPRA NAV per share €11.10 €10.68 3.9% €0.42
EPRA NNNAV per share €10.99 €10.56 4.1% €0.43
LTV1,2 40.2% 38.1% n.m. 210 bps
INCOME STATEMENT 9M 2018 9M 2017 Δ% Δ
Gross Rents €26.7m €25.1m 6.3% €1.6m
NOI margin 89.2% 89.1% n.m. 10 bps
EPRA Earnings per share €0.33 €0.28 14.7% €0.05
Recurring FFO per share €0.35 €0.34 3.4% €0.01
All in cost of debt (blended) 2.03% 1.95% n.m. 8 bps
ICR 4.1x 3.1x n.m. 1.0x
OTHER INCOME STATEMENT METRICS Q3 2018 Q3 2017 Δ% Δ
Gross Rents €9.0m €8.4m 6.7% €0.6m
NOI margin 89.3% 89.5% n.m. (20) bps
EPRA Earnings per share €0.11 €0.10 10.3% €0.01
Recurring FFO per share €0.10 €0.12 (11.9%) (€0.02)
Notes:
1) Bonnet included on a look through basis, does not include Pavilion acquisition and Eurcenter disposal (not yet closed as of September 30th, 2018)
2) Net debt and LTV as of Dec-17 do not include the €22.7m current financial debt associated to the 21 Deutsche Bank branches sold in January 2018
CORPORATE PRESENTATION 19RETURN ON EQUITY & NAV GROWTH
RETURN ON EQUITY BREAKDOWN (ROLLING LAST TWELVE MONTHS)
12.0%
10.0% 9.1%
8.6%
8.0%
8.0% 6.7% 6.8%
6.1%
6.0% 4.2% 5.0% 5.6%
2.8% 2.3% 3.2%
4.0%
1.2% 1.1% 2.0% 2.0% 2.6% 2.6%
2.0%
2.8% 2.6% 1.7% 1.7% 1.0% 1.0%
0.0%
Jun-17 Sep-17 Dec-17 Mar-18 Jun-18 Sep-18
Retained earnings Dividends Revaluations
NAV PER SHARE GROWTH PROFILE
12.0 NAV per share Return on
11.5
11.4
11.5 11.1
growth Equity
10.9 11.0 11.0
11.0 10.7 10.8
10.3
10.5 10.4
10.5 +6.9% +9.1%
10.5 10.3
10.110.1 10.2 in L12M in L12M
9.8 9.8 9.9 9.9
10.0 9.8 9.8
9.5 +13.8% +17.7%
9.0 since IPO since IPO
8.5
At IPO Jun-16 Sep-16 Dec-16 Mar-17 Jun-17 Sep-17 Dec-17 Mar-18 Jun-18 Sep-18 +11.0% +14.8%
on IPO price of On IPO price of
NAV per share NAV per share plus dividends paid (cumulated) €10.00 €10.00
CORPORATE PRESENTATION 20LEVERAGE AND DEBT STRUCTURE
Weighted average debt maturity of 4.4 years, “all in” cost of debt of ~ 2.0%, gross debt c. 79% hedged (Sep-18)
LTV PROGRESSION1
40.2%
38.1%
Target LTV below 40% 34.8% 35.0% 35.4% 36.3% c. 35%
34.6%
29.2%
25.9%
8.6%
Jun-16 Sep-16 Dec-16 Mar-17 Jun-17 Sep-17 Dec-17 Mar-18 Jun-18 Sep-18 Pro-forma 2
GROSS DEBT MATURITY PROFILE (€m)
Debt deal signed on July 16th, 2018 (pool of banks: Banca IMI, BNP Paribas, ING, UniCredit)
– New debt for €70m for Monte Rosa and Tocqueville acquisition 246
– Refinancing of €149m of existing debt on Vodafone Village and Deutsche Bank
– Average maturity of 4.4 years (from 3.3 years as of June 30th, 2018)
– Average "all in" cost of debt at ~ 2.0%
On October 31st, 2018, signed with UniCredit a €27.0m3 financing for the Pavilion acquisition 45
– Secured debt, 5 years maturity, 1.80% “all in” cost
Reimbursed €47.9m of debt related to the Eurcenter disposal in Dec-18 2022 2023
Notes:
1) Bonnet included on a look-through basis
2) Pro-forma for the Pavilion acquisition and Eurcenter disposal CORPORATE PRESENTATION 21
3) Total financing is €31.5m, i.e. €27.0m acquisition financing and €4.5m VAT linePortfolio and value creation
Financials
Appendix
03COIMA RES - MILAN OFFICE ASSETS
PORTA NUOVA M3
M1
A B Hinterland M5
Sesto San
M2
Giovanni
M1 Bicocca
M2
Certosa
GIOIAOTTO BONNET
C D Maciachini Lambrate -
Fiera - Forlanini Segrate
City Life DC
B
G A F
Porta Nuova
M5 CBD
PAVILION TOCQUEVILLE
Historical
M1
Centre
City Center
M4
OTHER DISTRICTS Lorenteggio E
Inner City
Airport Linate
E F
M4
Navigli Ripamonti
M3
San Donato
Historical Centre Milanese
VODAFONE VILLAGE DERUTA
CBD and Porta Nuova
G Milanofiori
City Centre
Inner City
M2
Periphery
MONTE ROSA Business districts
Metro lines
CORPORATE PRESENTATION 23MILAN OFFICES - INVESTMENT ENVIRONMENT
Active investment market in 2018 (volumes 1.5x last 10 years average), despite being 13% lower than 2017 (which was
a record year). Yield compression of c. 10 bps for prime locations and 25 bps for secondary locations in 2018
MILAN OFFICES - INVESTMENT VOLUMES (€BN) MILAN OFFICE - MARKET LIQUIDITY IN CONTEXT1
Number of office transactions (% of total)
2.4 2.3 2.4 67% 65%
60% 63%
2.1 59%
1.8
10-year average = €1.4bn
37%
1.1 1.1
1.0 0.9
0.8 0.7 21% 22%18% 23%
20%
0.4 15% 14%
0.4 12%
4%
2006 2007 2008 2009 2010 2011 2012 2013 2014 2015 2016 2017 2018 2015 2016 2017 2018 2015-2018
Milan Rome Other cities
MILAN OFFICES - YIELD PROGESSION (%)
7.10% 7.10%
6.40% 6.30% 6.40% 6.25%
6.00%
5.50% 5.50% 5.30% 5.30% 5.30% 5.50% 5.50% 5.25%
5.20% 5.10% 5.00% 5.00%
4.75% 4.60% 4.60%
4.00% 3.75% 3.50% 3.40%
2006 2007 2008 2009 2010 2011 2012 2013 2014 2015 2016 2017 2018
Milan Prime Net Yield Milan Good Secondary Net Yield
Source: CBRE, C&W
Note:
1) Data on market liquidity for 2018 refers to H1 2018 CORPORATE PRESENTATION 24MILAN OFFICES - DEMAND & SUPPLY DYNAMICS
Record take up in Milan for 2018, strong supply & demand imbalance to persist in the foreseeable future
RECORD HIGH TAKE UP IN 2018 (’000 SQM) SUPPLY VS DEMAND IMBALANCE
Gap based on
historical
Demand take up:
300K c. 3x c. 200k sqm
supply
100K
+6% in 2018 Average take-up Expected supply
per annum (sqm) per annum (sqm)
390
370 367
304
277
245
STRONG EMPLOYMENT GROWTH IN MILAN
231
Approx. 62,000 new employees expected in 2018-2022
– Business services ~ 34,000 employees
55% 73% 76% 77% 67% 70% 64% – Professional services ~ 13,000 employees
– Manufacturing & energy ~ 9,000 employees
2012 2013 2014 2015 2016 2017 2018
– Others ~ 6,000 employees
Approx. 740,000 sqm of office space required1
Grade A Grade B+C – Equivalent to c. 150,000 sqm of office space per year
Sources: CBRE, JLL, Oxford Economics
Note:
1) Assuming 12 employees / sqm CORPORATE PRESENTATION 25MILAN OFFICES - STRONG RENTAL GROWTH
Milan top 5 city in Western Europe for rental growth in 2018 with a strong outlook in Milan Porta Nuova for 2019-2021
PRIME OFFICE RENTAL GROWTH (2018) OFFICE RENTAL AND OCCUPANCY GROWTH1
2019 2019-2021
Berlin +13.3% Madrid (CBD) +9.6% +9.1%
Madrid +10.4% Madrid (Inner City) +8.7% +10.6%
Lisbon +10.0% Madrid (North/East) +8.1% +3.2%
Barcelona +8.6% Berlin +7.7% +16.6%
€585/sqm in Q4 2018
Milan +6.4% Milan Porta Nuova +7.5% +9.9%
(from €550/sqm in Q4 2017)
Amsterdam +6.3% Paris (La Defense) +6.7% +1.1%
Barcelona (New
Frankfurt +5.3% +6.2% +15.9%
Business Areas)
Paris (CBD) +5.1% Frankfurt +6.2% +13.3%
Brussels +5.0% Paris (CBD) +6.2% +8.4%
Rome +2.3% Barcelona (CBD) +5.4% +8.6%
Sources: JLL (2018 data), Green Street Advisors (2019-2021 data)
Note:
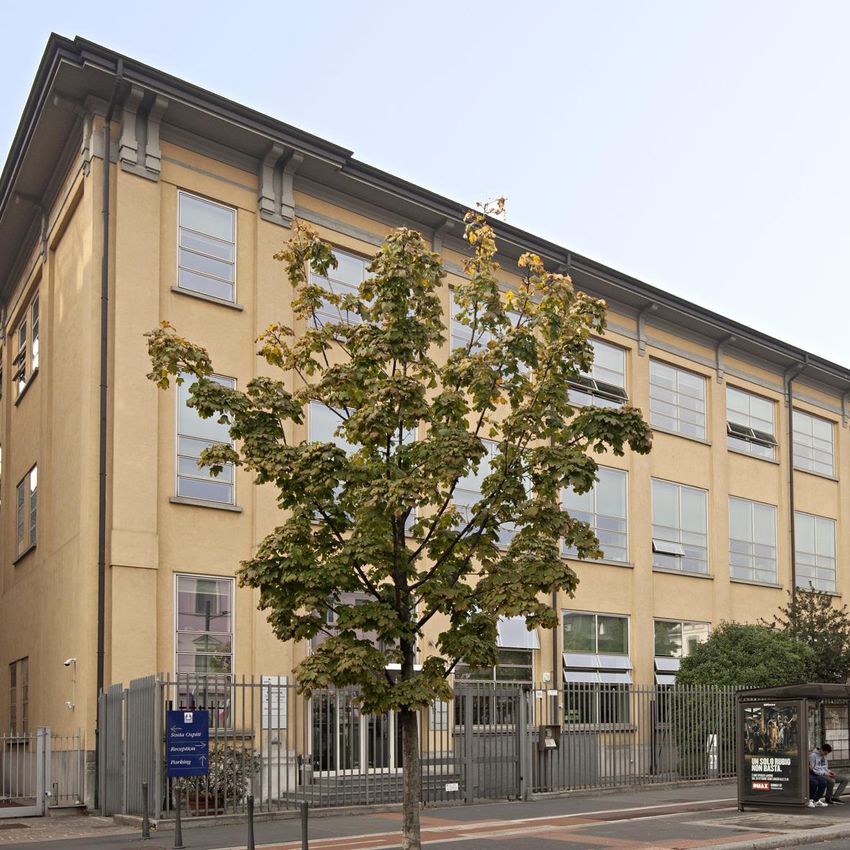
1) Metric is defined as RevPAM CORPORATE PRESENTATION 26VODAFONE VILLAGE
A LEED certified property in the Milan Lorenteggio District serving as Italian HQ for Vodafone
KEY DATA PICTURES
Construction Year 2012
Refurbishment Year n.a.
Acquisition Year by COIMA RES 2016
Asset Type Office
Tenant Vodafone
Surface 46,323 sqm
Fair Value €209.1 million
Gross Initial Rent €14.0m
EPRA Net Initial Yield 6.2%
WALT 8.3 years
EPRA Occupancy Rate 100%
Certification LEED Silver
Architect Gantes & Marini
Note: Data as of September 30th, 2018 CORPORATE PRESENTATION 27DERUTA
A modern office building in the Milan Lambrate district well connected with public transportation (subway)
KEY DATA PICTURES
Construction Year 2007
Refurbishment Year n.a.
Acquisition Year by COIMA RES 2017
Asset Type Office
Tenant BNL (BNP Paribas)
Surface 27,571 sqm
Fair Value €51.9 million
Gross Initial Rent €3.6m
EPRA Net Initial Yield 6.3%
WALT 3.3 years
EPRA Occupancy Rate 100%
Certification n.a.
Architect n.a.
Note: Data as of September 30th, 2018 CORPORATE PRESENTATION 28MONTE ROSA
An under-rented office building in the Milan City Life-Lotto district well connected with public transport
KEY DATA PICTURES
Construction Year 1942 / 1956 / 1961
Last Refurbishment Year 1997
Acquisition Year by COIMA RES 2017
Asset Type Office
Tenant Techint / PwC
Surface 19,539 sqm
Fair Value €60.4 million
Gross Initial Rent €3.7m
EPRA Net Initial Yield 5.0%
WALT 4.3 years
EPRA Occupancy Rate 91%
Certification n.a.
Architect n.a.
Note: Data as of September 30th, 2018 CORPORATE PRESENTATION 29GIOAOTTO
A LEED certified property in Milan Porta Nuova with embedded rental growth
KEY DATA PICTURES
Construction Year 1970s
Last Refurbishment Year 2014
Acquisition Year by COIMA RES 2016
Asset Type Hotel / Office
Tenants NH Hotel / Angelini / QBE / etc
Surface 15,256 sqm
Fair Value €77.0 million
Gross Initial Rent €3.5m
EPRA Net Initial Yield 4.0%
WALT 5.8 years
EPRA Occupancy Rate 100%
Certification LEED Platinum
Architect Park Associati
Note: Data as of September 30th, 2018 CORPORATE PRESENTATION 30TOCQUEVILLE
An under-rented and strategically located property in Milan Porta Nuova with meaningful growth potential
KEY DATA PICTURES
Construction Year 1969
Las Refurbishment Year 2003
Acquisition Year by COIMA RES 2018
Asset Type Office
Tenant Sisal
Surface 9,600 sqm
Fair Value €58.5 million
Gross Initial Rent €2.4m
EPRA Net Initial Yield 3.6%
WALT 1.8 years
EPRA Occupancy Rate 100%
Certification n.a.
Architect n.a.
Note: Data as of September 30th, 2018 CORPORATE PRESENTATION 31PAVILION
A unique property in Milan Porta Nuova leased to a blue chip tenant and with strong revaluation potential
KEY DATA PICTURES
Construction Year 2014
Refurbishment Year n.a.
Acquisition Year by COIMA RES 2018
Asset Type Office
Tenant IBM (from Q1 2019)
Surface 3,200 sqm
Acquisition price €46.3 million
Gross Initial Rent €1.3m (from Q1 2019)
Expected Net Stabilised Yield 7.2%
WALT 9.0 years (from Q1 2019)
EPRA Occupancy Rate 100% (from Q1 2019)
Certification LEED Gold
Architect Michele De Lucchi
Note: Data as of September 30th, 2018 CORPORATE PRESENTATION 32BONNET
A “next generation” project in the heart of Porta Nuova
Value-add project in the heart of Milan Porta Nuova Building A (high-rise office tower, 16,000 sqm GBA)
– Joint venture1 between COIMA RES and COIMA Opportunity Fund II – existing building, 100% vacant
– hard refurbishment
Building B (low-rise office tower, 6,200 sqm GBA)
Total project cost of €164m1 – existing building, currently >60% leased
– Purchase price: €89m – extraordinary maintenance works only
– Estimated capex: €58m Building C (new office / retail low-rise, 4,800 sqm GBA)
– Other capitalised expenses, including financing: €16m – new building (partially replacing underground parking)
– demolish and rebuild existing underground parking
– develop new office with ground floor retail
Leverage and target returns Bonnet
– Gross Yield on Cost: c. 6% (Corso
– Levered IRR: c. 12% Como
Place)
– Project Loan to Cost: c. 60%
Tocqueville (B) (A)
Project timeline
– Dec-16: Acquisition of the property (C)
– Jul-18: General contractor appointed & construction works started
– Sep-18: Commencement of commercialisation to tenants
– 2020: Expected completion of the works and delivery of the project
Note: CORPORATE PRESENTATION 33
1) COIMA RES owns 35.7% stake (remaining stake owned by COIMA Opportunity Fund II)DISCLAIMER
This presentation is not, and nothing in it should be construed as, an offer, invitation All forward–looking statements attributable to the Company or persons acting on
or recommendation in respect of any of the COIMA RES SpA SIIQ (the “Company”) its behalf apply only as of the date of this document, and are expressly qualified in
securities, or an offer, invitation or recommendation to sell, or a solicitation of an their entirety by the cautionary statements included elsewhere in this document.
offer to buy, any of the Company’s securities in any jurisdiction. Neither this The financial projections are preliminary and subject to change; the Company
presentation nor anything in it shall form the basis of any contract or commitment. undertakes no obligation to update or revise these forward–looking statements to
This presentation is not intended to be relied upon as advice to shareholders, reflect events or circumstances that arise after the date made or to reflect the
investors or potential investors and does not take into account the investment occurrence of unanticipated events. Inevitably, some assumptions will not
objectives, financial situation or needs of any investor. All investors should consider materialize, and unanticipated events and circumstances may affect the ultimate
such factors in consultation with a professional advisor of their choosing when financial results. Projections are inherently subject to substantial and numerous
deciding if an investment is appropriate. The Company has prepared this uncertainties and to a wide variety of significant business, economic and
presentation based on information available to it, including information derived competitive risks, and the assumptions underlying the projections may be
from public sources that have not been independently verified. No representation or inaccurate in any material respect. Therefore, the actual results achieved may vary
warranty, express or implied, is provided in relation to the fairness, accuracy, significantly from the forecasts, and the variations may be material.
correctness, completeness or reliability of the information, opinions or conclusions
expressed herein.
The financial information included in this presentation is unaudited.
CORPORATE PRESENTATION 34COIMA RES SpA SIIQ
Piazza Gae Aulenti, 12
20154 - Milano
Investor Relations – contact details
alberto.goretti@coimares.com | ir@coimares.com
www.coimares.comYou can also read