Brookfield India Real Estate Trust - Chittorgarh

Page created by Roland Garner
 
CONTINUE READING
Brookfield India Real Estate Trust - Chittorgarh
Page 1

   Brookfield India Real Estate Trust

IPO NOTE                      2nd February 2021
Brookfield India Real Estate Trust - Chittorgarh
India Equity Institutional Research II                     IPO Note                II 2nd February 2021                                                                      Page 2

 Brookfield India Real Estate Trust
    Issue Opens On                             Issue Closes On                   Price Band (INR)                  Issue Size (INR Cr.)                   Rating
    Feb 03, 2021                               Feb 05, 2021                      274-275                           3,800                                  SUBSCRIBE

    Brookfield REIT is India’s only institutionally managed public commercial real estate vehicle, sponsored by an affiliate of Brookfield
    Asset Management (“BAM”), one of the world’s largest alternative asset managers with approximately US$575 billion in assets
    under management, as of September 30, 2020. The goal of the entity is to be the leading owner of high-quality income producing
    commercial real estate assets in key gateway Indian markets, which have significant barriers to entry. Initial Portfolio comprises
    14.0 msf (10.3 msf completed area, 0.1 msf of under construction area and 3.7msf of future development potential. It has rights to
    acquire a further 8.3 msf and rights of first offer on an additional 6.7 msf, both currently owned by members of the Brookfield
    Group.

   OFFER STRUCTURE

     Particulars                                IPO Details       Indicative Timetable

                                               138,181,818 –      Offer Closing Date                                                                     Feb 05, 2021
     No. of shares under IPO (#)
                                              138,686,131         Finalization of Basis of Allotment                                              On or about 11th Feb-21
                                               138,181,818 –
     Net offer (# shares)
                                                138,686,131       Initiation of Refunds                                                           On or about 12th Feb-21

     Price band (INR)                              274-275        Designated Date                                                                On or about 12th Feb-21

     Issue Size (INR Cr.)                           3,800         Listing                                                                        On or about 17th Feb-21

     Source: IPO Prospectus                                       Source: IPO Prospectus

   Issue break-up                                                                                                            No. of shares (#)

   Institutional                                                                               Up to 75% of the Net Offer

   Non-Institutional                                                                           Up to 25% of the Net Offer

   Source: IPO Prospectus
    Particulars (In INR Cr)*                                                                                                                         INR Cr.
   Partial or full pre-payment or scheduled repayment of the existing indebtedness of the Asset
                                                                                                                                                       3,575
   SPVs
   General Corporate Purposes                                                                                                                            NA
   Total                                                                                                                                                 NA
  Source: IPO Prospectus

    Particulars (In INR Cr)*                                                     FY18                         FY19                    FY20                      Sep-20

   Revenue                                                                       8,218                       8,959                    9,567                       4,551

   EBITDA                                                                        5,438                        5,563                   5,936                       3,230

   EBITDA Margin                                                                 66.2%                        62.1%                   62.0%                       71.0%

   PAT                                                                            1,611                        -157                       151                      -738

   PAT Margin                                                                    19.6%                        -1.8%                    1.6%                       -16.2%

   Return on Capital                                                             62.4%                        11.6%                   10.4%                        6.0%

   Return on Equity                                                               -6.2%                       0.6%                    -0.7%                        3.0%

  Source: IPO Presentation, * Restated Consolidated, # Proforma Ind AS

ANALYST                                                                                     KRChoksey Research                Phone: +91-22-6696 5555, Fax: +91-22-6691 9576
Parvati Rai, head-research@krchoksey.com, +91-22-6696 5413                     is also available on Bloomberg KRCS        www.krchoksey.com
                                                                                 Thomson Reuters, Factset and Capital IQ
India Equity Institutional Research II                     IPO Note         II 2nd February 2021                                                                   Page 3

 Brookfield India Real Estate Trust
  INVESTMENT RATIONALE
  Stable Cash Flow Visibility backed with diversified tenant base:
  Of the Brookfield Initial Portfolio, 75% of gross contracted rentals are contracted with MNC, such as Barclays, Bank of America
  Continuum, RBS, Accenture, TCS and Cognizant, with tenant base operating in a diverse range of industries like technology, financial
  services, consulting etc. Initial Portfolio has a same store commitment occupancy of 92% with a long 7.1-year (Weighted Average
  Lease Expiry) WALE. Committed occupancy and a long 7.1-year WALE provides visibility of stable cash flow generation in coming
  years. Initial Portfolio’s Committed Occupancy has been above 94% at the end of the last four financial years, highlighting the
  stability of the business. During the period between 1st April 2015 and 30th September 2020, in-place rents per square feet have
  grown at a 4.8% CAGR, demonstrating the healthy rental growth achieved on the Initial Portfolio. Further Brookfield also provide
  services including property management, facilities management and support services to the Initial Portfolio, either internally or
  through CIOP (wholly owned subsidiary).

  Internal and External growth opportunity:
  Brookfield real estate assets have two source of growth 1) through opportunities to increase NOI from Initial Portfolio 2) Acquisition
  of additional properties.
  1) Increase in NOI: Combination of contractual lease escalations, 36% mark-to-market headroom to in-place rents, lease-up of
       vacant space and near-term completion of Under Construction Area to meet tenants’ expansion needs. As of date of the Offer
       Document, the Initial Portfolio is significantly de-risked with only 0.1 msf of Under Construction Area, which is expected to be
       completed by September 2021. These factors create a strong foundation for organic cash flow growth, such that the Initial
       Portfolio’s NOI is projected to grow by 25% (net of one-time adjustment) to INR 8,186 mn (including CIOP), over the Projections
       Period ending in FY 2023.
  2) Acquisition: Brookfield has exclusive right, at its discretion, to acquire the Identified Assets, one office park in each of Gurugram
       and Noida, that are near-stabilization and currently owned by members of the Brookfield Group. The Identified assets
       encompass 8.3 msf of office space. In addition, it has rights of first offer on the ROFO Properties - the Brookfield Group’s 100%
       owned commercial real estate assets in India’s financial capital, Mumbai, comprising 6.7 msf in office space. The Initial Portfolio,
       Identified Assets and ROFO Properties combined, creates the potential for us to almost double our Initial Portfolio’s Leasable
       Area to 28.9 msf, while growing consistent with our strategy of owning high quality real estate in premier locations.

  Difficult to Replicate, Dominant and Strategically Located Properties:
  Brookfield office park are among the highest quality office park in India distinguished by their size and scale and located in key
  market of Mumbai, Gurugram, Noida and Kolkata. Initial Portfolio office parks are modern and recently built, with a median age of
  seven years and require limited ongoing maintenance capital expenditures. They are strategically located in established micro-
  markets with easy access to mass transportation, high barriers to entry for new supply, limited vacancy and robust historical rental
  growth rates of which many of office parks command premium rents and have higher occupancies than the average rents and
  occupancies of the broader markets they are located within. Size and scale in key markets of India provide Brookfield with extensive
  market information and enhances ability to respond to market opportunities. On cost competitive basis, it is very difficult to replace
  these office parks as all the four office parks are among the largest in their micro-market and are distinguished by their scale and
  infrastructure.

  Global Sponsorship backed with local expertise:
  Brookfield India Real Estate Trust is sponsored by an affiliate of Brookfield Asset Management (BAM), one of the world’s largest
  alternative asset managers and investors, with assets under management of approximately USD 575 bn across real estate,
  infrastructure, renewable power, private equity and credit, and a global presence of over 150,000 operating employees across more
  than 30 countries, as of September 30, 2020. As of September 30, 2020, BAM has over USD 200 bn of real estate assets under
  management, and over 500 msf across multiple real estate asset classes, with strong real estate capabilities in leasing, financing,
  development, design, construction and property management. Brookfield has an extensive local market and knowledge in India.
  Brookfield has had a decade-long presence in India and manages a portfolio of approximately USD 17 bn across real estate (USD 4.6
  bn), infrastructure (USD 9.7 bn), renewable power (USD 0.6 bn) and private equity (USD 2.1 bn), as of 30th September 2020. This
  portfolio in India provides valuable real-time, proprietary market data that will enable REIT to identify and act on market conditions
  and trends more rapidly than its competitors.

  Experienced Senior Management Team:
  Prior to issue, all property of Initial Portfolio is owned and managed directly by Brookfield Asset Management Inc. (BAM). The team
  is equipped with a deep domain knowledge and experience in managing these properties and has demonstrated a robust track
  record in delivering value. Since April 1, 2015, the entity has leased 4.3 msf and delivered 3.6 msf of “on-campus” Completed Area
  within the Initial Portfolio.

ANALYST                                                                              KRChoksey Research             Phone: +91-22-6696 5555, Fax: +91-22-6691 9576
Parvati Rai, head-research@krchoksey.com, +91-22-6696 5413              is also available on Bloomberg KRCS     www.krchoksey.com
                                                                          Thomson Reuters, Factset and Capital IQ
India Equity Institutional Research II                     IPO Note             II 2nd February 2021                                                                     Page 4

 Brookfield India Real Estate Trust
  VALUATION & VIEW:
  Brookfield REIT’s Initial Portfolio consists of 14.0 msf of which 10.3 msf is completed, 0.1 msf area is under construction along with
  3.7 msf of future development potential. Initial Portfolio’s completed area has same store commitment occupancy of 92% with 75%
  of Gross Contractual Rental agreements with multinational corporations. 7.1-year WALE provides stability to the cash flows and is
  well positioned to achieve further organic growth through combination of contractual lease escalations, 36% mark-to-market
  headroom to in-place rents, lease-up of vacant space and near-term completion of Under Construction Area to meet tenants’
  expansion needs. We expect Brookfield to register a stable cash flow with current portfolio and headroom to further expand the
  space to lease out. Brookfield REITS has exclusive rights at their discretion to acquire the identified assets. At higher end of unit
  price of INR 275, it is available at steep discount of 11.6% to its NAV/ unit as of 30th September 2020 which stands at INR 311 NAV/
  unit. As of 14th Dec-20 its peers, Embassy office Park REIT and Mindspace Business Park REIT were trading at discount of 5.3% and
  3.0% respectively of its NAV/unit. Brookfield at 11.6% discount of its NAV/units provides a comfort to its valuation. Thus, we
  recommend a “SUBSCRIBE” rating for the IPO.
 Peer Valuation
 380                                                                           375                                                                                    0.0%
                                                                                                                                  -3.0%
 370
                                                                             -5.3%                                                                                    -4.0%
 360

 350                                                                                                                                                                  -8.0%

                                                                                                                                    338
 340                               336
                                                                                                                                                                      -12.0%
 330
                                -18.1%                                                                                                                                -16.0%
 320

 310                                                                                                                                                                  -20.0%
                        Brookfield REIT**                           Embassy Office Park REIT*                       Mindspace Business Park REIT*

                                                  NAV                                            Premium/ (Discount to NAV)
  Source: IPO Prospectus, KRChoksey Research
  Note: * NAV as on 14th Dec 2020.

  Based on the evaluation of the qualitative and quantitative factors listed below, the Unit Value at the Floor Price, the Cap Price
  and the Offer Price is as follows:

                                                                                   At Floor Price INR 274                                At Cap Price INR 275
  Equity Value (INR Cr)                                                                        8,296.8                                             8,327.0
  Premium/ (Discount) to NAV                                                                   -11.9%                                               11.6%
  Source: IPO Prospectus, KRChoksey Research

  KEY RISKS & CONCERNS
  Business and profitability are dependent on the performance of the commercial real estate market in India. Fluctuations in the
  general economic, market and other conditions may affect the commercial real estate market in India and in turn, REIT’s ability to
  lease office parks to tenants on favorable terms.

  A significant portion of revenue is derived from a limited number of tenants and sectors, and any adverse development affecting
  such tenants or sectors may have an adverse effect on business, results of operations and financial condition.

  A significant portion of revenue is derived from leasing activities at Candor Techspace G2 and any adverse development relating to
  Candor Techspace G2 or the micro-market in which it is located may adversely affect business, results of operations and financial
  condition.

ANALYST                                                                                  KRChoksey Research               Phone: +91-22-6696 5555, Fax: +91-22-6691 9576
Parvati Rai, head-research@krchoksey.com, +91-22-6696 5413                  is also available on Bloomberg KRCS       www.krchoksey.com
                                                                              Thomson Reuters, Factset and Capital IQ
India Equity Institutional Research II                      IPO Note              II 2nd February 2021                                                                    Page 5

 Brookfield India Real Estate Trust
  Company Overview
  Brookfield REIT is India’s only institutionally managed public commercial real estate vehicle, sponsored by an affiliate of Brookfield
  Asset Management (“BAM”), one of the world’s largest alternative asset managers with approximately USD 575 billion in assets
  under management, as of September 30, 2020, our goal is to be the leading owner of high-quality income producing commercial real
  estate assets in key gateway Indian markets, which have significant barriers to entry. Initial Portfolio comprises 14.0 msf (10.3 msf
  completed area, 0.1 msf of under construction area and 3.7msf of future development potential. It has rights to acquire a further 8.3
  msf and rights of first offer on an additional 6.7 msf, both currently owned by members of the Brookfield Group.

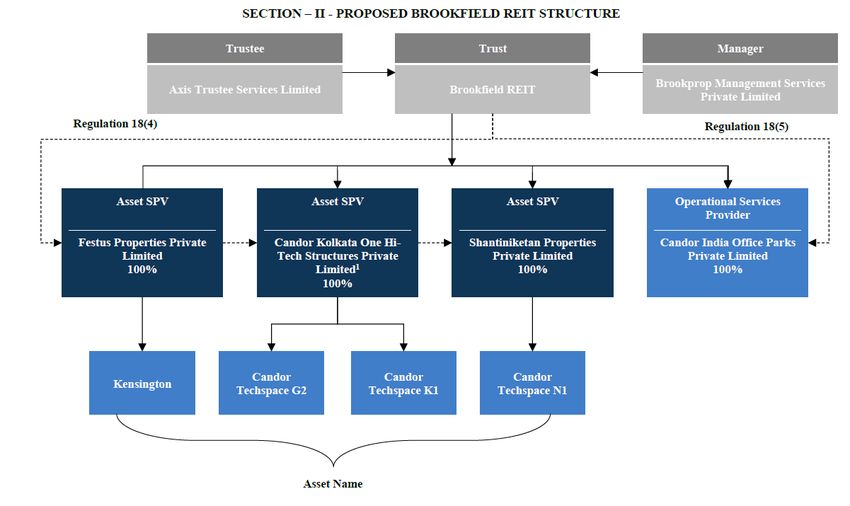
  Proposed Brookfield REIT Structure

  Initial Portfolio consist of four properties
  •    Kensington - Mumbai
  •    Candor Techspace G2 - Gurugram
  •    Candor Techspace N1 - Noida
  •    Candor Techspace K1 – Kolkata pg 133

                                                                            Candor       Candor                       Candor
 Particulars                                             Kensington                                                                       CIOP            Initial Portfolio
                                                                         Techspace G2 Techspace N1                 Techspace K1
 Type of Asset                                                 SEZ            SEZ        IT Park                   SEZ & Mixed                                      -
 Completed Area (msf)                                           1.5           3.9          1.9                           3.1                                      10.3
 Under Construction Area (msf)                                   -              -          0.1                            -                                        0.1
 Future Development Potential (msf)                              -            0.1          0.9                          2.7                                        3.7
 Total Area (msf)                                               1.5             4          2.8                          5.7                                        14
 Committed Occupancy (%)                                       86%            91%          72%                          92%                                       87%
 Same Store Committed Occupancy                                NA             NA           97%                          NA                                        92%
 WALE (years)                                                    3              8          7.6                          7.6                                        7.1
 Average in-place rent ₹/psf/month)                             90             78           45                           42                                        62
 FY23 NOI (₹ in mn)                                           1,580          3,213        1,342                        1,673               378                   8,186
 Market Value (₹ in mn)                                      25,374         43,582       19,736                       25,382                                   1,14,074
 % of Initial Portfolio Market Value                          22.2%          38.2%        17.3%                        22.3%               0.0%                 100.0%
Source: IPO Prospectus
ANALYST                                                                                    KRChoksey Research              Phone: +91-22-6696 5555, Fax: +91-22-6691 9576
Parvati Rai, head-research@krchoksey.com, +91-22-6696 5413                    is also available on Bloomberg KRCS      www.krchoksey.com
                                                                                Thomson Reuters, Factset and Capital IQ
India Equity Institutional Research II                       IPO Note                    II 2nd February 2021                                                                          Page 6

 Brookfield India Real Estate Trust
                                                                                              105.0%                           Commitment Occupancy
                                    Average Leasing Rent CAGR                                                                          98.0%
                                                                                                                    95.0%                                    96.0%
                      8.8%                                   9.3%
       10.0%                             8.0%                                                                                                                                      92.0%
                                                                                                   95.0%
                                             6.0%                  6.1%
                                                                            5.0%                                                       94.0%                 94.0%                 87.0%
                                                                                                                    93.0%                                                          92.0%
           5.0%             3.9%
                                                                                                   85.0%
                                                                                  1.8%
                                                                                                                    Dec-17            Dec-18      Dec-19                          Sep-17
           0.0%                                                                                                              Initial Portfolio
                    Kensington           Candor       Candor       Candor                                                    Micro-Market (Average)
                                      Techspace G2 Techspace N1 Techspace K1                                                 Same Store Committed Occupance
                             Property                        Micro-Market

                     Technology                                                                                                    Lease expiry Profile
                                               % Split by area Leased
           Analytics Hardware,                                                                                                                                                    100%
                         3%                                                                                                                                     89%
             , 1% HR                                           Others, 8%
                 Service,
           Healthcare,
                    1%                                                                                                                        33%               0.75
               2%
                                                                                                            5%                5%
                                                                                                           0.07               0               0.37                                 0.15
                                    Consulting,          Technology
                                                            , 50%                                         H2FY21          FY22         FY23                    FY24               FY25
                                       18%                                                                              Area Expiring (msf)

                                         Financial                                                                      Cumulative Expiry (%) (based on Area)
                                         Service,
                                            18%

                                          Kensington                                                                                Candor Techspace G2
  160
                    100%                135
                                                                                            105%

  140                                                126                     126            100%

                                                                                                                                                      139             139             144
  120               100                                                                             160

                                                                                                                                        128                                                        101%

                                                                                            95%     140
                                                                                                                         116                                                                       100%

  100
                                                             98%                                    120     100                                                                                    99%

   80                                  96%                                                  90%                                                                      100%                          98%

                                                                                                                        99%                           99%
                                                                                                    100
                                                                                                                                                                                                   97%

   60                                                                                       85%
                                                                                                     80                                                                                            96%

                                                                                                                                                                                                   95%
                                                                                                     60
   40
                                                                             86%
                                                                                                                                                                                                   94%
                                                                                                     40

   20
                                                                                            80%

                                                                                                           95%                         95%                                                         93%

                                                                                                                                                                                     94%
                                                                                                     20
                                                                                                                                                                                                   92%

       0                                                                                    75%       0                                                                                            91%

                  Dec-17              Dec-18             Dec-19             Sep-20                        Dec-15       Dec-16         Dec-17         Dec-18        Dec-19          Sep-20

                    Average Leasing Rent                Commitment Occupancy                                       Average Leasing Rent                   Commitment Occupancy

                                    Candor Techspace N1                                                                            Candor Techspace K1
                                                        152                 152                                                       132              126                      126
 160
                                                134                                  120%          140
                                                                                                                        117                    120                                          120%
 140                                   123                                           100%          120      100                                                                             100%
 120          100           107
                                                                                                   100
 100          95%          100%                    96%             98%               80%
                                                                                                                                      95%           99%                                     80%
                                        92%                                                         80                                                           90%            92%
  80                                                                                 60%
                                                                            72%                     60
                                                                                                            79%         80%                                                                 60%
  60
                                                                                     40%                                                                                                    40%
  40                                                                                                40
                                                                                     20%                                                                                                    20%
  20                                                                                                20
   0                                                                                 0%             0                                                                                       0%

            Dec-15        Dec-16      Dec-17      Dec-18       Dec-19     Sep-20                           Dec-15     Dec-16         Dec-17      Dec-18        Dec-19         Sep-20
                  Average Leasing Rent                 Commitment Occupancy                                       Average Leasing Rent                 Commitment Occupancy
           Source: IPO Prospectus

ANALYST                                                                                               KRChoksey Research                Phone: +91-22-6696 5555, Fax: +91-22-6691 9576
Parvati Rai, head-research@krchoksey.com, +91-22-6696 5413                         is also available on Bloomberg KRCS              www.krchoksey.com
                                                                                     Thomson Reuters, Factset and Capital IQ
India Equity Institutional Research II                     IPO Note         II 2nd February 2021                                                                   Page 7

 Brookfield India Real Estate Trust
  Financials:
  Ratio Analysis (%)                                                                                  FY18           FY19                 FY20                Sep-20
    EBITDA Margin                                                                                    66.2%          62.1%                62.0%                 71.0%
    PAT Margin                                                                                        19.6%          -1.8%                1.6%                -16.2%
    ROE                                                                                               -6.2%          0.6%                 -0.7%                 3.0%
    ROCE                                                                                             62.4%           11.6%                10.4%                6.0%
    Current Ratio (x)                                                                                  0.1            0.2                  0.6                  0.4
  Source: IPO Presentation

  Income Statement (INR Cr)                                                                           FY18           FY19                 FY20                Sep-20
       Revenues                                                                                       8,218         8,959                 9,567                4,551
            COGS                                                                                        52            49                    52                       5
       Gross profit                                                                                   8,166          8,910                9,515                4,546
            Employee cost                                                                              276            141                  251                  153
            Other expenses                                                                            2,452         3,206                 3,328                1,164
       EBITDA                                                                                         5,438          5,563                5,936                3,230
       EBITDA Margin                                                                                  66.2%          62.1%                62.0%                71.0%
            Depreciation & amortization                                                                903            957                 1,123                 606
       EBIT                                                                                           4,535         4,606                 4,814                2,623
            Interest expense                                                                          3,287         4,404                 7,141                3,485
            Other income                                                                               444            339                  247                  123
            Exceptional Item                                                                             0          (2,495)                  0                  (43)
       PBT                                                                                            1,735           541                  414                  -738
            Tax                                                                                        124           699                   263                       0
       PAT                                                                                             1,611          -157                 151                  -738
    Source: RHP

  Cashflow Statement (INR Cr)                                                                         FY18           FY19                 FY20                Sep-20
    Net cash flow from operating activities                                                              4,149         5,076                 5,322                   3,169
    Net cash flow used in investing activities                                                            (622)     (20,535)                     980                 (186)
    Net cash flow generated from / (used in ) in financing activities                                  (4,495)       15,694                (4,362)               (5,237)
    Net increase / (decrease) in cash and cash equivalents (A+B+C)                                       (968)              235              1,940              (2,254)
    Opening Cash and cash equivalents                                                                   2,058           1,090                1,326                   3,265
    Closing Cash and cash equivalents                                                                    1,090          1,326                3,265                       1,011
    Source: RHP

ANALYST                                                                              KRChoksey Research             Phone: +91-22-6696 5555, Fax: +91-22-6691 9576
Parvati Rai, head-research@krchoksey.com, +91-22-6696 5413              is also available on Bloomberg KRCS     www.krchoksey.com
                                                                          Thomson Reuters, Factset and Capital IQ
India Equity Institutional Research II                     IPO Note         II 2nd February 2021                                                                    Page 8

 Brookfield India Real Estate Trust
  Financials:

  INR Millions                                                                                       FY18            FY19                FY20E                Sep-20
  Share capital                                                                                       152            552                   652                   652
  Reserves and surplus                                                                             -26,341          -25,518             -22,849               -25,440
  Shareholders' funds                                                                              -26,189          -24,966              -22,197              -24,788
  Long-term borrowings                                                                             33,458           61,972              66,688                68,455
  Short term borrowings                                                                                0             2,622                1,741                   0
  Total debt                                                                                       33,458           64,593               68,430                68,455
  Deferred tax liabilities (net)                                                                     295             770                   639                   630
  Long-term provisions/ Other Liabilities                                                            287             256                   225                   280
  SOURCES OF FUNDS                                                                                  8,781           41,744               48,509                46,125
  PPE                                                                                                 89              92                   105                   117
  Other Intangible Assets                                                                              2               1                     1                        1
  Capital WIP
  Intangible Assets under development
  Non-current investments                                                                            166             420                   487                   487
  Goodwill                                                                                            25              22                    25                    28
  Other financial assets                                                                            2,087           3,596                 3,825                 3,652
  Non-current assets                                                                               43,552           48,100               49,507                49,215
  Inventories                                                                                       1,090            1,326                3,265                 1,011
  Trade receivables                                                                                  159              32                     1                    33
  Cash and Bank Balance                                                                             3,055              0                     0                    0
  Other current & financial assets                                                                   759              415                  558                   823
  Current assets                                                                                    5,381            2,337                4,273                 2,153
  less: current liabilities and provisions                                                         40,152           8,693                 5,271                 5,242
  Trade payables                                                                                       0               0                     0                    0
  Other current liabilities                                                                        30,500               -                    -                        -
  Other financial & current tax liabilities                                                         8,622           7,794                 4,091                 4,109
  Short-term provisions                                                                                2               2                     5                    4
  Net current assets                                                                               -34,771          -6,356                -998                 -3,090
  APPLICATION OF FUNDS                                                                              8,781           41,744               48,509                46,125
  Source: RHP

ANALYST                                                                              KRChoksey Research              Phone: +91-22-6696 5555, Fax: +91-22-6691 9576
Parvati Rai, head-research@krchoksey.com, +91-22-6696 5413              is also available on Bloomberg KRCS      www.krchoksey.com
                                                                          Thomson Reuters, Factset and Capital IQ
India Equity Institutional Research II                         IPO Note                          II 2nd February 2021                                                                        Page 9

 Brookfield India Real Estate Trust
   ANALYST CERTIFICATION:
   I, Parvati Rai (MBA-Finance, M.com), Head Research, author and the name subscribed to this report, hereby certify that all of the views expressed in this research report accurately reflect
   my views about the subject issuer(s) or securities. I also certify that no part of our compensation was, is, or will be directly or indirectly related to the specific recommendation(s) or view(s)
   in this report.

   Terms & Conditions and other disclosures:
   KRChoksey Shares and Securities Pvt. Ltd. (hereinafter referred to as KRCSSPL) is a registered member of National Stock Exchange of India Limited and Bombay Stock Exchange Limited.
   KRCSSPL is a registered Research Entity vides SEBI Registration No. INH000001295 under SEBI (Research Analyst) Regulations, 2014.

   We submit that no material disciplinary action has been taken on KRCSSPL and its associates (Group Companies) by any Regulatory Authority impacting Equity Research Analysis activities.

   KRCSSPL prohibits its analysts, persons reporting to analysts and their relatives from maintaining a financial interest in the securities or derivatives of any companies that the analyst covers.
   The information and opinions in this report have been prepared by KRCSSPL and are subject to change without any notice. The report and information contained herein is strictly confidential
   and meant solely for the selected recipient and may not be altered in any way, transmitted to, copied or distributed, in part or in whole, to any other person or to the media or reproduced in
   any form, without prior written consent of KRCSSPL. While we would endeavor to update the information herein on a reasonable basis, KRCSSPL is not under any obligation to update the
   information. Also, there may be regulatory, compliance or other reasons that may prevent KRCSSPL from doing so. Non-rated securities indicate that rating on a particular security has been
   suspended temporarily and such suspension is in compliance with applicable regulations and/or KRCSSPL policies, in circumstances where KRCSSPL might be acting in an advisory capacity to
   this company, or in certain other circumstances.

   This report is based on information obtained from public sources and sources believed to be reliable, but no independent verification has been made nor is its accuracy or completeness
   guaranteed. This report and information herein is solely for informational purpose and shall not be used or considered as an offer document or solicitation of offer to buy or sell or subscribe
   for securities or other financial instruments. Though disseminated to all the customers simultaneously, not all customers may receive this report at the same time. KRCSSPL will not treat
   recipients as customers by virtue of their receiving this report. Nothing in this report constitutes investment, legal, accounting and tax advice or a representation that any investment or
   strategy is suitable or appropriate to your specific circumstances. The securities discussed and opinions expressed in this report may not be suitable for all investors, who must make their
   own investment decisions, based on their own investment objectives, financial positions and needs of specific recipient. This may not be taken in substitution for the exercise of independent
   judgment by any recipient. The recipient should independently evaluate the investment risks. The value and return on investment may vary because of changes in interest rates, foreign
   exchange rates or any other reason. KRCSSPL accepts no liabilities whatsoever for any loss or damage of any kind arising out of the use of this report. Past performance is not necessarily a
   guide to future performance. Investors are advised to see Risk Disclosure Document to understand the risks associated before investing in the securities markets. Actual results may differ
   materially from those set forth in projections. Forward-looking statements are not predictions and may be subject to change without notice. Our employees in sales and marketing team,
   dealers and other professionals may provide oral or written market commentary or trading strategies that reflect opinions that are contrary to the opinions expressed herein, .In reviewing
   these materials, you should be aware that any or all of the foregoing, among other things, may give rise to real or potential conflicts of interest.

   Associates (Group Companies) of KRCSSPL might have received any commission/compensation from the companies mentioned in the report during the period preceding twelve months
   from the date of this report for services in respect of brokerage services or specific transaction or for products and services other than brokerage services.

   KRCSSPL or its Associates (Group Companies) have not managed or co-managed public offering of securities for the subject company in the past twelve months.

   KRCSSPL encourages the practice of giving independent opinion in research report preparation by the analyst and thus strives to minimize the conflict in preparation of research report.
   KRCSSPL or its analysts did not receive any compensation or other benefits from the companies mentioned in the report or third party in connection with preparation of the research report.
   Accordingly, neither KRCSSPL nor Research Analysts have any material conflict of interest at the time of publication of this report.

   It is confirmed that, Parvati Rai (MBA-Finance, M.com), Head Research of this report have not received any compensation from the companies mentioned in the report in the preceding
   twelve months. Compensation of our Research Analysts is not based on any specific brokerage service transactions.

   KRCSSPL or its associates (Group Companies) collectively or its research analyst do not hold any financial interest/beneficial ownership of more than 1% (at the end of the month immediately
   preceding the date of publication of the research report) in the company covered by Analyst, and has not been engaged in market making activity of the company covered by research
   analyst.

   It is confirmed that, Parvati Rai (MBA-Finance, M.com), Head Research do not serve as an officer, director or employee of the companies mentioned in the report.

   This report is not directed or intended for distribution to, or use by, any person or entity who is a citizen or resident of or located in any locality, state, country or other Jurisdiction, where
   such distribution, publication, availability or use would be contrary to law, regulation or which would subject KRCSSPL and affiliates to any registration or licensing requirement within such
   jurisdiction. The securities described herein may or may not be eligible for sale in all jurisdictions or to certain category of investors. Persons in whose possession this document may come
   are required to inform them of and to observe such restriction.

                                                                          Please send your feedback to research.insti@krchoksey.com
                                                                                         Visit us at www.krchoksey.com
                                                                                    KRChoksey Shares and Securities Pvt. Ltd.
                                                                                                Registered Office:
                                                                       1102, Stock Exchange Tower, Dalal Street, Fort, Mumbai – 400 001.
                                                                                Phone: +91-22-6633 5000; Fax: +91-22-6633 8060.
                                                                                                 Corporate Office:
                                                                       ABHISHEK, 5th Floor, Link Road, Andheri (W), Mumbai – 400 053.
                                                                                 Phone: +91-22-6696 5555; Fax: +91-22-6691 9576.

ANALYST                                                                                                   KRChoksey Research                  Phone: +91-22-6696 5555, Fax: +91-22-6691 9576
Parvati Rai, head-research@krchoksey.com, +91-22-6696 5413                                  is also available on Bloomberg KRCS           www.krchoksey.com
                                                                                              Thomson Reuters, Factset and Capital IQ
You can also read