Impact of Grade Groups on Prostate Cancer-Specific and Other-Cause Mortality: Competing Risk Analysis from a Large Single Institution Series
←
→
Page content transcription
If your browser does not render page correctly, please read the page content below
Article
Impact of Grade Groups on Prostate Cancer-Specific and
Other-Cause Mortality: Competing Risk Analysis from a Large
Single Institution Series
Daimantas Milonas 1,2,*, Tomas Ruzgas 3, Zilvinas Venclovas 1, Mindaugas Jievaltas 1 and Steven Joniau 2
1 Medical Academy, Department of Urology, Lithuanian University of Health Sciences, 44307 Kaunas, Lithuania;
zilvinas.venclovas@gmail.com (Z.V.); mindaugas.jievaltas@lsmuni.lt (M.J.)
2 Department of Urology, University Hospital of Leuven, 3000 Leuven, Belgium; steven.joniau@uzleuven.be
3 Department of Applied Mathematics, Kaunas University of Technology, 44249 Kaunas, Lithuania;
tomas.ruzgas@ktu.lt
* Correspondence: daimantas.milonas@lsmuni.lt
Simple Summary: For prostate cancer patient, information on risk of long-term cancer-specific and other-
cause mortality is essential to avoid over- and undertreatment. Patient stratification to low-, intermediate-
, and high-risk groups has been used for decades. However, recent evidence has shown that such strati-
fication is not optimal and outcomes differ widely, especially in high-risk prostate cancer patients.
Gleason score grading is an important factor for the prediction of cancer-specific survival and has been
included in all prostate cancer risk stratification models. Moreover, this parameter could be used as an
independent predictor. Recently proposed grade group model demonstrated good predictive probability
on short-term outcomes. However, there is a lack of data regarding long-term cancer-specific survival. In
Citation: Milonas, D.; Ruzgas, T.; the presented study, we analyzed long-term oncological outcomes in different grade groups. Detected
Venclovas, Z.; Jievaltas, M.; Joniau, S. ratio between cancer-specific and other-cause mortality could be very informative and helpful in prostate
Impact of Grade Groups on Prostate cancer patient risk stratification and more precise clinical decision making.
Cancer-Specific and Other-Cause
Mortality: Competing Risk Analysis Abstract: Objective: To assess the risk of cancer-specific mortality (CSM) and other-cause mortality (OCM)
from a Large Single Institution Series. using post-operative International Society of Urological Pathology Grade Group (GG) model in patients
Cancers 2021, 13, 1963. https://doi.org/
after radical prostatectomy (RP). Patients and Methods: Overall 1921 consecutive men who underwent RP
10.3390/cancers13081963
during 2001 to 2017 in a single tertiary center were included in the study. Multivariate competing risk
regression analysis was used to identify significant predictors and quantify cumulative incidence of CSM
Academic Editors: Takahiro Kimura
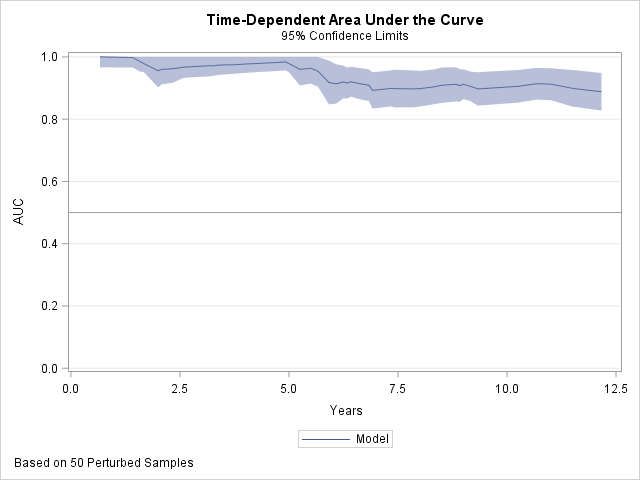
and OCM. Time-depending area under the curve (AUC) depicted the performance of GG model on pre-
and Shoji Kimura
diction of CSM. Results: Over a median follow-up of 7.9-year (IQR 4.4-11.7) after RP, 235 (12.2%) deaths
Received: 12 March 2021 were registered, and 52 (2.7%) of them were related to PCa. GG model showed high and stable perfor-
Accepted: 16 April 2021 mance (time-dependent AUC 0.88) on prediction of CSM. Cumulative 10-year CSM in GGs 1 to 5 was
Published: 19 April 2021 0.9%, 2.3%, 7.6%, 14.7%, and 48.6%, respectively; 10-year OCM in GGs was 15.5%, 16.1%, 12.6%, 17.7%
and 6.5%, respectively. The ratio between 10-year CSM/OCM in GGs 1 to 5 was 1:17, 1:7, 1:2, 1:1, and 7:1,
Publisher’s Note: MDPI stays neu- respectively. Conclusions: Cancer-specific and other-cause mortality differed widely between GGs. Pre-
tral with regard to jurisdictional sented findings could aid in personalized clinical decision making for active treatment.
claims in published maps and institu-
tional affiliations. Keywords: prostate cancer; radical prostatectomy; grade groups; cancer-specific mortality; other-
cause mortality
Copyright: © 2021 by the authors. Li-
censee MDPI, Basel, Switzerland. This
1. Introduction
article is an open access article distrib-
uted under the terms and conditions of Clinical decision making in prostate cancer (PCa) patients is very complex and infor-
the Creative Commons Attribution mation on risk of long-term cancer specific mortality (CSM) and other-cause mortality
(CC BY) license (http://creativecom- (OCM) is essential to avoid over- and undertreatment. Previous reports from population-
mons.org/licenses/by/4.0/). based or multi-institutional large series provide such information [1–4]. In these studies,
Cancers 2021, 13, 1963. https://doi.org/10.3390/cancers13081963 www.mdpi.com/journal/cancers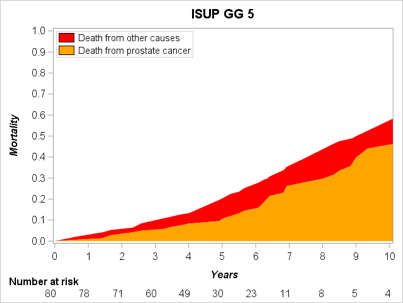
Cancers 2021, 13, 1963                                                                                        2 of 11

                         patients were stratified in low-, intermediate-, and high-risk group according to the pro-
                         posed risk group models based on preoperative prostate specific antigen (PSA), stage, and
                         Gleason score [5,6]. However, recent evidence has shown that such stratification is not
                         optimal and outcomes differ widely, especially in high-risk PCa patients [7–9]. Gleason
                         score grading is an important factor for the prediction of cancer-specific survival and has
                         been included in all PCa risk stratification models. Moreover, this parameter could be
                         used as an independent predictor. Reports, especially those after 2014 International Soci-
                         ety of Urological Pathology (ISUP) recommendations [10], demonstrate the growing role
                         of Gleason score in prognosis of oncological outcomes. The new ISUP Grade Group (GG)
                         model shows better performance in comparison with former Gleason grading both on
                         prediction of biochemical progression-free survival [11,12] and the forecast of cancer-spe-
                         cific survival [13,14] and is now accepted and widely used [9]. Indeed, to transfer infor-
                         mation of cancer-specific and overall survival from different reports to individual pa-
                         tient’s risk of dying from cancer or other causes is complicated. One of the most realistic
                         ways to receive reliable information on mortality is competing risk analysis. Taking into
                         consideration that Gleason grading is a key predictor of CSM, such data would be very
                         useful and friendly to use for both clinicians and patients in order to choose the optimal
                         personalized treatment option.
                               We hypothesized that GG model could be an important predictor of CSM and pro-
                         vide correct information on risk of death from cancer and other causes in long-term fol-
                         low-up. Additionally, we focused on patient age and stratified men into two groups aged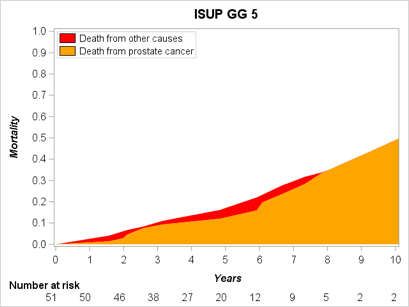
Cancers 2021, 13, 1963                                                                                                   3 of 11

                         Figure 1. Study flowchart. RP—radical prostatectomy, AUC—area under the curve.

                         3. Results
                               Median follow-up after RP for survivors was 7.9 year (IQR 4.4–11.7). Of the 1921 patients
                         in our series, 235 (12.2%) died of other causes and 52 (2.7%) died of PCa. Patient charac-
                         teristics are represented in Table 1. Overall, 5- and 10-year CSM was 1.2% (95% CI 0.8–1.9)
                         and 4.1% (95% CI 3.1–5.6), respectively. The 5- and 10-year OCM was 5% (95% CI 4.1–6.2)
                         and 15.5% (95% CI 13.6–17.7), respectively.

                         Table 1. Descriptive characteristics of 1921 prostate cancer patients treated with radical prostatec-
                         tomy.

                                                           All Patients        Age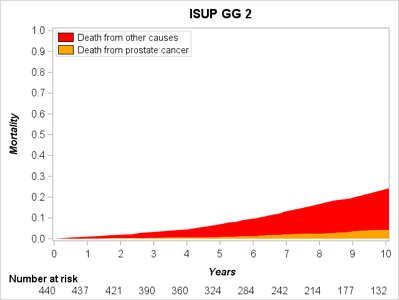
Cancers 2021, 13, 1963                                                                                                 4 of 11

                                      1                    502 (26.1)       268 (26.4)      234 (25.9)
                                      2                    975 (50.8)       534 (52.6)      441 (48.7)
                                      3                    210 (10.9)       125 (12.3)       85 (9.4)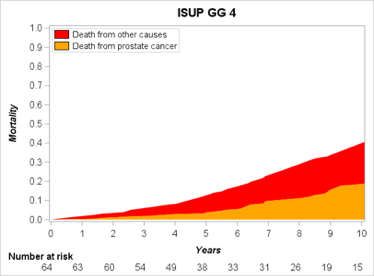
Cancers 2021, 13, 1963                                                                                              5 of 11

                         Table 2. Multivariable competing risk analysis of cancer-specific mortality.

                                                              Cancer Specific Mortality
                           Pathological Parameter              HR                   95% CI                p
                          Preoperative PSA (ng/mL)             0.99                0.95–1.02             0.4
                                  Age (year)                   1.1                 1.03–1.14            0.001
                              Pathological stage
                                      pT2                                          Referent
                                     pT3a                      1.02                0.43–2.41             0.9
                                    pT3b-4                     3.1                 1.28–7.49             0.01
                            Pathological ISUP GG
                                     GG 1                                          Referent
                                     GG 2                      1.9                 0.58–6.02             0.3
                                     GG 3                      4.7                1.18–18.47             0.03
                                     GG 4                      6.8                1.87–24.76            0.004
                                     GG 5                      20.3               5.55–74.31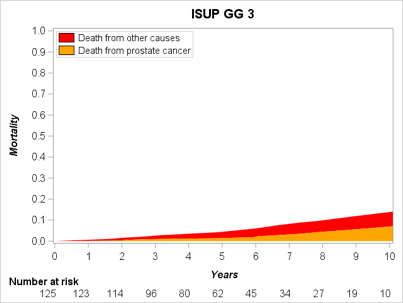
Cancers 2021, 13, 1963                                                                                                  6 of 11

                                      Cumulative 10-year CSM increased gradually from 0.9% (95% CI 0.3–2.2) in GG1 to
                                48.6% (95% CI 33.9–69.7) in GG5; cumulative 10-year OCM in GGs 1–4 was similar and
                                varied from 12.6% (95% CI 7.9–22.9) to 17.7% (95% CI 12.6–32.7), while in GG5 OCM reached
                                only 6.5% (95% CI 2.6–21.2) (Figure 4, Table 3). Assessing proportion between death of cancer
                                and death of other causes at 10-year after RP showed wide differences between GGs. The ratio
                                of CSM/OCM was 1:17 in GG1, 1:7 in GG2, 1:2 GG3, 1:1 in GG4, and 7:1 in GG5 (Table 4).
                                      Furthermore, we stratified patients according to age into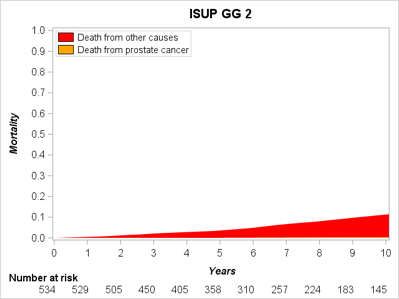
Cancers 2021, 13, 1963                                                                                                       7 of 11

      Figure 4. Cumulative cancer-specific and other-cause mortality in postoperative International Society of Urological Pa-
      thology Grade Group (ISUP GG) model stratified by patient age.

                                 Table 3. Cumulative 5- and 10-year mortality from cancer and other causes in all cohort and sub-
                                 groups stratified according to age.

                                                   5-year Mortality (95% CI)                   10-year Mortality (95% CI)
                                 ISUP GG
                                           Prostate Cancer         Other Causes         Prostate Cancer          Other Causes
                                                               Pathological ISUP GG, all patients
                                    1        0.2 (0.05–0.4)          4.5 (3.7–6.1)         0.9 (0.3–2.2)        15.5 (11.8–18.4)
                                    2        0.4 (0.2–0.8)           4.8 (3.9–6.3)         2.3 (1.3–3.9)        16.1 (12.8–18.7)
                                    3        1.4 (0.6–3.0)           4.4 (2.4–7.7)         7.6 (3.9–14.8)        12.6 (7.9–22.9)
                                    4        2.8 (1.1–7.1)          7.1 (4.0–11.2)        14.7 (7.3–29.3)       17.7 (12.6–32.7)
                                    5       11.3 (7.2–17.6)         7.9 (4.1–12.1)       48.6 (33.9–69.7)         6.5 (2.6–21.2)
                                                                Pathological ISUP GG (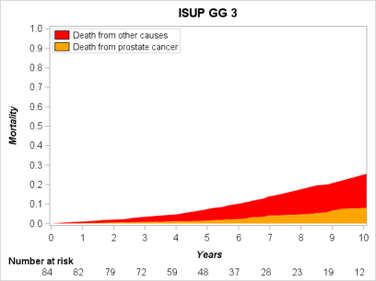
Cancers 2021, 13, 1963                                                                                               8 of 11

                         Table 4. Cumulative 10-year overall mortality and cancer-specific and other-cause mortality ratio
                         according to grade group in all cohort and subgroups stratified by age.

                                                                                                             Ratio
                         ISUP GG       OM (%)       Proportion of CSM (%)     Proportion of OCM (%)
                                                                                                           CSM/OCM
                                                          Pathological ISUP GG, all patients
                              1          16.4                   5.5                      94.5           1:17
                              2          18.4                  12.5                      87.5            1:7
                              3          20.2                  37.6                      62.4            1:2
                              4          32.4                  45.4                      54.6            1:1
                              5          55.1                  88.2                      11.8            7:1
                                                           Pathological ISUP GG (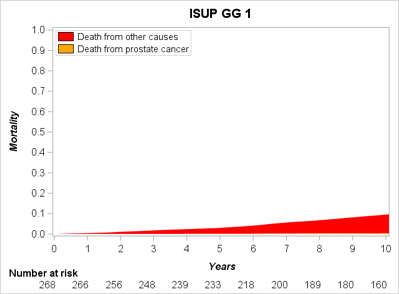
Cancers 2021, 13, 1963                                                                                          9 of 11

                               Patient stratification according to age revealed several trends. Older counterparts
                         had 3-fold higher risk of 10-year CSM in comparison with younger men, and this was
                         especially true for GGs 1 to 4. We found that older men associated more often with GG4
                         and GG5, as well as with pT3b-4 disease, and this could be an explanation of higher CSM.
                         These findings and our previous analyses [25] are in agreement with reports that demon-
                         strated close association between older age and worse cancer features in a number of large
                         population-based studies [1,26]. Contrarily, younger patient in GGs 1 and 2 demonstrated
                         very low 10-year CSM of 0.4% and 0.3%, respectively, and very high risk of death from
                         other causes (CSM/OCM ratio of 1:23 and 1:37, respectively). This could be a very im-
                         portant message in the discussion with younger PCa patients. However, younger coun-
                         terparts demonstrated extremely poor outcomes in GG5: all patients at 10-year after RP
                         died from PCa, and these men represent potentially lethal subgroup.
                               The main challenge of present analyses is how our findings correlate with mortality
                         results using other risk stratification models. Boehm et al. in 8741 patients after RP series
                         demonstrated 0.2–0.6% of 10-year CSM in low, 2.3–4.4% in intermediate, and 14.8–19% in
                         high CAPRA-S risk groups stratified by age [27]. Similar results from a Swedish nation-
                         wide population-based study in risk groups created by D’Amico criteria were reported by
                         Van Hemelrijck et al. [4]. For patients undergoing RP, radiotherapy, or surveillance, 10-
                         year CSM was 0.3–3% in low risk, 2–8% in intermediate, and 9–15% in high-risk group
                         stratified by age and Charlson comorbidity index (CCI). Our findings are in agreement
                         with the mentioned results comparing GG1 vs. low risk, GG2–3 vs. intermediate risk, and
                         GG4–5 vs. high-risk. However, CSM in GG5 was up to 3-fold higher in comparison with
                         GG4. The same significant survival difference between biopsy and postoperative GG4 and
                         GG5 was presented by Ham et al. [28]. Heterogeneity of high-risk PCa group was reported
                         by various studies [7–9,21], and probably a more strict definition is needed for this subset.
                               OCM at 10-year in our study was 15.5% and varied from 7% to 23%, except 0% in
                         younger GG5 subgroup. These findings are higher than those in Boehm et al. study [27],
                         but are in concordance with other previously reported studies [2–4] and demonstrate a
                         similar age-dependent trend.
                               Taken together, our study findings demonstrated that GG model is the strongest in-
                         dependent predictor of CSM with high time-dependent performance. Cumulative 10-year
                         CSM is in agreement with mortality rates assessed using other risk stratification models.
                         Moreover, GG5 identifies the most aggressive PCa with probably lethal disease course.
                         Presented CSM/OCM ratio represents leading cause of death among GGs. Finally, pre-
                         sented mortality curves are simple to use and could be very informative in discussing
                         different risks after RP with each patient. They can also be helpful in personalized decision
                         making to avoid over- and undertreatment of potentially indolent and aggressive PCa.
                               Our study is not devoid of limitation. We did not collect data on comorbidity in our
                         series. However, studies demonstrated low comorbidity of men who underwent radical
                         treatment [29]. Therefore, our detected 10-year OCM results in GGs could reflect real risk
                         of death from other cause and could be used for the interpretation of mortality. In our
                         study, specimen grade was not re-evaluated according to the ISUP 2014 recommenda-
                         tions. Biopsy and pathological Gleason score were transformed to GG models. However,
                         in the vast majority of studies, GG was created in the same manner [10]. The retrospective
                         nature of the study might introduce potential selection bias, a relatively low number of
                         final events (i.e., cancer-related death), and more than 15% missing data could have an
                         impact on the final results and reduce generalizability of our findings. Finally, we did not
                         have a possibility to compare our findings with outcomes after radiotherapy, which is
                         another radical treatment option for localized PCa.
                               However, we should notice some strengths of the presented analyses: long-term fol-
                         low-up, competing risk analysis, corrected data of cause of death and in detail presented
                         CSM and OCM using GG model after RP.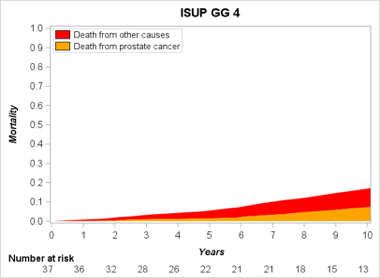
Cancers 2021, 13, 1963                                                                                                                10 of 11

                                   5. Conclusions
                                        CSM and OCM differed widely between GGs. GG model is an independent predictor
                                   of CSM and could be successfully used for interpretation of long-term risk of CSM and OCM
                                   following radical prostatectomy. It is also helpful for personalized clinical decision making.

                                   Author Contribution: Conceptualization: D.M. and S.J.; data curation D.M. and Z.V.; formal anal-
                                   ysis T.R. and D.M; writing—original draft preparation, D.M.; writing—review and editing D.M.,
                                   S.J., M.J., and Z.V. All authors have read and agreed to the published version of the manuscript.
                                   All authors have read and agreed to the published version of the manuscript.
                                   Funding: This research received no external funding.
                                   Institutional Review Board Statement: The study was conducted according to the guidelines of the
                                   Declaration of Helsinki and approved by the University Ethics Committee (Nr. BE-2-48).
                                   Informed Consent Statement: Patient consent was waived due to some access restrictions applied
                                   to the data underlying the findings.
                                   Data Availability Statement: The data presented in this study are available on request from the
                                   corresponding author.
                                   Acknowledgments: S.J. is Senior Clinical Researcher of the FWO (Research Foundation Flanders).
                                   Conflicts of Interest: The authors declare no conflicts of interest.

References
1.    Rider, J.R.; Sandin, F.; Andrén, O.; Wiklund, P.; Hugosson, J.; Stattin, P. Long-term outcomes among noncuratively treated men
      according to prostate cancer risk category in a nationwide, population-based study. Eur. Urol. 2013, 63, 88–96.
2.    Abdollah, F.; Sun, M.; Schmitges, J.; Tian, Z.; Jeldres, C.; Briganti, A.; Shariat, S.F.; Perrotte, P.; Montorsi, F.; Karakiewicz, P.I.
      Cancer-Specific and Other-Cause Mortality After Radical Prostatectomy Versus Observation in Patients with Prostate Cancer:
      Competing-Risks Analysis of a Large North American Population-Based Cohort. Eur. Urol. 2011, 60, 920–930, doi:10.1016/j.eu-
      ruro.2011.06.039.
3.    Briganti, A.; Spahn, M.; Joniau, S.; Gontero, P.; Bianchi, M.; Kneitz, B.; Chun, F.K.; Sun, M.; Graefen, M.; Abdollah, F.; et al.
      Impact of Age and Comorbidities on Long-term Survival of Patients with High-risk Prostate Cancer Treated with Radical Pros-
      tatectomy: A Multi-institutional Competing-risks Analysis. Eur. Urol. 2013, 63, 693–701, doi:10.1016/j.eururo.2012.08.054.
4.    Van Hemelrijck, M.; Folkvaljon, Y.; Adolfsson, J.; Akre, O.; Holmberg, L.; Garmo, H.; Stattin, P. Causes of death in men with
      localized prostate cancer: A nationwide, population-based study. BJU Int. 2016, 117, 507–514.
5.    D’Amico, A.V.; Whittington, R.; Malkowicz, S.B.; Schultz, D.; Blank, K.; Broderick, G.A.; Tomaszewski, J.E.; Renshaw, A.A.;
      Kaplan, I.; Beard, C.J.; et al. Biochemical Outcome After Radical Prostatectomy, External Beam Radiation Therapy, or Interstitial
      Radiation Therapy for Clinically Localized Prostate Cancer. J. Urol. 1999, 16, 1393, doi:10.1097/00005392-199904000-00112.
6.    Mottet, N.; Bellmunt, J.; Bolla, M.; Briers, E.; Cumberbatch, M.G.; De Santis, M.; Fossati, N.; Gross, T.; Henry, A.; Joniau, S.; et
      al. EAU-ESTRO-SIOG Guidelines on Prostate Cancer. Part 1: Screening, Diagnosis, and Local Treatment with Curative Intent.
      Eur. Urol. 2017, 71, 618–629, doi:10.1016/j.eururo.2016.08.003.
7.    Chys, B.; Devos, G.; Everaerts, W.; Albersen, M.; Moris, L.; Claessens, F.; De Meerleer, G.; Haustermans, K.; Briganti, A.; Chlosta,
      P.; et al. Preoperative Risk-Stratification of High-Risk Prostate Cancer: A Multicenter Analysis. Front. Oncol. 2020, 10,
      doi:10.3389/fonc.2020.00246.
8.    Joniau, S.; Briganti, A.; Gontero, P.; Gandaglia, G.; Tosco, L.; Fieuws, S.; Tombal, B.; Marchioro, G.; Walz, J.; Kneitz, B.; et al.
      Stratification of high-risk prostate cancer into prognostic categories: A European multi-institutional study. Eur. Urol. 2015, 67,
      157–164.
9.    Tosco, L.; Laenen, A.; Briganti, A.; Gontero, P.; Karnes, R.J.; Bastian, P.J.; Chlosta, P.; Claessens, F.; Chun, F.K.; Everaerts, W.; et
      al. The EMPaCT Classifier: A Validated Tool to Predict Postoperative Prostate Cancer-related Death Using Competing-risk
      Analysis. Eur. Urol. Focus 2018, 4, 369–375, doi:10.1016/j.euf.2016.12.008.
10.   Offermann, A.; Hupe, M.C.; Sailer, V.; Merseburger, A.S.; Perner, S. The new ISUP 2014/WHO 2016 prostate cancer grade group
      system: First résumé 5 years after introduction and systemic review of the literature. World J. Urol. 2019, 38, 657–662,
      doi:10.1007/s00345-019-02744-4.
11.   Epstein, J.I.; Zelefsky, M.J.; Sjoberg, D.D.; Nelson, J.B.; Egevad, L.; Magi-Galluzzi, C.; Vickers, A.J.; Parwani, A.V.; Reuter, V.E.;
      Fine, S.W.; et al. A Contemporary Prostate Cancer Grading System: A Validated Alternative to the Gleason Score. Eur. Urol.
      2016, 69, 428–435, doi:10.1016/j.eururo.2015.06.046.
12.   Spratt, D.E.; Cole, A.I.; Palapattu, G.S.; Weizer, A.Z.; Jackson, W.C.; Montgomery, J.S.; Dess, R.T.; Zhao, S.G.; Lee, J.Y.; Wu, A.;
      et al. Independent surgical validation of the new prostate cancer grade-grouping system. BJU Int. 2016, 118, 763–769,
      doi:10.1111/bju.13488.
Cancers 2021, 13, 1963 11 of 11
13. Grogan, J.; Gupta, R.; Mahon, K.L.; Stricker, P.D.; Haynes, A.-M.; Delprado, W.; Turner, J.; Horvath, L.G.; Kench, J.G. Predictive
value of the 2014 International Society of Urological Pathology grading system for prostate cancer in patients undergoing radical
prostatectomy with long-term follow-up. BJU Int. 2017, 120, 651–658, doi:10.1111/bju.13857.
14. Milonas, D.; Muilwijk, T.; Venclovas, Z.; Devos, G.; Joniau, S. Benefits and harms of the new prostate cancer grade grouping on
the prediction of long-term oncological outcomes in patients after radical prostatectomy. Int. J. Urol. 2021, 28, 390–395,
doi:10.1111/iju.14471.
15. Epstein, J.; Allsbrook, W.C.; Amin, M.B.; Egevad, L.L. The 2005 International Society of Urological Pathology (ISUP) Consensus
Conference on Gleason Grading of Prostatic Carcinoma. Am. J. Surg. Pathol. 2005, 29, 1228–1242,
doi:10.1097/01.pas.0000173646.99337.b1.
16. Epstein, J.I.; Egevad, L.; Amin, M.B.; Delahunt, B.; Srigley, J.R.; Humphrey, P.A. The 2014 International Society of Urological
Pathology (ISUP) Consensus Conference on Gleason Grading of Prostatic Carcinoma: Definition of Grading Patterns and Pro-
posal for a New Grading System. Am. J. Surg. Pathol. 2016, 40, 244–252.
17. Van den Broeck, T.; Moris, L.; Gevaert, T.; Tosco, L.; Smeets, E.; Fishbane, N.; Liu, Y.; Helsen, C.; Margrave, J.; Buerki, C.; et al.
Validation of the Decipher Test for Predicting Distant Metastatic Recurrence in Men with High-risk Nonmetastatic Prostate
Cancer 10 Years After Surgery. Eur. Urol. Oncol. 2019, 2, 589–596.
18. Hofman, M.S.; Lawrentschuk, N.; Francis, R.J.; Tang, C.; Vela, I.; Thomas, P.; Rutherford, N.; Martin, J.M.; Frydenberg, M.;
Shakher, R.; et al. Prostate-specific membrane antigen PET-CT in patients with high-risk prostate cancer before curative-intent
surgery or radiotherapy (proPSMA): A prospective, randomised, multicentre study. Lancet 2020, 395, 1208–1216,
doi:10.1016/s0140-6736(20)30314-7.
19. Spratt, D.E.; Jackson, W.C.; Abugharib, A.; Tomlins, S.; Dess, R.T.; Soni, P.D.; Lee, J.Y.; Zhao, S.G.; Cole, A.; Zumsteg, Z.S.; et al.
Independent validation of the prognostic capacity of the ISUP prostate cancer grade grouping system for radiation treated
patients with long-term follow-up. Prostate Cancer Prostatic Dis. 2016, 19, 292–297, doi:10.1038/pcan.2016.18.
20. Pompe, R.S.; Davis-Bondarenko, H.; Zaffuto, E.; Tian, Z.; Shariat, S.F.; Leyh-Bannurah, S.R.; Schiffmann, J.; Saad, F.; Huland,
H.; Graefen, M.; et al. Population-Based Validation of the 2014 ISUP Gleason Grade Groups in Patients Treated With Radical
Prostatectomy, Brachytherapy, External Beam Radiation, or no Local Treatment. Prostate 2017, 77, 686–693.
21. Milonas, D.; Venclovas, Ž.; Gudinaviciene, I.; Auskalnis, S.; Zviniene, K.; Jurkiene, N.; Basevicius, A.; Patasius, A.; Jievaltas, M.;
Joniau, S. Impact of the 2014 International Society of Urological Pathology Grading System on Concept of High-Risk Prostate
Cancer: Comparison of Long-Term Oncological Outcomes in Patients Undergoing Radical Prostatectomy. Front Oncol. 2019, 19,
1272.
22. He, J.; Albertsen, P.C.; Moore, D.; Rotter, D.; Demissie, K.; Lu-Yao, G. Validation of a Contemporary Five-tiered Gleason Grade
Grouping Using Population-based Data. Eur. Urol. 2017, 71, 760–763, doi:10.1016/j.eururo.2016.11.031.
23. Wilt, T.J.; Vo, T.N.; Langsetmo, L.; Dahm, P.; Wheeler, T.; Aronson, W.J.; Cooperberg, M.R.; Taylor, B.C.; Brawer, M.K. Radical
Prostatectomy or Observation for Clinically Localized Prostate Cancer: Extended Follow-up of the Prostate Cancer Intervention
Versus Observation Trial (PIVOT). Eur. Urol. 2020, 77, 713–724, doi:10.1016/j.eururo.2020.02.009.
24. Bill-Axelson, A.; Holmberg, L.; Garmo, H.; Taari, K.; Busch, C.; Nordling, S.; Häggman, M.; Andersson, S.-O.; Andrén, O.; Stei-
neck, G.; et al. Radical Prostatectomy or Watchful Waiting in Prostate Cancer—29-Year Follow-up. N. Engl. J. Med. 2018, 379,
2319–2329, doi:10.1056/nejmoa1807801.
25. Milonas, D.; Venclovas, Z.; Jievaltas, M. Age and aggressiveness of prostate cancer: Analysis of clinical and pathological char-
acteristics after radical prostatectomy for men with localized prostate cancer. Cent. Eur. J. Urol. 2019, 72, 240–246,
doi:10.5173/ceju.2019.1974.
26. Kinnear, N.J.; Kichenadasse, G.; Plagakis, S.; O’Callaghan, M.E.; Kopsaftis, T.; Walsh, S.; Foreman, D. Prostate cancer in men
aged less than 50 years at diagnosis. World J. Urol. 2016, 34, 1533–1539, doi:10.1007/s00345-016-1824-4.
27. Boehm, K.; Larcher, A.; Tian, Z.; Mandel, P.; Schiffmann, J.; Karakiewicz, P.I.; Graefen, M.; Huland, H.; Tilki, D. Low Other
Cause Mortality Rates Reflect Good Patient Selection in Patients with Prostate Cancer Treated with Radical Prostatectomy. J.
Urol. 2016, 196, 82–88, doi:10.1016/j.juro.2016.01.122.
28. Ham, W.S.; Chalfin, H.J.; Feng, Z.; Trock, B.J.; Epstein, J.I.; Cheung, C.; Humphreys, E.; Partin, A.W.; Han, M. New Prostate
Cancer Grading System Predicts Long-term Survival Following Surgery for Gleason Score 8–10 Prostate Cancer. Eur. Urol. 2017,
71, 907–912, doi:10.1016/j.eururo.2016.11.006.
29. Loeb, S.; Folkvaljon, Y.; Robinson, D.; Lissbrant, I.F.; Egevad, L.; Stattin, P. Evaluation of the 2015 Gleason Grade Groups in a
Nationwide Population-based Cohort. Eur. Urol. 2016, 69, 1135–1141, doi:10.1016/j.eururo.2015.11.036.You can also read