A Model to Predict Breast Cancer Survivability Using Logistic Regression
←
→
Page content transcription
If your browser does not render page correctly, please read the page content below
Original Article
                                     Middle East Journal of Cancer; April
                                                                    July 2015
                                                                          2019;6(3):
                                                                                10(2): 132-138

                                           A Model to Predict Breast Cancer
                                        Survivability Using Logistic Regression
                                                     Mehdi Nourelahi*, Ali Zamani*♦, Abdolrasoul Talei**,
                                                                  Sedigheh Tahmasebi**

                                        *Department of Biomedical Physics and Biomedical Engineering,Shiraz University of
                                                                 Medical Sciences, Shiraz, Iran
                                       **Breast Disease Research Center, Shiraz University of Medical Sciences, Shiraz, Iran

                                     Abstract
                                         Background: Breast cancer is the most common type of cancer amongst women
                                     worldwide. Considering its high incidence, effective detection and prognosis of this
                                     type of cancer may have a significant effect on reducing expenditures. In this study,
                                     we propose a model to predict the 60-month survivability in patients with breast
                                     cancer and investigate the effects of each feature on the obtained model.
                                         Methods: We base this model on the information gathered by the Breast Disease
                                     Research Center, Shiraz University of Medical Sciences, Shiraz, Iran from 5673
                                     patients with breast cancer. The goal of this study was to predict breast cancer
                                     survivability at early diagnosis, so the features used in the research are among those
                                     considered affordable, specifically at the initial steps of diagnosis. After preprocessing
                                     all of the cases and features, we constructed this model based on 1930 cases and 16
                                     of their associated features using logistic regression method. The model then was
                                     evaluated with 10-fold cross validation.
                                         Results: Based on all subsets of the 16 features, we evaluated numerous models.
                                     We selected a model that achieved the best sensitivity and specificity, and used fewer
                                     features as the best model. We considered this model for further analysis, which is
                                     consisted of following features: age at the time of diagnosis, type of invasion, HER2,
                                     size of the tumor, in situ component, lymph node involvement ratio, progesterone receptor
                                     status, and the total number of dissected lymph nodes. The best model obtained overall
                                     accuracy, specificity and sensitivity of 72.49%, 72.83%, and 71.85%, respectively.
                                         Conclusion: The performance of model is quite satisfactory due to the fact that we
♦Corresponding Author:               only used features, which could be obtained at the initial steps of diagnosis. Even though,
 Ali Zamani, PhD                     the effect of patient’s age is controversial, we concluded that ageing would decrease
 Zand Av., Imam Hossein              the 60-month survivability. Our model indicated that having all type of invasions (i.e.
 Square, Department of
 biomedical physics and
                                     vascular, lymphatic, etc.) would result in poorer chance of survival compared to other
 biomedical engineering, School      features effect.
 of medicine, Shiraz university

                                     Keywords: Statistical learning, Data mining, Breast cancer, Logistic regression,
 of medical sciences, Shiraz, Iran
 Tel: +98 71 3234 9332
 Email: zamani_a@sums.ac.ir          Survivability

                                     Received: June 06, 2018; Accepted: November 10, 2018
Mehdi Nourelahi et al.
Introduction that neural networks outperformed the TNM
Cancer, the second cause of death worldwide, staging system.
caused 8.8 million deaths in 2015. Among all In our survey, we found a number of papers that
cancer types, breast cancer is the most frequent in applied KDD techniques to predict the
women globally. According to the World Health survivability of patients with breast cancer. Delen
Organization (WHO), breast cancer caused et al. 8 examined 3 classification techniques
571,000 deaths in 2015. In Iran, according to (decision tree, logistic regression, and artificial
GLOBOCAN, breast cancer has the highest neural networks) on the surveillance,
incidence amongst all cancers and is the leading epidemiology, and end results (SEER) program
cause of death among women.1-3 dataset to predict the 5-year survivability of breast
Detection and prognosis of a disease is an cancer. Their results indicated that the decision tree
important challenge for health care management outperformed the other 2 methods. They also
and researchers in order to make better decisions determined the most descriptive features among
and obtain a deeper understanding. Researchers the available features by using artificial neural
apply knowledge discovery in database (KDD) networks. Sensitivity analysis showed that grade,
and various statistical and machine learning stage of cancer, and radiation were the most
algorithms to solve this problem. Knowledge important features. Ahmad et al.9 used 3 data
discovery in database4,5 is a method to ascertain mining methods to predict breast cancer
patterns and relationships between variables in recurrence. They built their model based on
datasets and consequently build a prognosis model information gathered from 549 cases and a 2-
using the extracted knowledge. The process of year follow-up. They reported that the support
KDD attempts to extract a higher level of vector machine (SVM) outperformed the decision
knowledge from raw data. Considering the tree and artificial neural networks; however, they
definition of KDD proposed by Fayyad et al.,5 data did not clearly report the most important specific
mining is one of the key parts of the KDD process, features. In other words, they did not extract any
but both of these terms are interchangeable. rules to show the effect of the available features,
Typically, researchers perform the following which has been the main problem of most studies
steps within KDD. First step is the choice of a in this field.
dataset related to the subject of interest that We proposed a model by that used logistic
includes information about the question to be regression to predict 60-month survivability of
addressed. Next, the data is preprocessed and patients diagnosed with breast cancer. In addition,
transformed into a desirable form to improve the we determined the essential features of this model
results. In the next step, researchers use various to predict the outcome of breast cancer and
data mining techniques considered suitable for the attempted to describe the effect of each of the
problem, such as clustering or classification. As aforementioned variables on survivability based
the final step, researchers should present an on the proposed method.
understandable model to the expert in that
particular field. Most often, the presentation is a Materials and Methods
predicting black box model or a model that Data and its preparation
describes the relationships between variables or The Breast Disease Research Center, Shiraz
illustrates the hidden patterns inside the dataset.5,6 University of Medical Sciences, Shiraz, Iran
Bruke et al.7 began the first steps of building gathered the data used in this study. The dataset
prognosis models by comparing the TNM staging consisted of 5673 cases and 41 features. In the first
system with artificial neural networks that used step, we thoroughly reviewed the features of the
using the same features of tumor size, nodal status, dataset. In order to reach a prognosis in the first
and distant metastasis. The results have indicated steps, we selected those features that could be
133 Middle East J Cancer 2019; 10(2): 132-138Predicting Breast Cancer Survivability
Table 1. Set of features used for building the model.
Features Notes Abbreviation
Age at diagnosis Continuous value (year) Age
Involved Breast Left or right Breast
Type of invasion Perineural Invasion
Lymphatic
Lymphovascular
Vascular
Progesterone receptor Positive Pr
Negative
Estrogen receptor Positive Er
Negative
HER2 Positive HER2
Negative
Node involvement ratio 0-1 Nrat
Tumor size Millimeter Tsize
Number of involved lymph nodes Ninv
Total number of dissected lymph nodes Ntot
Type of surgery Mastectomy Operation
Quadrantectomy
Grade of tumor 1,2,3 Grade
In situ component Yes Insitu
No
Tumor necrosis Yes Tnecros
No
Type of dissected axillary lymph node SLNB Axillary
ALND
Both
Type of breast cancer Invasive ductal carcinoma Invasion
Medullary
Invasive lobular carcinoma
In situ
Other
HER2: Human epidermal growth factor receptor 2; SNLB: Sentinel lymph node biopsy; ALND: Axillary lymph node biopsy
obtained specifically at the initial steps of the the following rules:10 i) cause of death other than
breast cancer diagnosis. Consequently, we deleted breast cancer and ii) lack of follow-up for at least
features that required time to be gathered (e.g., 60 months.
recurrence, number of times receiving After imposing these rules, 1930 cases
chemotherapy and radiotherapy). remained along with 16 features (Table 1).
In the next step, we omitted cases according to Additional comments about the selected features
Middle East J Cancer 2019; 10(2): 132-138 134Mehdi Nourelahi et al.
Table 2. The confusion matrix.
Predicted class
Yes No
Actual class Yes True positive (TP) False negative (FN)
No False positive (FP) True negative (TN)
include:
Human epidermal growth factor receptor 2
(HER2) is the result of merging immunohisto-
chemistry (IHC) and fluorescence in-situ where βj represents model coefficients and are
hybridization (FISH) tests. estimated using the least squares method. The
We obtained the node involvement ratio by aforementioned linear regression can also be used
dividing the number of involved nodes and the for classification problems. However, in order to
total number of dissected nodes. obtain a probability for each vector, we define the
Sentinel lymph node biopsy (SLNB) and logistic function as in Equation (2):
axillary lymph node dissection (ALND) are the
same in all aspects. However, SLNB is performed
to determine if the cancer cells are present in a
lymph node and if more lymph nodes should be
dissected.11 Equation (2) can be rewritten as:
Mathematical Background
Logistic regression
Logistic regression is a generalization of linear
regression.12 In multiple variable linear regression, Equation (3) is defined as the odds ratio and can
inputs are usually represented as a vector like take any values between 0 and ∞. The odds ratio
XT=[x1 x2 ⋯ xp] and the output Y is calculated as illustrates the chance of event x divided by the
in Equation (1): alternative event.
Finally, by taking the logarithm of Equation (3),
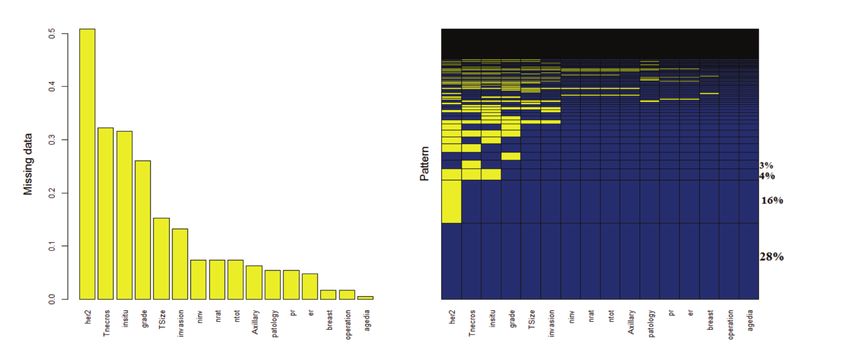
Figure 1. Bar plot and the pattern of missing values for all of the features.
135 Middle East J Cancer 2019; 10(2): 132-138Predicting Breast Cancer Survivability
we obtain the logit equation in Equation (4), Table 3. Distribution of dependent variables for the proposed
which gives us a linear relationship for the logistic model.
Frequency Percentage
regression model.12,13
Did not survive (0) 152 21.84
Survived (1) 544 78.16
Total 696 100
The coefficients were obtained by the method
of maximum likelihood. To build our model we pattern of these missing values in our dataset.
used the R programming language.14 The right panel of figure 1 illustrates that only 0.28
of cases do not have missing values; removal of
Model evaluation HER2 added 0.16 to the usable cases. We
Evaluation criteria considered these circumstances and built all
In order to estimate the model’s accuracy, we possible models by using all of the possible subsets
calculated sensitivity and specificity as follows:6,15 of the 16 features. For each subset of the features
(TP+TN) (216-1 subsets) we evaluated the models and, as
Accuracy= the dataset, we omitted the cases with missing
(Number of all cases)
values. We calculated the accuracy, sensitivity
and specificity for all of these models.
TP
Sensitivity= Finally, we selected the model that
(TP+FN) simultaneously had the highest specificity and
sensitivity values and fewer numbers of features
TN as the best model.
Specificity=
(TN+FP) We obtained the best model by selecting eight
features: age at the time of diagnosis, type of
True positive (TP), true negative (TN), false invasion, HER2, size of the tumor, in situ
positive (FP), and false negative (FN) are component, lymph node involvement ratio,
illustrated in table 2 in a confusion matrix. progesterone receptor status, and the total number
Of note, sensitivity and specificity are equal to of dissected lymph nodes. In our dataset there
the accuracy of the survived and not alive groups, were 696 cases that had complete information
respectively. about all of these features. We defined this model
as the proposed model. Table 3 illustrates the
Evaluation method distribution of dependent variables.
We have used 10-fold cross-validation to For the proposed model, the averages for 100
reduce the error caused by bias and variance.13 In iterations of a 10-fold cross validation were
this method, the data is divided into 10 divisions; 72.49±0.55 (accuracy), 72.83±0.62 (specificity),
in every step, the model is built based on 9 and 71.85±1.3 (sensitivity). Table 4 summarizes
portions and the remaining part is used to evaluate the coefficients of the proposed model and the
the model. At last, to obtain each criterion, we odds ratios.
consider the average of the estimated values for
accuracy, specificity, and sensitivity of these 10 Discussion
models. We built this model with the aforementioned
features. The small value of the standard deviation
Results validated the stability of our selected model.
There were some missing values in the dataset According to table 4, lymph node involvement
after preprocessing. In figure 1, by using VIM16 ratio, age at the time of diagnosis, progesterone
as a package in R, we obtained the bar plot for the receptor, and invasion were statistically significant.
missing values of the different features and the We extracted the presented P-value based on the
Middle East J Cancer 2019; 10(2): 132-138 136Mehdi Nourelahi et al.
hypothesis that omitting the feature would have Acknowledgement
no effect on the model. Of note, even though the The paper was extracted from the MSc thesis
other variables did not have a small P-value, they by Mehdi Nourelahi and supported by the
are important for a better performance. We Research Council at Shiraz University of Medical
evaluated the performance of this model although Sciences (95-01-01-13731).
these features were omitted in our exhaustive
search to find the best subset of features. Conflict of Interest
The intercept term in table 4 corresponded to None declared.
the reference level of the categorical features:
positive HER2, lymphatic invasion, presence of References
an in situ component, and positive progesterone 1. World health organization (WHO). [Internet]. Cancer;
receptor. The odds ratio of each feature indicated [cited 2017]. Available from:
how each change in the features could alter the h t t p : / / w w w. w h o . i n t / e n / n e w s - r o o m / f a c t -
chances for survival. For example, 0.97 was the sheets/detail/cancer.
2. World health organization (WHO). [Internet]. Breast
odds ratio for lymph node involvement, which cancer; [cited 2017]. Available from:
suggested that each 0.01 increase in this variable http://www.who.int/cancer/prevention/diagnosis-
would decrease the chance of survival by 0.03 screening/breast-cancer/en/.
when all of the other features remained fixed. 3. Cancer today. [Internet]. Global Cancer Observatory;
Likewise, for age, every unit of increment in age c2018. Population fact sheets; [cited 2017]. Available
from: http://gco.iarc.fr/today/fact-sheets-populations.
decreased the chance by 0.03. Our proposed 4. Piateski, G; Frawley, W. Knowledge discovery in
model suggested that older patients would have databases. USA: MIT Press Cambridge; 1991.p.540.
a poorer chance of surviving breast cancer 5. Fayyad U, Piatetsky-Shapiro G, Smyth P. From data
compared to younger patients. mining to knowledge discovery in databases. AI
The results of the current study differed from Magazine. 1996;17(3):37-54. DOI: https://doi.org/
10.1609/aimag.v17i3.1230.
other studies. Rezaianzadeh et al. found no 6. Han, J; Kamber, M; Pei, J. Data mining: concepts and
evidence of a relation between younger age and techniques. 3rd ed. San Francisco, CA, USA: Morgan
survival.17 Chen et al. reported that middle-aged Kaufmann Publishers Inc., 2011.
patients had a better overall survival rate than 7. Burke HB, Goodman PH, Rosen DB, Henson DE,
Weinstein JN, Harrell FE Jr, et al. Artificial neural
young and elderly patients.18 In contrast, Alieldin networks improve the accuracy of cancer survival
et al. reported that young women were not found prediction. Cancer. 1997;79(4):857-62.
to have a poorer prognosis.19 We omitted subjects 8. Delen D, Walker G, Kadam A. Predicting breast cancer
that died due to reasons other than cancer and survivability: a comparison of three data mining
considered this to be the main reason for the methods. Artif Intell Med. 2005;34(2):113-27.
9. Ahmad LG, Eshlaghy AT, Poorebrahimi A, Ebrahimi
differences in results between the studies. M, Razavi AR. Using Three machine learning
The current study results had lower accuracy, techniques for predicting breast cancer recurrence. J
specificity, and sensitivity compared to other Health Med Inform. 2013;4:124. doi: 10.4172/2157-
studies. One explanation could be that some 7420.1000124.
features were not used or the data did not contain 10. BellaachiaA. Guven E. Predicting breast cancer
survivability using data mining techniques. Age.
those features, such as cancer stage, metastasis, 2006:58(13):10-110.
and treatment (chemotherapy, radiotherapy, and 11. National cancer institute. [Internet]. Sentinel lymph
hormonal treatment) despite the fact that these node biopsy; [cited 2017 Oct]. Available from:
features were considered to be the most important https://www.cancer.gov/about-cancer/diagnosis-
predictive features of breast cancer staging/staging/sentinel-node-biopsy-fact-sheet.
12. Hastie, T; Tibshirani, R; Friedman, J. The elements of
survivability.8,10,20 Hence, it seemed that the statistical learning. 2nd ed. New York: Springer-Verlag;
obtained performance could be presumed 2009.p.745.
satisfactory. 13. James, G; Witten, D; Hastie, T; Tibshirani, R. An
137 Middle East J Cancer 2019; 10(2): 132-138Predicting Breast Cancer Survivability
introduction to statistical learning with application in
R. 1st ed. New York: Springer-Verlag. 2013. p.426.
14. R Core Team. R: A language and environment for
statistical computing. R Foundation for Statistical
Computing; 2017. Vienna, Austria. Available from:
http://www.R-project.org.
15. Parikh R, Mathai A, Parikh S, Chandra Sekhar G,
Thomas R. Understanding and using sensitivity,
specificity and predictive values. Indian J Ophthalmol.
2008;56(1):45-50.
16. Kowarik A, Templ M. Imputation with the R Package
VIM. Journal of Statistical Software. 2016;74(7):16.
Doi: 10.18637/jss.v074.i07
17. Rezaianzadeh A, Peacock J, Reidpath D, Talei A,
Hosseini SV, Mehrabani D. Survival analysis of 1148
women diagnosed with breast cancer in Southern Iran.
BMC Cancer. 2009;9:168. doi: 10.1186/1471-2407-9-
168
18. Chen HL, Zhou MQ, Tian W, Meng KX, He HF. Effect
of age on breast cancer patient prognoses: A population-
based study using the SEER 18 database. PLoS One.
2016;11(10):e0165409. doi: 10.1371/journal.pone.
0165409.
19. Alieldin NH, Abo-Elazm OM, Bilal D, Salem SE,
Gouda E, Elmongy M, et al. Age at diagnosis in women
with non-metastatic breast cancer: Is it related to
prognosis? J Egypt Natl Canc Inst. 2014;26(1):23-
30. doi: 10.1016/j.jnci.2013.08.005.
20. Pill Choi J, Hwa Han T, Park RW. A hybrid Bayesian
network model for predicting breast cancer prognosis.
J Korean Soc Med Informatics. 2009;15(1):49-57.
Middle East J Cancer 2019; 10(2): 132-138 138You can also read