Q1 2021 results presentation KRUK Group

Page created by Valerie Mendez
 
CONTINUE READING
Q1 2021 results presentation KRUK Group
Q1 2021 results presentation
       KRUK Group
Q1 2021 results presentation KRUK Group
Agenda

Summary
Geographical and operating segments
Financial results
Additional information

                                      2
Q1 2021 results presentation KRUK Group
For Q1 2021, KRUK has reported record-high recoveries of PLN 512m,
delivering record-high net profit of PLN 127m
               NET PROFIT                                                                            RECOVERIES FROM
                                                             CASH EBITDA *                                                                                      PURCHASES
                                                                                                 PURCHASED DEBT PORTFOLIOS

               2020: PLN 81m                                 2020: PLN 1,236m                                2020: PLN 1,834m                                   2020: PLN 456m
                                      300
                                                                                   364
                                                   326              324     322                                                488     512
                                                                                                     477
                                                                                                                      452
                                                           265                                                417

                     54       47
              43                                                                                                                                                           344
                                     127

    -62
                                                                                                                                                                                 159
                                                                                                                                                      57        23    33
    Q1 2020                          Q1 2021       Q1 2020                          Q1 2021          Q1 2020                           Q1 2021        Q1 2020                    Q1 2021

                     EPS                             Recommended dividend                                   PORTFOLIO                                            NET DEBT/
                   Q1 2021                                                                               CARRYING AMOUNT                                        Cash EBITDA

                                                                                                       Mar 31 2020 PLN 4.1bn                                Mar 31 2020 2.1x
              Q1 2020: -3.27                                                                           Dec 31 2020: PLN 4.0bn                               Dec 31 2020: 1.7x

    * Cash EBITDA = operating profit - depreciation/amortisation + recoveries from purchased debt portfolios - revenue from collection of purchased debt.
    ** LTM consolidated net profit divided by equity at end of the period.
                                                                                                                                                                                           3
Q1 2021 results presentation KRUK Group
KRUK in Q1 2021: Record-high net profit on strong recoveries, operating profit
delivered across all business lines
                     ▪ In Q1 2021, the KRUK Group earned a net profit of PLN 127m. Cash EBITDA came in at PLN 364m, up 12% year
                       on year.
                     ▪ The Group delivered operating profit (EBITDA) on all its business lines.
                     ▪ In Q1 2021, the KRUK Group generated PLN 382m in revenue, up 92% year on year. Revenue from purchased
 Financial results     debt portfolios was PLN 341m (up 118% year on year), mainly on higher recoveries from debt portfolios and
                       an upward revaluation in projected recoveries of PLN 18m. Revenue was negatively affected by exchange rate
                       movements (PLN -7m).
                     ▪ Operating and administrative expenses totalled PLN 188m, down by PLN 5m on Q1 2020.

                     ▪ Recoveries of purchased debt amounted to PLN 512m, up PLN 35m year on year (+7%).
                     ▪ The largest recoveries were recorded on the Polish (PLN 250m) and Romanian markets (PLN 140m), a year-on-
                       year improvement of, respectively, PLN 31m and PLN 3m. Recoveries from the Italian market reached PLN
 Recoveries from       66m, down PLN 2m year on year. The ‘Other markets’ generated PLN 56m, up PLN 3m vs Q1 2020.
                     ▪ The level of recoveries on unsecured retail portfolios was influenced by changes in the operational process
 purchased debt        related to the consistent implementation of the strategy in the area of operational excellence and the
    portfolios         outlined mission, vision and values. A number of actions taken by the KRUK Group in 2020 and Q1 2021
                       improve the efficiency of the court and amicable process in each of the markets (including the development
                       of online tools, improvement of scoring and analytical models, working on the effectiveness of negotiations,
                       continuous improvement of processes).

                     ▪ In Q1 2021, the KRUK Group invested PLN 159m in debt portfolios worth nominally PLN 877m. The
  New portfolio        investments increased by PLN 102m relative to Q1 2020.
   purchases         ▪ Over Q1, the Group’s purchases were made largely on the Polish market, with expenditure on debt portfolios
                       of PLN 130m, or 82% of total expenditure.

                                                                                                                                  4
Q1 2021 results presentation KRUK Group
Sound liquidity position and decision to raise recommended dividend per
share in 2021

                   ▪ The KRUK Group holds equity of PLN 2.2bn, representing 46% of its financing sources. With a net interest-
                     bearing debt to equity ratio of 0.9x and a net interest-bearing debt to cash EBITDA of 1.5x, KRUK’s financial
                     position is strong and stable.
Stable financial   ▪ As at March 31st 2020, the amount of cash and cash equivalents was PLN 170m. Cash held by the Group
 and liquidity       increased by PLN 24m quarter on quarter. The undrawn amount of lines of credit was PLN 1,132m as at
   position          March 31st 2021, having grown by PLN 86m compared with December 31st 2020.
                   ▪ In Q1 2021, under an open public issue prospectus, KRUK issued bonds for retail investors. The issue
                     comprised PLN 20m of five-year bonds with a fixed coupon of 4.2%. The proportional reduction rate applied
                     to subscription orders was 82.3%.

                   ▪ The KRUK S.A. Management Board has recommended dividend payment of PLN 11 per share in 2021.
                   ▪ As a listed company since 2011, KRUK distributed an aggregate income of PLN 383m to its shareholders
                     between 2015 and 2020.
   Income
                   ▪ The intention of KRUK’s Management Board, within the period covered by its 2019–2024 strategy, is to
 distribution        make the amount of income distributions to shareholders dependent on the Company’s financial standing
                     and prevailing market conditions, allowing for re-investment of profit in the Company’s growth with a view
                     to increasing its value.

                                                                                                                                     5
Q1 2021 results presentation KRUK Group
KRUK Group and corporate social responsibility in Q1 2021

                    ▪ We safeguard compliance with social and legal norms requiring that everyone must fulfil their obligations, always being
    Mission           respectful to people.

                    ▪ Support for medical professionals at the front line of fight against COVID-19. In the Czech Republic – ‘Energy for medical
                      personnel’ initiative, whereby we provided fresh fruit to the hospital staff in Hradec Králové.
   Society and      ▪ Financial education – online campaigns to promote safe online management of debt via eKRUK, as well as the use of electronic
     clients          banking.
                    ▪ To mark the occasion of the World Consumer Day – ‘Consumer During COVID-19’ online conference held by ERIF BIG S.A. with
                      free consumer advice provided by Aquila lawyers.

   Employees        ▪ Building and fostering team relations and strengthening the motivation of staff, who still largely continue to work from home,
                      through a team-building event (pub quiz).
and the workplace   ▪ Development of a new optimal model for hybrid work after the staff’s return to offices.

  Environment       ▪ Car fleet replacement – reduction of CO2 emissions by selecting cars that consume less fuels compared with those previously
   protection         used by field advisors, with an added benefit of improved safety.
                    ▪ Field Advisors use tablets and electronic singatures, what decreases the paper usage.
   measures

                    ▪ Business Superbrands 2021 – KRUK S.A. distinguished for service quality, business partner relations, innovation and CSR efforts
                    ▪ Trusted Brand 2021 – business community award for KRUK S.A.
    Awards          ▪ Poland’s Best Employer – 15th place in the ‘Banks and Financial Services’ category of the ranking compiled by Forbes and the
                      Statista research firm
 and distinctions   ▪ Distinction from UNIREC to KRUK Italia for supporting clients during the pandemic and enabling them to repay their debt
                      remotely via e-KRUK

                                                                                                                                                  6
Q1 2021 results presentation KRUK Group
10 years of KRUK on the WSE

                    ▪ KRUK shares were floated on the Warsaw Stock Exchange in May 2011,
                      with a price of PLN 39.70 per share, total IPO value of PLN 369m and
                      market capitalisation of PLN 627 m
                    ▪ At the end of 2016, KRUK launched a private placement of 1m shares at
                      PLN 215 per share
                    ▪ In July 2017, KRUK share price reached an all-time high, the shares traded
                      at PLN 349.7, translating into market capitalisation of PLN 6.6bn
                    ▪ Currently, KRUK shares are valued at PLN 180, up on the pre-pandemic
                      level of January 2020,
                    ▪ From the IPO date to March 31st 2021, KRUK share price rose by PLN
                      143.50,
                    ▪ KRUK shareholders include open-ended pension funds, domestic and
                      foreign investment fund managers (e.g. from Norway and US), as well as
                      retail investors.
                    ▪ KRUK is a constituent stock of WIG, WIG30, FITSE EM and MSCI Global Cap
                      indices
                    ▪ KRUK is now 5th on the WIG20 Reserve List (revised Jun 19 2020).
                    ▪ Research coverage of KRUK stock is currently provided by ten Polish and
                      international institutions, including: Citi Bank, DM mBank, DM PKO BP, DM
                      Trigon, Erste Group, Ipopema, Pekao SA, Santander BM, Wood&Company

                                                                                                   7
Q1 2021 results presentation KRUK Group
10 years of KRUK on the WSE

                                       Price and volume of KRUK shares on the WSE
                     400,00                                                                                         3 500 000
                                                                                                                    3 000 000
                     300,00            Wolumen             Cena                                                     2 500 000
                                                                                                                    2 000 000
                     200,00
                                                                                                                    1 500 000
                     100,00                                                                                         1 000 000
                                                                                                                    500 000
                       0,00                                                                                         0
                        2011-05-01    2013-01-01      2014-09-01   2016-05-01      2018-01-01   2019-09-01

                                            Rate of return on KRUK shares vs indices
                     1000%
                      800%
                                        KRUK           WIG         mWIG40
                      600%
                      400%
                      200%
                        0%
                              2011   2012      2013      2014      2015     2016       2017     2018         2019     2020
                     -200%

                                                                                                                                8
Q1 2021 results presentation KRUK Group
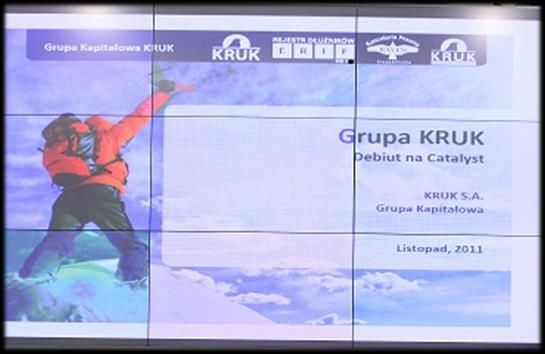
10 years of KRUK on Catalyst

                               ▪ KRUK’s presence on the debt market dates back to December
                                 2007
                               ▪ Its first issue of PLN 16.5m of three-year bonds (in 2007) was a
                                 private issue. They were floating cost bonds (3M WIBOR + 3%
                                 margin)
                               ▪ In 2011, KRUK debuted on the Catalyst market
                               ▪ Its first public issue took place in 2013
                               ▪ In 2015, KRUK issued its first fixed-coupon bonds
                               ▪ In 2017, KRUK launched two EUR-denominated bond issues on
                                 the Polish market with a total value of EUR 40m and 5-year
                                 maturity, bearing interest at a fixed rate of 3.59%
                               ▪ To date, KRUK has issued 65 series of bonds with a total nominal
                                 value of PLN 2.5bn, having redeemed 47 series with a total
                                 nominal value of PLN 1.36bn
                               ▪ Currently, KRUK has opened its 7th prospectus-based bond issue
                                 programme

                                                                                                    9
Agenda

Summary
Geographical and operating segments
Financial results
Additional information

                                      10
KRUK Group by segment in Q1 2021                                                                                      Q1 2021             Q1 2020

                                            Poland             Romania                 Italy           Other markets
                  (PLNm)                                                                                                  Head Office           TOTAL
                                       Q1 2021   Q1 2020   Q1 2021   Q1 2020   Q1 2021     Q1 2020   Q1 2021    Q1 2020

                                                                                                                                        Q1 2021 Q1 2020
Expenditure on debt portfolios             130                                                                                  N/A
                                                 46            20    11            0           0         10      0                       159            57

Recoveries                                 250   219                                                                            N/A      512        477
                                                              140    137           66      68            56     53

Carrying amount of purchased debt                              0.9   1.0           0.7     0.8
                                           1.9   1.9                                                     0.5   0.4              N/A       4.0           4.1
portfolios (PLNbn)

Revenue                                   199                  90    47            54                    39                     N/A      382        199
                                                 128                                       16                   9

          Purchased debt portfolios       166                  86    43            52                    36                     N/A      341        156
                                                 93                                        13                   6

          Credit management services        6                  3     3             2       3             3      3               N/A       15            14
                                                  6

          Wonga                            20    23                                                                             N/A       20            23

          Other activities                 6     6                                                                              N/A       7             6
                                                               1     1             0           0         0      0

EBITDA                                     122   41            63                                                         -15     -12    193            5
                                                                     23             12 -31               10    -16

Cash EBITDA                                205   167                 117                                                  -15     -12    364        326
                                                               116                                       31     30
                                                                                   26      24

                                                                                                                                                              11
KRUK Group’s operations in Poland
  (excluding Wonga)
                     (PLNm)                              Q1 2021        Q1 2020            y/y             ▪      In Q1 2021, KRUK invested PLN 130m on the Polish
Expenditure on debt portfolios                                   130             46           183%                market, representing 82% of its total expenditure. The
Recoveries                                                       250            219              14%              nominal value of purchased debt portfolios was PLN
Portfolio carrying amount                                        1929         1852               4%               761m. Recoveries in Q1 2021 reached PLN 250m, up
Revenue                                                          179            105              71%              14% year on year. Recoveries in Poland accounted for
           Including from purchased debt
                                                                 166             93              79%              49% of the Group’s total recoveries.
           portfolios
                    Including from
                                                                                                           ▪      The LTM portfolio profitability grew 4pp year on year,
                    revaluation of                                 5            -31          -118%                mainly on strong recoveries and upward revaluation
                    projected recoveries                                                                          of the projected recoveries.
           Credit management services                              6               6             3%        ▪      As at the issue date of the report, the KRUK Group
           Other activities                                        6               6             12%              was not aware of any new or proposed regulations
EBITDA                                                           113             36           209%                related to COVID-19 that could adversely affect the
Cash EBITDA                                                      196            163              20%              value of its debt portfolios.
Portfolio profitability (LTM)*                                   30%           26%               17%       ▪      The revaluation of projected recoveries from
The Other activities section does not include WONGA’s results.                                                    unsecured retail portfolios was positive at PLN 13m,
                                                                                                                  while the revaluation of projected recoveries from
                                                                                                                  secured portfolios delivered a negative total figure of
                                                                                                                  PLN -7m.

            * LTM portfolio profitability calculated as the sum of revenue from purchased portfolios for the last 12 months divided by the arithmetic mean of the portfolio value at the beginning and
            at the end of the last 12 months.
            ** Operational target is comprised of a forecast set in the 2020 budget (purchases of portfolios until October 2019) and pre-purchase valuations of portfolios purchased from November       12
            2019.
KRUK Group’s operations in Romania
                 (PLNm)                           Q1 2021          Q1 2020             y/y
                                                                                                       ▪      In Q1 2021, the amount invested by KRUK on the
Expenditure on debt portfolios                           20               11                76%
Recoveries                                              140              137                 2%
                                                                                                              Romanian market was PLN 20m, representing 12% of
Portfolio carrying amount                               861              973               -12%               its total expenditure. The nominal value of purchased
Revenue                                                  90               47                92%               debt portfolios was PLN 69m. In Q1 2021, recoveries
         Including from purchased debt
                                                             86               43             99%              amounted to PLN 140m, having remained broadly
         portfolios
                   Including from
                                                                                                              unchanged year on year. Recoveries in Romania
                   revaluation of                            11              -28          141%                accounted for 27% of the Group’s total recoveries.
                   projected recoveries                                                                ▪      The LTM portfolio profitability remained largely
         Credit management services                          3               3              4%
                                                                                                              unchanged relative to Q1 2020.
         Other activities                                    1               1             66%
EBITDA                                                      63              23            175%
                                                                                                       ▪      As at the issue date of the report, the KRUK Group was
Cash EBITDA                                                116             117              0%                not aware of any new or proposed regulations related
Portfolio profitability (LTM)*                             37%             37%              0%                to COVID-19 that could adversely affect the value of its
                                                                                                              debt portfolios.
                                                                                                       ▪      The revaluation of projected recoveries from
                                                                                                              unsecured retail portfolios was positive at PLN 15m,
                                                                                                              while the revaluation of projected recoveries from
                                                                                                              secured portfolios delivered a negative total figure of
                                                                                                              PLN -3m.

       * LTM portfolio profitability calculated as the sum of revenue from purchased portfolios for the last 12 months divided by the arithmetic mean of the portfolio value at the beginning
       and at the end of the last 12 months.
                                                                                                                                                                                                13
KRUK Group’s operations in Italy

                   (PLNm)                          Q1 2021          Q1 2020            y/y               ▪      In Q1 2021, the KRUK Group did not purchase any
Expenditure on debt portfolios                                 0               0                -               new portfolios in Italy, but is ready for new
Recoveries                                                    66              68             -3%                investments on the Italian market in the coming
Portfolio carrying amount                                   727             811            -10%                 quarters.
Revenue                                                       54              16          246%           ▪      The Group recorded PLN 66m in total recoveries
          Including from purchased                                                                              from the Italian market, a level comparable year on
                                                              52              13          298%
          debt portfolios
                   Including from                                                                               year. They accounted for 13% of the Group’s total
                   revaluation of                              0             -34          100%                  recoveries.
                   projected recoveries
                                                                                                         ▪      The ‘zero plus’ revaluation of projected recoveries
          Credit management services                           2               3             -9%
                                                                                                                relative to a downward revaluation in Q1 2020
EBITDA                                                        12             -31          140%
                                                                                                                drove a PLN 39m year-on-year increase in revenue
Cash EBITDA                                                   26              24             9%
                                                                                                                (up +298%).
Portfolio profitability (LTM)*                             19%              17%              11%
                                                                                                         ▪      The LTM portfolio profitability increased 2pp,
                                                                                                                mainly on solid recoveries.
                                                                                                         ▪      As at the issue date of the report, the KRUK Group
                                                                                                                did not identify any material legislative changes
                                                                                                                attributable to the coronavirus pandemic that could
                                                                                                                adversely affect the value of the Group’s debt
                                                                                                                portfolios.

         * LTM portfolio profitability calculated as the sum of revenue from purchased portfolios for the last 12 months divided by the arithmetic mean of the portfolio value at the beginning
         and at the end of the last 12 months.
                                                                                                                                                                                                  14
KRUK Group’s operations – other markets

                 (PLNm)                          Q1 2021   Q1 2020                   y/y
                                                                                                     ▪      The other markets are Spain, the Czech Republic,
Expenditure on debt portfolios                          10         0                        -
Recoveries                                              56        53                      7%
                                                                                                            Slovakia and Germany. As in Italy, in Q1 2021 the KRUK
Portfolio carrying amount                              480       438                      9%                Group did not purchase any new portfolios on the
Revenue                                                 39         9                    330%                Spanish market, but already in Q2 it purchased an
         Including from purchased
                                                           36                6          459%                unsecured debt portfolio with a nominal value of PLN
         debt portfolios
                   Including from
                                                                                                            415m. In the Czech and Slovak markets, KRUK invested
                   revaluation of                            2             -29          106%                PLN 10m in portfolios with a combined nominal value of
                   projected recoveries                                                                     PLN 47m.
         Credit management services                        3                3            17%
                                                                                                     ▪      In Q1 2021, recoveries from the ‘Other markets’ totalled
EBITDA                                                    10              -16           164%
Cash EBITDA                                               31               30             3%
                                                                                                            PLN 56m, up 7% year on year.
Portfolio profitability (LTM)*                           21%             13%             69%         ▪      An upward revaluation of projected recoveries in the
                                                                                                            ‘Other markets’ segment, compared with a downward
                                                                                                            revaluation in Q1 2020, drove a PLN 30m year-on-year
                                                                                                            increase in revenue (up 459%). Upward revaluations
                                                                                                            were recorded on portfolios in each country of the
                                                                                                            ‘Other markets’ segment.
                                                                                                     ▪      The portfolio profitability improved 8pp year on year,
                                                                                                            mainly as a result of the upward revaluation of projected
                                                                                                            recoveries.
                                                                                                     ▪      As at the issue date of the report, the KRUK Group did
                                                                                                            not identify any material legislative changes attributable
                                                                                                            to the coronavirus pandemic that could adversely affect
                                                                                                            the value of the Group’s debt portfolios.

        * LTM portfolio profitability calculated as the sum of revenue from purchased portfolios for the last 12 months divided by the arithmetic mean of the portfolio value at the beginning
        and at the end of the last 12 months.
                                                                                                                                                                                                 15
KRUK Group’s businesses - Wonga

         Net value                                 Carrying amount
    of loans advanced                              of loans advanced
          (PLNm)                                         (PLNm)

 125
                          102                     197               188

                                                                               ▪ As at the end of Q1 2021, the carrying amount of loans
                                                                                 advanced by Wonga was PLN 197m, up 5% year on year.
                                                                               ▪ The nominal value of loans advanced in Q1 2021 was PLN
Q1 2021               Q1 2020                  Mar 31 2021       Mar 31 2020
                                                                                 125m, up 22% year on year. In Q1 2021, Wonga’s EBITDA
                                                                                 came in at PLN 9.4m on revenue of PLN 19,7m.
                                                                               ▪ As at the issue date of the report, the KRUK Group did
                                                                                 not identify any material legislative changes attributable
          Revenue                                       EBITDA                   to the coronavirus pandemic except for the statutory
           (PLNm)                                       (PLNm)
                                                                                 reduction of a cap on non-interest costs of consumer
                                                                                 loans, effective until the end of June 2021.

   19,7              23
                                                 9,4                 4,4

 Q1 2021         Q1 2020                       Q1 2021            Q1 2020

    * Wonga was acquired on April 30th 2019.
                                                                                                                                         16
Other business lines - Novum Poland and ERIF

                             Revenue and EBITDA                                                      Revenue and EBITDA
                                  (PLNm)                                                                  (PLNm)

                  4.0       1.6              2.9      0.0                                2.1   0.6               2.5   0.9

                   Q1 2021                     Q1 2020                                      Q1 2021                 Q1 2020

                                  Revenue    EBITDA                                                   Revenue    EBITDA

                        Value of loans advanced                                                 Number of reports downloaded
                                 (PLNm)                                                                   (millions)
                                                                                               3.0                          3.3
                        33.5                                39.1

                7.1                             6.4

                 Q1 2021                           Q1 2020                                 Q1 2021                     Q1 2020

                Net loans                   Carrying amount of loans                                    Number of queries

▪ Novum’s revenue in Q1 2021 was PLN 4m, up 36% year on year.             ▪ As at the end of Q1 2021, the total number of records in the ERIF
  Novum’s EBITDA in Poland was PLN 1.6m. The main contributor to the        database was 109m, of which 97% were positive records. The total
  improvement was concentration on the least risky client segment and       value of the records was close to PLN 53.7bn.
  an increase in product margins (extended loan terms).                   ▪ The ERIF database is used by entities from various sectors,
▪ Novum sells its products mainly to KRUK Group clients who have            predominantly by banks and loan providers.
  successfully met their payment obligations and have a clean financial
  history with the Group.

                                                                                                                                                17
Agenda

Summary
Geographical segments
Financial results
Additional information

                         18
KRUK Group – P&L by business segments (presentation format)

                     PLNm                                                          Q1 2021               Q1 2020            Q2 2020            Q3 2020            Q4 2020               2020 Q1 21/20
Purchased debt portfolios
Expenditure on debt portfolios                                                             159                   57                  23                 33                344            456              180%
Recoveries                                                                                 512                  477                 417                452                488           1834                7%
Statement of profit or loss
Operating income                                                                           382                  199                 257                335                347           1138               92%
Purchased debt portfolios                                                                  341                  156                 223                295                303            976              118%
  including revaluation of projected recoveries                                             18                 -121                 -72                -10                 -2           -205             -115%
  Including deviations of actual recoveries and
  others*                                                                                   89                   25                  62                 73                 75            235             263%
Credit management services                                                                  15                   14                  13                 14                 16             57               4%
Other products and services                                                                 27                   29                  21                 27                 28            105              -7%
EBITDA                                                                                    195                     6                  65               165                137             379            3007%
EBITDA margin                                                                             51%                   3%                 25%                49%                39%            33%             1520%
Finance income/costs                                                                       -30                  -47                 -23                -28                -30           -128              36%
Gross profit                                                                              151                   -54                  36               127                  96            205             381%
Income tax                                                                                  24                    8                  -6                 73                 49            123             191%
 Income tax %                                                                             16%                 -15%                -18%                57%                51%            60%              203%
NET PROFIT                                                                                127                   -62                  43                 54                 47             81             305%
Net profit margin                                                                         33%                 -31%                 17%                16%                13%              7%             207%
ROE rolling                                                                               12%                  17%                 15%                14%                 4%              3%             -28%

CASH EBITDA**                                                                              364                  326                 265                324                322           1236                12%

                                                                                                                                                                                               Source: KRUK S.A.
  *Deviations of actual recoveries, decreases on early collections in collateralised cases, payments from original creditor*
  **Cash EBITDA = EBITDA + cash recoveries from purchased debt portfolios – revenue from collection of purchased debt. Cash EBITDA takes into account the impact of the CJEU judgment
  on Wonga's revenues.
                                                                                                                                                                                                                   19
The KRUK Group – P&L by geographical segments (presentation
format)

                PLNm     Q1 2021   Q1 2020       Q2 2020       Q3 2020   Q4 2020   2020        Q1 21/20
Operating income            382         199           257         335       347      1138               92%
       Poland               199         128           158         165       172       622               56%
       Romania               90          47            68          81       119       315               92%
       Italy                 54          16                3       58        40       117             246%
       Other countries       39              9         28          31        16           84          330%

EBITDA                      195              6         65         165       137       379           3007%
EBITDA margin               51%         3%           25%          49%       39%       33%
Finance income/costs         -30        -47           -23          -28       -30     -128               36%
Income tax                   24              8         -6          73        49       123             191%
Net profit                  127         -62            43          54        47           81          305%
Net profit margin           33%        -31%          17%          16%       13%           7%

                                                                                               Source: KRUK S.A.

                                                                                                                   20
KRUK Group – cash flows (presentation format)
                     PLNm                      Q1 2021   Q1 2020 Q2 2020 Q3 2020 Q4 2020   2020 Q1 21/20
Cash flows from operating activities:              301        225     247    266     261      999    34%
Recoveries − purchased debt portfolios            512        477     417     452     488    1834              7%
Operating costs − purchased debt portfolios       -123      -123    -102    -107    -137     -468             0%
Operating margin − credit management                4          2       3       4       4      14            54%
Administrative expenses                            -42       -37     -39     -39     -45     -160          -13%
Other operating cash flow                          -49       -95     -32     -44     -49     -221           48%
Cash flows from investing activities:             -162       -60     -26     -37    -345     -468         169%
Expenditure on debt portfolio purchases           -159       -57     -23     -33    -344     -456         180%
Other investing cash flow                           -3        -3      -3      -5      -1      -12          -18%
Cash flows from financing activities              -115       -79    -206    -214     -37     -535           47%
Issue of shares                                     0          0       0       0      -3       -3                   -
Dividend                                            0          0       0       0     -95      -95                   -
Increase in borrowings and lease liabilities      348        271     301      66     651    1288            29%
Issue of bonds                                     20          0       0      25       0      25                    -
Decrease in borrowings and lease liabilities      -445      -369    -530    -334    -516    -1749          -21%
Redemption of bonds                                65          0     -13       0     -75      -88                   -
Other financing cash flow                         -103        20      36      29    -188      86         -626%
Net cash flows:                                    24         86      15      15    -120       -5          -72%

                                                                                                Source: KRUK S.A.

                                                                                                                        21
The KRUK Group – selected items of the statement of financial position
(presentation format)
                                                     Mar 31   Dec 31   Sep 30   Jun 30   Mar 31
                                 PLNm                 2021     2020     2020      2020    2020
     ASSETS
     Cash and cash equivalents                         170      146      266      251        236
     Investments in debt portfolios and loans         4 234    4 209    3 984   4 076     4 307
     Other assets                                      267      289      262      311        307
     Total assets                                     4 672    4 643    4 511   4 638     4 850
     EQUITY AND LIABILITIES
     Equity                                           2 187    2 043    2 064   1 990     1 953
              of which: Retained earnings             1 671    1 544    1 497   1 533     1 496
     Liabilities                                      2 485    2 600    2 448   2 648     2 897
              of which: Bank borrowings and leases     804      908      765    1 031     1 259
                    Bonds                             1 273    1 314    1 383   1 354     1 376
     Total equity and liabilities                     4 672    4 643    4 511   4 638     4 850
     DEBT RATIOS
     Interest-bearing debt                            2 077    2 222    2 148   2 385     2 635
     Net interest-bearing debt                        1 907    2 076    1 882   2 134     2 399
     Net interest-bearing debt to equity                0,9      1,0      0,9      1,1        1,2

                                                                                         Source: KRUK S.A.

                                                                                                             22
KRUK has a strong liquidity position and is poised to increase
      investments going forward
    Net debt/equity 0.9x
    Net debt/cash EBITDA: 1.5x
                                                                                           Bank
                                                                                           loans         % 1M WIBOR + 1.0-2.75pp
                                                                                                           1M EURIBOR + 2.2-2.75pp
                                                                                                                                                PLN 1,863m, including
                                                                                                                                                66% available also in EUR

             437      Other
                      assets                                                                                                                    in PLN: PLN 1,083m
             237                                                                            Bonds        %      3M WIBOR + 3.0-4.0pp
                                                                                                                Fixed rate: 3.59–4.8pp          in EUR: PLN 186m

                                      2,187 Equity                                   Amount available (undrawn)
                                                                     1,132           under credit facilities

                                                                                     Debt under bank loans (drawn)
                                                                      731
            3,997

                                      2,485
                                                                     1,269
                                                                                        475            469
                                                                                              794
                                                                                                                                          210     190
                                                                                                             325      65             50                          20
                                                                       Kategoria 1

                                                                                                                           260                             20          0
            Assets          Equity and liabilities          Liabilities under bank
                As at: Mar 31 2021                          loans and bonds*              2021           2022          2023           2024          2025          2026

Investments in debt portfolios                                                                Planned for redemption in the year**        Planned balance at year end **
Carrying amount of loans                          Liabilities

       * Nominal values as at March 31st 2021.
       ** Nominal values as at March 31st 2021.                                                                                                                       23
KRUK Group – estimated remaining collections (ERC)
                                                                         Estimated remaining collections (ERC)*
mln PLN                                                                                                                                   Mar 31 2021             Dec 31 2020
1 800
1 600
                     1,568                                                                                                                  1,623     1,632
1 400     1,561
1 200                                 1,361      1,406
1 000                                                            1,190      1,177
 800
                                                                                              890       865
 600
                                                                                                                     644       636                                 642       659
 400
 200
   0
            up to 12 months         from 13 to 24 months        from 25 to 36 months        from 37 to 48 months   from 49 to 60 months   from 61 to 120 months    over 120 months

                                                           Estimated remaining collections (ERC) cumulatively*
mln PLN                                                                                                                                   Mar 31 2021             Dec 31 2020
9 000
8 000
7 000                                                                                                                                                             7,911     7,943
                                                                                                                                            7,269     7,284
6 000
5 000                                                                                                               5,646     5,652
4 000                                                                                        5,002     5,017
                                                                 4,112      4,152
3 000
2 000                                 2,922      2,974
1 000     1,561      1,568
   0
            up to 12 months            up to 24 months             up to 36 months            up to 48 months        up to 60 months        up to 120 months       over 120 months

          * ERC – estimated remaining undiscounted collections from purchased portfolios.

                                                                                                                                                                                     24
Agenda

Summary
Geographical segments
Financial results
Additional information

                         25
Investor Relations
                           Issue of financial statements in 2021                                    Shareholders with ownership interests above 3%*
   Date                         Financial statements                                                   Shareholder                                  Ownership interest
                                                                                        OFE Nationale-Nederlanden                                                                 13.66%
   March 25th                   2020 full-year financial statements
                                                                                        Piotr Krupa                                                                                9.63%
   May 24th                     Q1 2021 financial statements                            OFE PZU Złota Jesień                                                                       9.39%
   June 15th                    Wood’s EME Financials& Real Estates                     OFE Aviva Santander                                                                        8.97%
                                                                                        OFE Allianz Polska                                                                         5.31%
   September 8th                H1 2021 financial statements
                                                                                        OFE MetLife                                                                                4.92%
   November 3rd                 Q3 2021 financial statements                            OFE Generali                                                                               4.53%
                                                                                        OFE Aegon                                                                                  4.10%
                                                                                        OFE AXA                                                                                    3.64%
               KRUK as the 35th most liquid stock on the WSE                                                      Most recent recommendations
                                                                                                      Date                  Institution         Recommendation           Target price
3 500 000
                                                                                        May 2021                            DM Trigon                  Hold               PLN 190.00
3 000 000                                                                               April 2021                            BDM                     Reduce              PLN 168.00
                                                                                        December 2020                      DM mBanku                   Buy                PLN 174.96
                                                                                        For more information, go to pl.kruk.eu/relacje-inwestorskie/raporty/raporty-analityczne
2 500 000
                                                                                                                             Research coverage
                                                                                             Brokerage
2 000 000                                                                                                                Analyst                           Email address
                                                                                               house
                                             1 330 584                                  BDM                    Michał Fidelus               michal.fidelus@bdm.com.pl
1 500 000                                                                 1 239 508
                            1 098 895                                                   DM mBanku              Michał Konarski              michal.konarski@mdm.pl
            790 211                                          994 814                    DM PKO BP              Jaromir Szortyka             jaromir.szortyka@pkobp.pl
1 000 000
                                                                              566 759   CITI                   Andrzej Powierża             andrzej.powierza@citi.com
                                                                                        DM Pekao               Jerzy Kosiński               jerzy.kosinski2@pekao.com.pl
 500 000
                                                                                        DM Trigon              Grzegorz Kujawski            grzegorz.kujawski@trigon.pl

       0                                                                                Ipopema                Łukasz Jańczak               lukasz.janczak@ipopema.pl
                  2016                                                                  Santander BM           Kamil Stolarski              kamil.stolarski@santander.pl
                                                                                                               Marta Jeżewska-
                           Monthly volume        Average monthly volume                 Wood & Co.                                          marta.jezewska-wasilewska@wood.com
                                                                                                               Wasilewska

            *Source: stooq.pl

                                                                                                                                                                                        26
KRUK on the financial market
             KRUK’s relations with the market are maintained through:
             ▪ Earnings conferences (held as video-conferences during the pandemic) for both Polish and foreign
               investors
             ▪ Participation in countrywide and international debt collection, financial sector and emerging markets
               conferences (in Sweden, the US, the Czech Republic, the UK, Romania)
             ▪ International roadshows in the US, Austria, Germany and the UK
             ▪ Participation in meetings for retail investors (e.g. Wall Street in Karpacz)
             ▪ Investor days at the KRUK office
             ▪ Invitation of brokerage house analysts and financial journalists to the Italian office
             ▪ Investor campaigns
             ▪ Investor chats
             ▪ YouTube videos for investors.

             KRUK has been recognised by investors and journalists with numerous awards, including:
             ▪ The Best Annual Report 2011 – distinction for the best annual report in terms of its usability
             ▪ Listed Company of the Year 2014
             ▪ Listed Company of the Year 2017 in the ‘Management Expertise’ category
             ▪ Entrepreneur of the Year 2017 title for Piotr Krupa, President of the Management Board of KRUK S.A.
             ▪ Readers’ award for Piotr Krupa as CEO of the most ‘successful company on the stock exchange’ at the Gala
               CFA Investment Night in 2015
             ▪ CEE Capital Markets Awards 2015 – Top Performing Company of the Year
             ▪ Capital Market Hero 2017 and 2018 from the Association of Retail Investors
             ▪ ‘Ethical Company 2018’ title awarded by Puls Biznesu
             ▪ Employer of the Year 2019 in Romania
             ▪ Superethical Company award from Puls Biznesu and PwC in 2020.

                                                                                                                       27
LEGAL DISCLAIMER
The following notice relates to the content of this document, the oral presentation of its content delivered
by KRUK S.A. or any person acting on behalf of KRUK S.A., and any information provided in response to
questions that may arise in connection with the presentation of this document (jointly the “Presentation”).
The materials included herein have been prepared by KRUK S.A. (the “Company”). No part of this
Presentation may be reproduced or used for any purpose without the Company’s consent.
Information contained herein was collected and prepared with due care, based on facts and sources
deemed reliable by the Company, in particular the relevant financial statements.
This Presentation is purely informational and does not constitute an offer within the meaning of the civil
law, a public offering within the meaning of the Public Offering Act, a proposal or invitation to acquire, or
an advertisement for, any securities of the Company.
No part of this Presentation creates an obligation to enter into any agreement or establish any legal
relationship to which the Company or its subsidiary would be a party.
No information herein purports to be a recommendation, investment, legal or tax advice, or an indication
that any investment or strategy is suitable to the institution or to any other person to whom this
Presentation is made available.
The Company does not guarantee the completeness of information contained herein, nor does it assume
responsibility for the outcomes of investment decisions made in reliance hereon.
Only the decision maker shall be liable for investment decisions and any damage suffered as a result of such
decisions. Therefore, any person who intends to make a decision to invest in securities issued by the
Company is advised to rely on information disclosed by KRUK S.A. in its official releases, in accordance with
the applicable laws and regulations.
This Presentation may include statements and views concerning future and uncertain events, i.e. all
statements other than those relating to historical data. Such forward-looking statements may involve
identified or unidentified threats, uncertainties and other material factors beyond the Company’s control,
which may cause the Company’s actual results or achievements to differ substantially from the expected
results or achievements expressed or implied by such forecasts.
Please note that information contained in this Presentation may become outdated, but the Company does
not assume an obligation to update it, unless otherwise stated.

                                                                                                                28
KRUK S.A.
                ul. Wołowska 8
            51-116 Wrocław, Poland
                www.kruksa.pl

        Investor Relations contact: ir@kruksa.pl
Investor website: https://pl.kruk.eu/relacje-inwestorskie
You can also read