Efficient Retirement Portfolios: Using Life Insurance to Meet Income and Bequest Goals in Retirement - MDPI
←
→
Page content transcription
If your browser does not render page correctly, please read the page content below
risks
Article
Efficient Retirement Portfolios: Using Life Insurance
to Meet Income and Bequest Goals in Retirement
Fangyuan Dong 1 , Nick Halen 2 , Kristen Moore 3, * and Qinglai Zeng 4
 1    Paid Growth Analyst, Airbnb, Inc., 888 Brennan St., San Francisco, CA 94103, USA;
      keiradong1020@gmail.com
 2    Strategy, Research and Analytics, New York Life, 51 Madison Avenue, New York, NY 10010, USA;
      Nick_Halen@newyorklife.com
 3    Department of Mathematics, University of Michigan, 2074 East Hall, 530 Church Street,
      Ann Arbor, MI 48109-1043, USA
 4    People Advisory Services, Ernst & Young LLP, 155 North Wacker Drive, Chicago, IL 60606, USA;
      qinglai318@gmail.com
 *    Correspondence: ksmoore@umich.edu; Tel.: +1-734-615-6864

 Received: 26 October 2018; Accepted: 4 January 2019; Published: 18 January 2019

 Abstract: Life Insurance Retirement Plans (LIRPs) offer tax-deferred cash value accumulation, tax-free
 withdrawals (if properly structured), and a tax-free death benefit to beneficiaries. Thus, LIRPs share
 many of the tax advantages of other retirement savings vehicles but with less restrictive limitations
 on income and contributions. Opinions are mixed about the effectiveness of LIRPs; some financial
 advisers recommend them enthusiastically, while others are more skeptical. In this paper, we examine
 the potential of LIRPs to meet both income and bequest needs in retirement. We contrast retirement
 portfolios that include a LIRP with those that include only investment products with no life insurance.
 We consider different issue ages, face amounts, and withdrawal patterns. We simulate market
 scenarios and we demonstrate that portfolios that include LIRPs yield higher legacy potential and
 smaller income risk than those that exclude it. Thus, we conclude that the inclusion of a LIRP can
 improve financial outcomes in retirement.

 Keywords: life insurance retirement plan; simulation; efficient frontier

1. Introduction
      Retirees face significant financial risk and competing financial objectives. Pfau (2014) summarizes
them as lifestyle, longevity, legacy, and liquidity. In retirement, individuals need steady income to fund
their day-to-day expenses (lifestyle), they face the risk of outliving their retirement savings (longevity),
they may wish to leave a bequest to heirs (legacy), and they must have reserves for healthcare costs or
other unforeseen expenses (liquidity). They must construct and manage their portfolios to address
both their need for secure lifetime income and wealth accumulation.
      In the United States, employer-sponsored retirement plans fall broadly into two categories:
Defined Benefit (DB) and Defined Contribution (DC). For both types of plans, employers and employees
make contributions to fund future benefits. In a DB plan, the employee’s retirement benefit is calculated
on the basis of factors such as age, length of service, final average salary, etc. The retirement benefits
may be paid as a life annuity; thus, they offer retirees the prospect of a secure lifetime income. The
employer manages the investment fund and assumes all investment and longevity risks. In a DC
plan, the participants choose among a set of investment options according to their time horizon and
risk tolerance. They contribute to their retirement account and, upon retirement, they must manage
their nest egg to fund their retirement. Because of the upside potential of equities markets, DC plans

Risks 2019, 7, 9; doi:10.3390/risks7010009                                         www.mdpi.com/journal/risks
Risks 2019, 7, 9                                                                                  2 of 11

offer the potential for significant wealth accumulation. However, the plan participant bears all of the
investment and longevity risk and thus might have insufficient income in retirement or might outlive
their savings.
      The shift from DB retirement plans, under which retirees can receive guaranteed income for life,
toward DC plans is well documented (EBRI 2016). A prudent investor should add longevity-protected
vehicles such as life annuities and life insurance to manage longevity risk and to protect against
downside market risk.
      There is considerable literature on using life annuities to manage income risk (see
Chen and Milevsky (2003), Milevsky et al. (2006), and the references contained therein). In a different
vein, Bayraktar et al. (2014, 2015) and Bayraktar and Young (2016) used stochastic optimal control to
determine strategies to maximize the probability of reaching a bequest goal.
      Pfau (2014) considered combinations of investment portfolios, annuities, and life insurance and
examined their performance relative to income and legacy wealth. The annuity, along with withdrawals
from the investment fund, provided income, and the life insurance provided bequest.
      In this paper, we examine the potential of life insurance to meet both income and bequest needs
in retirement. In particular, we examine the effectiveness of Life Insurance Retirement Plans (LIRPs) in
a retirement portfolio.

LIRPs and Other Retirement Savings Vehicles
      In the United States, there are several different mechanisms through which investors can save for
retirement while enjoying certain tax advantages. In this section, we will briefly discuss some of these
vehicles, including 401(k) and related plans, Individual Retirement Accounts (IRAs), and Roth IRAs,
and we will contrast them with LIRPs.
      A 401(k) plan is a tax-qualified, employer-sponsored DC plan as defined in subsection 401(k) of
the United States Internal Revenue Code. Employees contribute a portion of their paycheck to their
401(k) plan. Often, employers provide a proportional match of the employee’s contribution. Often,
employees can choose how to invest their retirement funds from among a menu of investment options
offered by the employer. The contributions and investment earnings are tax-deferred; investors do not
incur income tax liability until they begin withdrawing funds in retirement, presumably when they
are in a lower tax bracket. Nonprofit and governmental employers may offer 403(b) and 457(b) plans,
respectively, which share many of the features of 401(k) plans.
      An IRA is a self-directed, not an employer-sponsored, retirement savings plan. Contributions to an
IRA are tax-deductible, and the investment earnings are tax-deferred. As with a 401(k) plan, individuals
only pay taxes when they withdraw the funds at retirement. A Roth IRA is also a self-directed
retirement savings plan. Unlike traditional IRAs, contributions are taxable as income; however, the
investment earnings and withdrawals are tax-free—not tax-deferred—subject to certain conditions.
      The 401(k) plans, IRAs, and Roth IRAs are subject to various income and contribution limits and
early withdrawal penalties. A concise overview of traditional and Roth IRAs is given in Spors (2018).
We refer the reader to McGill et al. (2010) and Allen et al. (2014) for more detailed information.
      Under a LIRP, investors contribute premiums to fund a cash value life insurance policy. Generally
speaking, the strategy is to overfund the policy, that is, to pay a large amount of premium for a
low face-amount policy. Careful planning is important. If the policy is too overfunded, it will be
classified as a Modified Endowment Contract, or MEC, instead of as life insurance for the purposes of
taxation. Policyholders can meet their income needs via withdrawals and policy loans. Contributions
are not tax-deductible; however, the cash value accumulation is tax-deferred, and withdrawals are
tax-free. Moreover, beneficiaries receive a tax-free death benefit upon the death of the policyholder.
Thus, a properly structured LIRP (one that is not classified as a MEC) offers tax-deferred cash value
accumulation, tax-free withdrawals, and a tax-free death benefit to beneficiaries. In other words, LIRPs
share many of the tax advantages of a Roth IRA. More significantly, the limits on income, contributions,
and withdrawals are considerably less restrictive than for Roth IRAs (again, subject to MEC limits).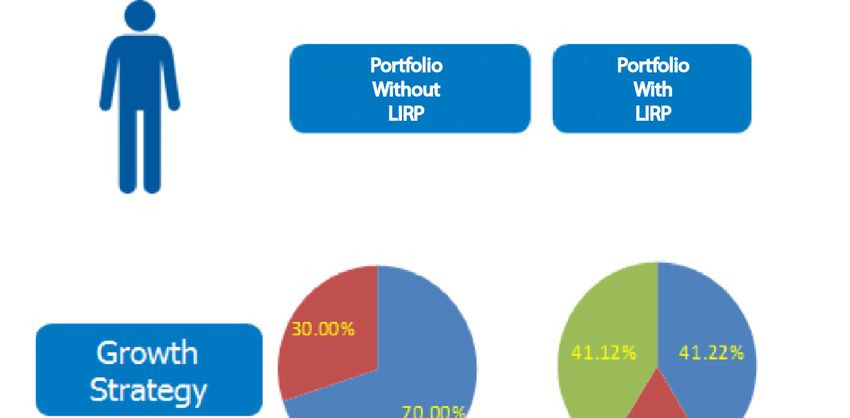
Risks 2019, 7, 9                                                                                      3 of 11

      Opinions are mixed about the effectiveness of LIRPs. Ikokwu (2013) enthusiastically recommends
LIRPs, describing them as a “turbo charged Roth IRA without the limitations.” McKnight (2012)
points out that if a LIRP is properly structured, the cost can be lower than the annual expenses
in a typical 401(k). Moreover, LIRPs can insulate investors from rising tax rates, and some
insurance companies allow policyholders to access death benefit proceeds to pay for long-term
care. Bloink and Byrnes (2011) are more skeptical. They point out that if investors are not savvy, the
policy could become classified as a MEC, which would eliminate the tax advantages on policy loans.
Moreover, if the policy lapses with outstanding loans, the amount of the loan is taxable. In addition,
they point to surrender fees, the cost of insurance, and other charges. They conclude LIRPs offer the
greatest benefit and fewer drawbacks for high-net-worth investors who have already maximized other
tax-advantaged retirement savings plans.
      In this paper, we contrast retirement portfolios that include a LIRP with those that include only
investment products with no life insurance. In other words, we contrast strategies that include, say,
a mutual fund only with those that include both a mutual fund and a LIRP. We consider different
issue ages, face amounts, and withdrawal patterns. We simulate market scenarios and, using the
Efficient Income Frontier (EIF) of Milevsky (2008) and Pfau (2013), we demonstrate that portfolios that
include LIRPs yield higher legacy potential and smaller income risk than those that exclude it. Thus,
we conclude that the inclusion of a LIRP can improve financial outcomes in retirement.

2. Methodology and Assumptions

2.1. Overview
    Let (x) represent an individual aged x and let T(x) be the future lifetime random variable for (x).
    We assume that (x) is endowed with initial wealth Ex . We set E35 = 50K, E45 = 200K, and E55 =
500K, and we assume further that (x) can invest Ex in a mutual fund and purchase life insurance.
    We define the following:

•     FA = face amount of the life insurance;
•     n = number of premium payments;
•     Ex = endowment of wealth of (x) at time 0;
•     FB = mutual fund balance at age 65;
•     α = percentage of accumulated mutual fund balance (FB) to withdraw at age 65. Beyond age 65,
      the mutual fund withdrawals are increased for inflation;
•     m = number of annual withdrawals from the life insurance product.

     We fix all of the values except FB a priori and we also fix values for the pre- and postretirement
tax rate and the loan interest rate.
     We define the premium burden to be the present value of future life insurance premiums divided
by Ex .
     We perform our calculations using two disjoint models: Our Excel-based market model for
the market and mutual fund calculations, and New York Life’s (NYL’s) illustration system for the
insurance calculations.
     We compute premiums and dividends using the illustration system, with dividends being added
to the policy’s cash value. Moreover, we use the illustration system to compute the amount of each
annual withdrawal from the life insurance product.
     We fix an allocation strategy for the mutual fund and we simulate 250 market outcome scenarios.
Please see Section 2.5 for more information about the asset allocation strategies.
     In the decumulation phase, we assume that the retiree will follow a systematic withdrawal plan;
in other words, they desire an annual income that is a fixed percentage α of their mutual fund balance
FB at age 65, increased for inflation thereafter. If they are also using a LIRP, we assume that for the first
Risks 2019, 7, 9                                                                                     4 of 11

m years of retirement, they take withdrawals (or loans) from the life insurance product. Thus, they can
decrease the amount that they withdraw from the mutual fund, thereby preserving the fund value.
     We examine whether the retiree has adequate income and bequest using the metrics described in
Section 2.2 below and we compare the performance of the resulting portfolios.

2.2. Mortality Assumption and Measures of Portfolio Performance
      We measure the performance of the portfolio using two metrics: Income risk and legacy potential.
Income risk measures how often, in 250 scenarios, income sources (both the mutual fund and the
income provided by the life insurance product) were depleted before the 75th percentile of T(x). Legacy
potential is the sum of the mutual fund value plus the death benefit at the 50th percentile of T(x).
Mortality is based on the Society of Actuaries Annuity 2012 Basic Mortality Table with Improvement
Scale G2. Thus, for example, according to our mortality table, the 50th percentile of T(35) is 45 and the
75th percentile is 51. For (35), income risk masures how often, in 250 trials, income is depleted before
age 86, while legacy potential measures the mutual fund value plus death benefit at age 80.
      In the retirement period, retirees are exposed not only to investment risk but also to longevity risk,
withdrawal rate risk, inflation risk, and sequence of returns risk. The income risk metric incorporates
all of these.
      We can visualize portfolio performance by plotting legacy potential versus income risk and then
identifying “efficient” portfolios, i.e., portfolios that maximize legacy potential while minimizing
income risk. In Section 3, we see that the inclusion of a life insurance product in a retirement portfolio
can improve financial outcomes and we identify which face amounts, withdrawal patterns, issue ages,
and asset allocation strategies are most efficient.
      We describe the life insurance product that we modeled and elaborate on our assumptions below.

2.3. The Insurance Product—Limited Pay Whole Life (LPWL)
     In our modeling, we construct the LIRP with NYL’s Custom Whole Life (CWL) product. CWL is a
participating (dividend-paying), cash value, limited payment whole life (LPWL) policy. Policyholders
can customize the duration of their premium payments. Subject to the limitations of an MEC, the
accumulation of the cash value is tax-deferred, the death benefit is tax-free, and policyholders can use
partial surrenders and policy loans to supplement their income.

2.4. Issue Ages (X)
      We consider policies issued at ages 35, 45, and 55 and assume that retirement occurs at age 65.

2.5. The Portfolio
     We consider a portfolio that consists of a mutual fund and possibly a life insurance product for
the LIRP. The life insurance product is described in Section 2.3.
     For the mutual fund, we examine four different allocations between stocks and bonds.

•     Moderate strategy: 30% stocks, 70% bonds
•     Balanced strategy: 50% stocks, 50% bonds
•     Growth strategy: 70% stocks, 30% bonds
•     Aggressive strategy: 90% stocks, 10% bonds

     We did initial testing to determine the optimal preretirement asset allocations. We describe the
asset allocations that we used in our simulations in Table 1 below.
     Then, we varied the postretirement asset allocation and examined the portfolio performance with
and without the LIRP.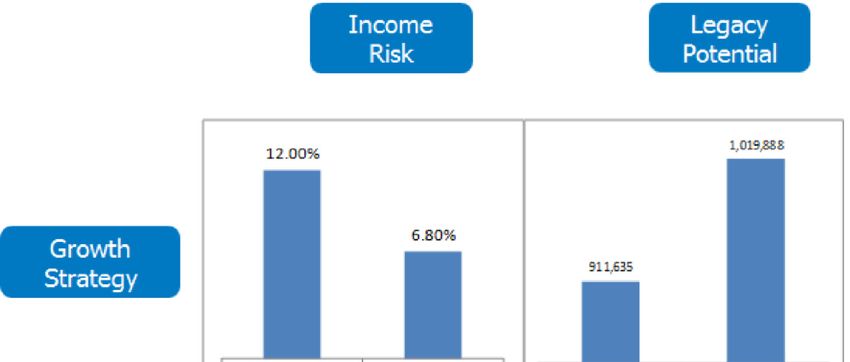
Risks 2019, 7, 9                                                                                     5 of 11

                                  Table 1. Preretirement asset allocation.

                           Age             Preretirement Asset Allocation
                            35                      Aggressive
                            45       Age 45–55: Aggressive; Age 55–65: Moderate
                            55                       Balanced

2.6. Simulation of Market Outcomes
     We assume that the stock and bond returns are correlated, lognormally distributed random
variables. We use the @Risk software package to implement Monte Carlo simulation. We simulate
250 market return scenarios, each of which had a 60-year time frame. Our assumptions are summarized
in Table 2 below.

                                       Table 2. Market parameters.

                                                        Stock       Bond
                                    Mean Return         7%           3%
                                 Standard Deviation     15%         5.5%
                                     Correlation                    20%

2.7. Number of Premium Payments (N)
     For policies issued at ages 35 and 45, we assume a 20-year premium payment period. For 55 year
olds, we assume a 10-year premium payment period. We compute the premium on the basis of the
face amount and the number of years of level premium payments using the illustration software.

2.8. Face Amounts (FA)
     For each issue age, we consider six different face amounts. For the 35-year-old case, we look into
a range of face amounts from $50,000 to $100,000. For the 45-year-old case, the range of face amount is
from $100,000 to $200,000. For the 55-year-old case, the range of face amount is $100,000 to $400,000.
We assume lower face amounts for younger individuals because they were endowed with lower initial
wealth Ex .

2.9. Number of Withdrawals (M)
     As a supplement to mutual funds, the life insurance product allows policyholders to take out
a certain amount of money as an income source for their retirement living expenses. We examine
withdrawal periods ranging from 10 to 25 years. The money withdrawn will subsequently decrease
the accumulated cash value as well as the death benefit. We use the illustration software to compute
the withdrawal amount, cash value, loan interest, and death benefit.

3. Results
     In this section, we present our numerical results. We first present a case study for illustration, and
then, more generally, we contrast numerous portfolios that include a LIRP with those that exclude
it. Moreover, we contrast the results for different face amounts, withdrawal patterns, and issue ages.
Specifically, we plot legacy potential versus income risk and identify an Efficient Income Frontier (EIF),
which consists of portfolios that best maximize legacy potential while minimizing income risk.

3.1. Case Study
    Consider a single male aged 55 who has initial wealth of $500,000 to invest in mutual funds. He
considers using a LIRP to optimize his retirement portfolio. Upon retirement at age 65, he makes
withdrawals according to a systematic withdrawal plan with the initial withdrawal amount equal to
3.5% of the initial mutual fund balance, increased for inflation thereafter.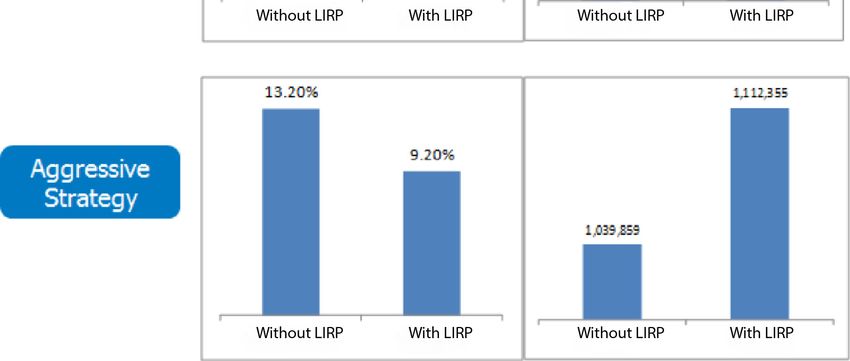
Risks 2019, 6, x FOR PEER REVIEW                                                                                           6 of 11

   3.1. Case Study
         Consider a single male aged 55 who has initial wealth of $500,000 to invest in mutual funds. He
    considers
Risks          using a LIRP to optimize his retirement portfolio. Upon retirement at age 65, he6 of
      2019, 7, 9                                                                                                              makes
                                                                                                                                11
   withdrawals according to a systematic withdrawal plan with the initial withdrawal amount equal to
   3.5% of the initial mutual fund balance, increased for inflation thereafter.
      As As
         we described
             we described  in Section    2.5, prior
                                  in Section      2.5,toprior
                                                         retirement,    he investshe
                                                                to retirement,      according
                                                                                        invests to    the balanced
                                                                                                   according     to theallocation
                                                                                                                           balanced
strategy. In Tables   3 and    4, we  show    selected   values   of the income   risk  and   legacy   potential,
   allocation strategy. In Tables 3 and 4, we show selected values of the income risk and legacy potential,         respectively,
that result if the that
   respectively,    investor
                          resultchooses      the face chooses
                                   if the investor      amount theandface
                                                                        number    of withdrawals
                                                                             amount     and numbershown           in the header
                                                                                                         of withdrawals       shown
rowinand  column.     We   assume      the balanced     asset  allocation   after retirement
      the header row and column. We assume the balanced asset allocation after retirement as well.as well.
      ForFor
          example,
             example, if the  investor
                           if the         buysbuys
                                   investor      life insurance    withwith
                                                      life insurance      100K100K
                                                                                face face
                                                                                      amount     and withdraws
                                                                                            amount     and withdraws  10 years  of
                                                                                                                            10 years
income   during
   of income      retirement,
                during             the income
                          retirement,             risk isrisk
                                          the income       20%,is and
                                                                  20%,theandlegacy  potential
                                                                              the legacy          is $530,067.
                                                                                            potential    is $530,067.
      Now,  we   contrast    the  results  for  the  growth   and    aggressive   asset
         Now, we contrast the results for the growth and aggressive asset allocation     allocation    strategies.   In Figure
                                                                                                             strategies.         1,
                                                                                                                           In Figure
we1,show   the allocation
      we show                 of Exofamong
                 the allocation         Ex amongstocks   (blue),
                                                     stocks       bonds
                                                             (blue),       (red),
                                                                       bonds      andand
                                                                               (red),   lifelife
                                                                                             insurance
                                                                                                 insurance premiums
                                                                                                              premiums    (green).
                                                                                                                             (green).
ForFor
     example,   for  the  growth      strategy,   the  premium      burden,   or  present   value    of
        example, for the growth strategy, the premium burden, or present value of future life insurance future   life  insurance
premiums,
   premiums, is 41%
                 is 41% of of
                            thetheinitial     endowmentExE.x. The
                                     initialendowment              The remaining
                                                                         remaining 59% 59% is is allocated
                                                                                                 allocated 70/30
                                                                                                              70/30totostocks
                                                                                                                           stocksand
andbonds.
     bonds.

      Figure 1. Allocation of initial wealth among stocks, bonds, and life insurance premiums. LIRP: Life
         Figure 1. Allocation of initial wealth among stocks, bonds, and life insurance premiums. LIRP: Life
      Insurance Retirement Plans.
         Insurance Retirement Plans.
     In Figure 2 we show the values of income risk and legacy potential with and without a LIRP for
        In Figure
fixed values  of the2 face
                      we show
                            amountthe and
                                      values  of income
                                           number         risk and legacy
                                                    of withdrawals.        potential
                                                                      We see          with both
                                                                               that under  and without   a LIRP for
                                                                                                asset allocation
   fixed values
strategies,      of the
            despite  the face  amount
                          initial outlayand   number ofthe
                                          of premiums,     withdrawals.
                                                              inclusion ofWe
                                                                           thesee thatdecreases
                                                                                LIRP   under both
                                                                                                theasset allocation
                                                                                                    income   risk
and increases the legacy potential. The aggressive strategy produces higher legacy potential but alsorisk
   strategies, despite   the initial outlay  of premiums,    the inclusion of the  LIRP decreases  the income
   and increases
increases incomethe risklegacy  potential.
                          compared    to theThe  aggressive
                                             growth           strategy produces higher legacy potential but also
                                                      strategy.
   increases income risk compared to the growth strategy.
Risks 2019, 7, 9 7 of 11
Risks 2019, 6, x FOR PEER REVIEW 7 of 11
Figure2.2.Income
Figure Income risk
risk and legacy
legacy potential
potentialwith
withand
andwithout
withoutLIRP.
LIRP.
Table3.3.Selected
Table Selectedvalues
values of
of income risk for
income risk for the
thecase
casestudy. FA:face
study.FA: faceamount
amount
Number
Number of Withdrawals FAFA
of Withdrawals = $100,000
= $100,000 FA==$160,000
FA FA = $220,000
$160,000 FA = $220,000
10 10 20%
20% 20%
20% 20% 20%
11 11 19%
19% 19%
19% 20% 20%
12 12 19%
19% 19%
19% 19% 19%
Table 4. Selected values of legacy potential for the case study.
Table 4. Selected values of legacy potential for the case study.
Number of Withdrawals FA = $100,000 FA = $160,000 FA = $220,000
Number of Withdrawals
10 FA = $530,067
$100,000 FA$560,036
= $160,000 FA = $220,000
$592,848
10 11 $531,625
$530,067 $562,516
$560,036 $594,654
$592,848
11 12 $531,625
$532,988 $562,516
$564,898 $594,654
$596,886
12 $532,988 $564,898 $596,886
3.2. The Efficient Income Frontier
3.2. TheInEfficient Income
this section, weFrontier
show several plots of income risk versus legacy potential for portfolios that
consist only
In this of a mutual
section, we show fund, as well
several as for
plots those that
of income include
risk versusa legacy
LIRP and a mutual
potential for fund. As the
portfolios that
graphs show, the portfolios that include the LIRP often dominate those that exclude
consist only of a mutual fund, as well as for those that include a LIRP and a mutual fund. As the it.
graphsIn Figure
show, the3,portfolios
the issue age
thatisinclude
fixed at the
55. We
LIRPfirst remark
often that because
dominate those we
thatwish to maximize
exclude it. legacy
potential and minimize income risk, the optimal, or most efficient, portfolios are those in the
In Figure 3, the issue age is fixed at 55. We first remark that because we wish to maximize
“northwest” section of the graph. For portfolios that include only a mutual fund, there are only four
legacy potential and minimize income risk, the optimal, or most efficient, portfolios are those in the
portfolios corresponding to the four postretirement asset allocation strategies: Moderate, balanced,
“northwest” section of the graph. For portfolios that include only a mutual fund, there are only four
growth, and aggressive. We connect these four portfolios with the orange curve. We color-code other
portfolios corresponding to the four postretirement asset allocation strategies: Moderate, balanced,
portfolios according to the postretirement investment strategy: For example, the purple dots
growth, and aggressive. We connect these four portfolios with the orange curve. We color-code other
represent portfolios which include a LIRP and in which the mutual fund is a growth fund. Each
portfolios according to the postretirement investment strategy: For example, the purple dots represent
portfolios which include a LIRP and in which the mutual fund is a growth fund. Each purple dotRisks 2019, 7, 9 8 of 11
Risks 2019, 6, x FOR PEER REVIEW 8 of 11
Risks 2019, 6, x FOR PEER REVIEW 8 of 11
represents a different
purple dot face
represents amount face
a different or withdrawal strategy. The
amount or withdrawal black curve
strategy. is thecurve
The black EIF; in
is other words,
the EIF; in
purple dot
it connects represents
some of the a different
most faceportfolios.
efficient amount or withdrawal strategy. The black curve is the EIF; in
other words, it connects some of the most efficient portfolios.
other words, it connects some of the most efficient portfolios.
Figure
3. 3. Incomerisk
Income risk versuslegacy
legacy potential for
for all
all portfolios
portfoliosand
andEfficient
EfficientIncome Frontier (EIF).
Figure
Figure 3. Income riskversus
versus legacy potential
potential for all portfolios and Efficient Income
Income Frontier
Frontier (EIF).
(EIF).
In In Figure
Figure 4,4,again,
again,weweconsider
consideraa5555 year
year old.
old. We
We color-code
color-codethe thedots
dotson
onthe
thegraph
graphaccording
according to to
In Figure 4, again, we consider a 55 year old. We color-code the dots on the graph according to
the
thethe face
face amount
amount of the life insurance. For example, all of the red dots correspond to portfolios with a
face amountofofthethelife
lifeinsurance. For example,
insurance. For example,all allofofthe
thered
red dots
dots correspond
correspond to portfolios
to portfolios withwith
a
$400K
a $400K life insurance policy but with one of the 16 different income withdrawal patterns and one of
$400K life
life insurance policybut
insurance policy butwith
withoneoneofof
thethe
1616 different
different income
income withdrawal
withdrawal patterns
patterns andof
and one one
of the
the four
the fourdifferent
four differentpostretirement
different postretirement
postretirement
asset
asset
allocation
asset allocation
allocation
strategies
strategies
strategies
within the mutual
within
within
fund.fund.
the mutual
the mutual
We see
fund. We see Wethat
seethe
that that
the
highest face amounts occupy the northwest corner of graph; thus, we conclude that higher face
thehighest
highestfacefaceamounts
amountsoccupyoccupy the northwest corner of graph; thus, we conclude that
the northwest corner of graph; thus, we conclude that higher face higher face
amounts produce more efficient portfolios than lower face amounts.
amounts
amounts produce
produce more
moreefficient
efficientportfolios
portfoliosthan
than lower
lower face amounts.
face amounts.
Figure 4. Analysis of face amounts.
Figure4.
Figure 4. Analysis
Analysis of
of face
faceamounts.
amounts.Risks 2019, 7, 9 9 of 11
Risks 2019, 6, x FOR PEER REVIEW 9 of 11
In
In Figure
Figure 5,
5, the
theissue
issueage
ageisisagain
againfixed
fixedatat55.
55.This
Thistime,
time,we
wecolor-code
color-code thethe
portfolios
portfoliosaccording
accordingto
the number of withdrawals from the life insurance product. Thus, the red dots correspond
to the number of withdrawals from the life insurance product. Thus, the red dots correspond to to portfolios
with 22–25with
portfolios annual
22–25withdrawals from the life
annual withdrawals from insurance but withbut
the life insurance different face amounts
with different for the life
face amounts for
insurance and asset allocations within the mutual fund. We see that for a fixed
the life insurance and asset allocations within the mutual fund. We see that for a fixed value value of the legacy
of the
potential, the longest
legacy potential, withdrawal
the longest patternspatterns
withdrawal (red dots)
(redproduce the lowest
dots) produce the income risk. risk.
lowest income
Figure 5.
Figure 5. Analysis
Analysis of
of withdrawal
withdrawal years.
years.
Table5,5,
In Table wewe summarize
summarize the combinations
the combinations of faceofamount
face amount and withdrawal
and withdrawal patterns
patterns that that
minimize
minimize
income income
risk riskages
for issue for issue ages
35, 45, and35, 45,Inand
55. 55.6,
Table Inwe
Table 6, we summarize
summarize the combinations
the combinations of face
of face amount
amount
and and withdrawal
withdrawal pattern
pattern that that maximize
maximize legacy potential
legacy potential for these for these
issue issue ages.
ages.
Table 5. Insurance parameters
Table 5. parameters that
that yield
yield the
the lowest
lowest income
income risk.
risk.
LifeLife
Insurance Policy
Insurance Policy
Issue
Issue Age
Age Face Amount Withdrawal Years
Face Amount Withdrawal Years
Lowest
Lowest Income
Income Risk Risk 35 100K 12
3545 100K
200K 21 12
45 200K
55 400K 23 21
55 400K 23
Table 6. Insurance parameters that yield the highest legacy potential.
Table 6. Insurance parameters that yield the highest legacy potential.
Life Insurance Policy
Issue Age Life Insurance Policy
Face Amount Withdrawal Years
Issue Age
Largest Legacy Potential 35 100K
Face Amount 10
Withdrawal Years
Largest Legacy Potential
45 200K 22
35 100K 10
4555 400K
200K 17 22
55 400K 17
Finally, in Table 7, we contrast the results for different issue ages. We see that, in each case,
including a LIRP in the portfolio decreases income risk and increases legacy potential. We note that,
Finally, in Table 7, we contrast the results for different issue ages. We see that, in each case,
in our tests, the effect is more pronounced at ages 45 and 55 than at 35.
including a LIRP in the portfolio decreases income risk and increases legacy potential. We note that,
in our tests, the effect is more pronounced at ages 45 and 55 than at 35.Risks 2019, 7, 9 10 of 11
Table 7. Issue age comparison.
Issue Initial Face Premium Lowest Income Risk Largest Legacy Potential
Age Asset Amount Burden Without LIRP With LIRP Without LIRP With LIRP
35 50K 100K 67.63% 14.4% 13% 1,144,719 1,208,479
45 200K 200K 44.30% 11.6% 4.8% 1,291,259 1,515,885
55 500K 400K 41.21% 12% 6.8% 1,039,859 1,114,554
4. Conclusions and Directions for Future Work
In this paper, we considered different asset allocation strategies, face amounts, and withdrawal
strategies and examined the income risk and legacy potential of the various portfolios under simulated
pre- and postretirement market outcomes. We demonstrated that portfolios that include a LIRP in
addition to mutual funds often outperform portfolios without a LIRP.
There are several avenues for further investigation. First, our metrics of portfolio performance,
income risk, and legacy potential, are based on percentiles of the future lifetime random variable
T(x). It would be worthwhile to compare the results if we simulated outcomes from T(x) as well as
market outcomes. This would allow us to compute the probability of depleting the income source
prior to death (or probability of lifetime ruin) and the probability of reaching a bequest goal. These
more sophisticated metrics are used in Chen and Milevsky (2003), Milevsky et al. (2006), Young (2004),
Bayraktar et al. (2014, 2015), and Bayraktar and Young (2016).
Moreover, beyond the simulation approach that we used here, it would be interesting to
investigate this problem via stochastic optimal control. For example, one might try to determine
the premium strategy to optimize a value function based on the probability of ruin and the probability
of meeting a bequest goal.
We chose to use the LPWL product for our modeling to balance sophistication (dividends, cash
value, flexible duration of premium payments) with model tractability. More sophisticated products
such as Universal Life (UL), Indexed Universal Life (IUL), and Variable Universal Life (VUL) are
more commonly used as investment vehicles than general account whole life products. In future
modeling, we would like to examine how portfolios that include, for example, a VUL-based LIRP
perform compared to those that exclude a LIRP. We expect that a VUL-based LIRP will improve
portfolio performance beyond our results here.
Author Contributions: Conceptualization, N.H.; methodology, F.D., N.H. and Q.Z.; validation, N.H.; formal
analysis, F.D., N.H., and Q.Z.; investigation, F.D., N.H., K.M., and Q.Z.; writing—original draft preparation, F.D.,
K.M., and Q.Z.; writing—review and editing, K.M.; supervision, N.H.; funding acquisition, K.M.
Funding: This research was funded by a Center of Actuarial Excellence Grant from the Society of Actuaries.
Acknowledgments: This project is part of the Industry Partnership Program (IPP) at the University of Michigan,
under which students work with both academic and practicing actuaries on problems that are directly relevant
to the industry. The authors gratefully acknowledge the support of the Society of Actuaries under the Center of
Actuarial Excellence Grant as well as New York Life (NYL) for their participation in the IPP.
Conflicts of Interest: The authors declare no conflict of interest.
References
Allen, Everett, Jr., Joseph Melone, Jerry Rosenbloom, and Dennis Mahoney. 2014. Retirement Plans: 401
(k) s, IRAs and Other Deferred Compensation Approaches, 11th ed. New York: McGraw-Hill Education,
ISBN 978-0-07-337743-8.
Bayraktar, Erhan, and Virginia R. Young. 2016. Optimally investing to reach a bequest goal. Insurance: Mathematics
and Economics 70: 1–10. [CrossRef]
Bayraktar, Erhan, S. David Promislow, and Virginia R. Young. 2014. Purchasing Life Insurance to Reach a Bequest
Goal. Insurance: Mathematics and Economics 58: 204–16.Risks 2019, 7, 9 11 of 11
Bayraktar, Erhan, S. David Promislow, and Virginia R. Young. 2015. Purchasing Term Life Insurance to Reach a
Bequest Goal: Time-Dependent Case. North American Actuarial Journal 19: 224–36. [CrossRef]
Bloink, Robert, and William H. Byrnes. 2011. Life Insurance Retirement Plans: Alternative or Rip-off? Available
online: http://www.thinkadvisor.com/2011/11/25/life-insurance-retirement-plans-alternative-or-rip?
&slreturn=1479162075 (accessed on 20 December 2018).
Chen, Peng, and Moshe A. Milevsky. 2003. Merging Asset Allocation and Longevity Insurance: An Optimal
Perspective on Payout Annuities. Journal of Financial Planning 16: 52–62.
EBRI. 2016. FAQs about Benefits—Retirement Issues. Available online: https://www.ebri.org/publications/
benfaq/index.cfm?fa=retfaq14 (accessed on 30 June 2016).
Ikokwu, Ike. 2013. What’s a LIRP and Why You Should Own One. Huffington Post. June 15. Available online:
http://www.huffingtonpost.com/ike-ikokwu/whats-a-lirp-and-why-you-_b_3084702.html. (accessed on
20 December 2018).
McGill, Dan M., Kyle N. Brown, John J. Haley, Sylvester J. Schieber, and Mark J. Warshawsky. 2010. Fundamentals
of Private Pensions, 9th ed. Oxford and New York: Oxford University Press.
McKnight, David C. 2012. What Is a LIRP? Available online: https://www.thinkadvisor.com/2012/05/11/whats-
a-l-i-r-p-2/ (accessed on 20 December 2018).
Milevsky, Moshe A. 2008. Are You a Stock or a Bond? Create Your Own Pension Plan for a Secure Financial Future.
Upper Saddle River: FT Press.
Milevsky, Moshe A., Kristen S. Moore, and Virginia R. Young. 2006. Asset Allocation and Annuity-Purchase
Strategies to Minimize the Probability of Financial Ruin. Mathematical Finance 16: 647–71. [CrossRef]
Pfau, Wade. 2013. A Broader Framework for Determining an Efficient Frontier for Retirement Income. Journal of
Financial Planning 26: 44–51.
Pfau, Wade. 2014. Optimizing Retirement Income by Combining Actuarial Science and Investments. One America
White Paper. Available online: https://www.owrsfirm.com/wp-content/uploads/OA_WP_Opt-Ret_Inc_
05-15_web.pdf (accessed on 20 December 2018).
Spors, Kelly. 2018. Traditional IRA vs. Roth IRA. Available online: https://www.rothira.com/traditional-ira-vs-
roth-ira. (accessed on 20 December 2018).
Young, Virginia R. 2004. Optimal Investment Strategy to Minimize the Probability of Lifetime Ruin. North American
Actuarial Journal 8: 105–26. [CrossRef]
© 2019 by the authors. Licensee MDPI, Basel, Switzerland. This article is an open access
article distributed under the terms and conditions of the Creative Commons Attribution
(CC BY) license (http://creativecommons.org/licenses/by/4.0/).You can also read