INVESTOR PRESENTATION - Cooper Standard
←
→
Page content transcription
If your browser does not render page correctly, please read the page content below
INVESTOR PRESENTATION
June 2017
Forward-Looking Statements
This presentation includes “forward-looking statements” within the meaning of U.S. federal securities laws, and we intend that such forward-looking statements be subject
to the safe harbor created thereby. Our use of words “estimate,” “expect,” “anticipate,” “project,” “plan,” “intend,” “believe,” “forecast,” or future or conditional verbs, such
as “will,” “should,” “could,” “would,” or “may,” and variations of such words or similar expressions are intended to identify forward-looking statements. All forward-looking
statements are based upon our current expectations and various assumptions. Our expectations, beliefs, and projections are expressed in good faith and we believe there is
a reasonable basis for them. However, we cannot assure you that these expectations, beliefs, and projections will be achieved. Forward-looking statements are not
guarantees of future performance and are subject to significant risks and uncertainties that may cause actual results or achievements to be materially different from the
future results or achievements expressed or implied by the forward-looking statements. Among other items, such factors may include: prolonged or material contractions
in automotive sales and production volumes; our inability to realize sales represented by awarded business; escalating pricing pressures; loss of large customers or
significant platforms; our ability to successfully compete in the automotive parts industry; availability and increasing volatility in costs of manufactured components and
raw materials; disruption in our supply base; possible variability of our working capital requirements; risks associated with our international operations; foreign currency
exchange rate fluctuations; our ability to control the operations of our joint ventures for our sole benefit; our substantial amount of indebtedness; our ability to obtain
adequate financing sources in the future; operating and financial restrictions imposed on us under our debt instruments; the underfunding of our pension plans; significant
changes in discount rates and the actual return on pension assets; effectiveness of continuous improvement programs and other cost savings plans; manufacturing facility
closings or consolidation; our ability to execute new program launches; our ability to meet customers' needs for new and improved products; the possibility that our
acquisitions and divestitures may not be successful; product liability, warranty and recall claims brought against us; laws and regulations, including environmental, health
and safety laws and regulations; legal proceedings, claims or investigations against us; work stoppages or other labor disruptions; the ability of our intellectual property to
withstand legal challenges; cyber-attacks or other disruptions in our information technology systems; the possible volatility of our annual effective tax rate; the possibility of
future impairment charges to our goodwill and long-lived assets; and our dependence on our subsidiaries for cash to satisfy our obligations.

You should not place undue reliance on these forward-looking statements. We undertake no obligation to publicly update or otherwise revise any forward-looking
statement, whether as a result of new information, future events or otherwise, except where we are expressly required to do so by law.

This presentation also contains estimates and other information that is based on industry publications, surveys, and forecasts. This information involves a number of
assumptions and limitations, and we have not independently verified the accuracy or completeness of the information.

                                                                                                                                                                                     2
COMPANY OVERVIEW

                   3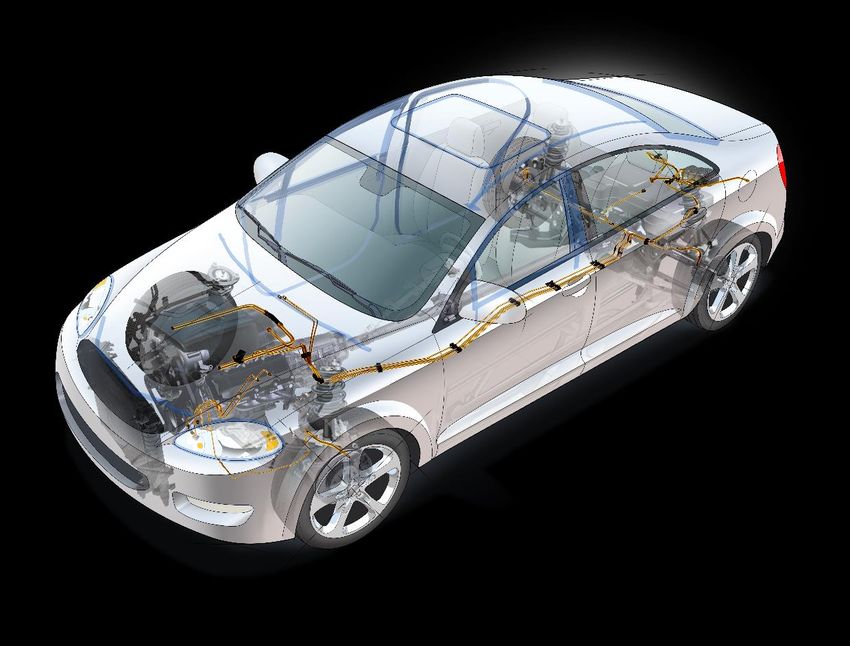
Cooper Standard - Value Drivers

 1
     Leading Market Positions in All Product Lines

 2
     Significant Organic Growth Opportunities via Increasing Content per Vehicle (“CPV”) and New Business Wins on
     High Volume Global Platforms

 3
     Advantaged Global Manufacturing Footprint Provides Access to High-volume Global Platforms

 4
     Value-added Technology Innovated by CPS – Driving Increased Sales, Margins, and Strong Customer Relationships

 5
     World-class Operations Initiatives Driving Operating Efficiencies and Improved Cost Structure

 6
     Strong Financial Profile With Focus on Cash Flow Generation and Margin Improvement

                                                                                                                     4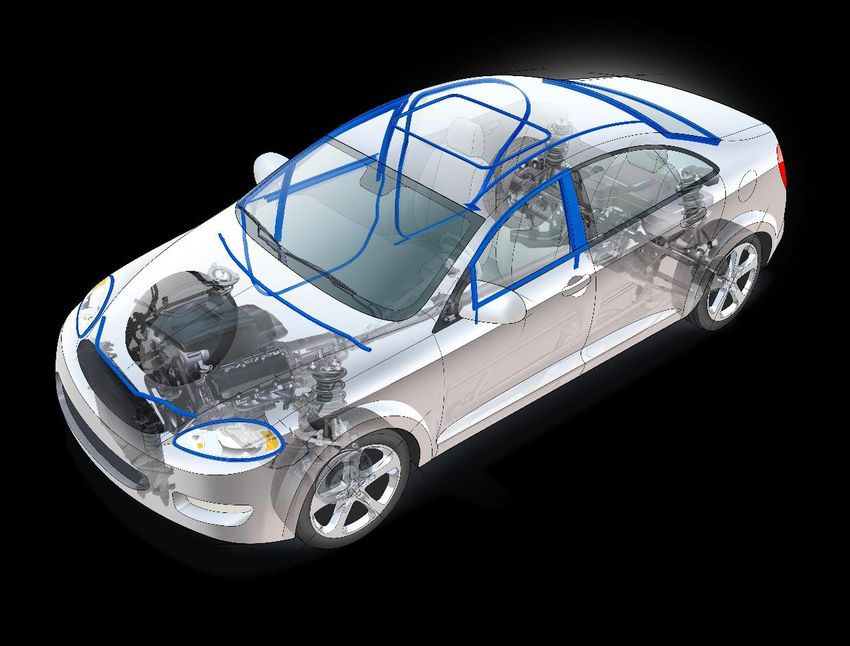
1   MARKET LEADER

     Core Product Lines
       2016 Revenue by product / % of Total Revenue

                                               Sealing Systems
                                               Sealing Systems
                                                      $1.8B / 52%

                                                     #1 Globally
                                                    #1  Globally

                                             Fuel & Brake Delivery
                                             Fuel & Brake Delivery
                                                   Systems
                                                   Systems
                                                      $0.7B / 21%

                                                     #2 Globally
                                                    #2  Globally

                                                    Fluid Transfer
                                                    Fluid Transfer
                                                       Systems
                                                       Systems
                                                      $0.5B / 14%
                                                     #3 Globally
                                                    #3  Globally

                                                    Anti-Vibration
                                                    Anti-Vibration
                                                      Systems
                                                      Systems
                                                       $0.3B / 9%
                                          North American Leader

      Market position data by Booz & Co. (2013) and Boston Consulting Group (2016)

                                                                                     5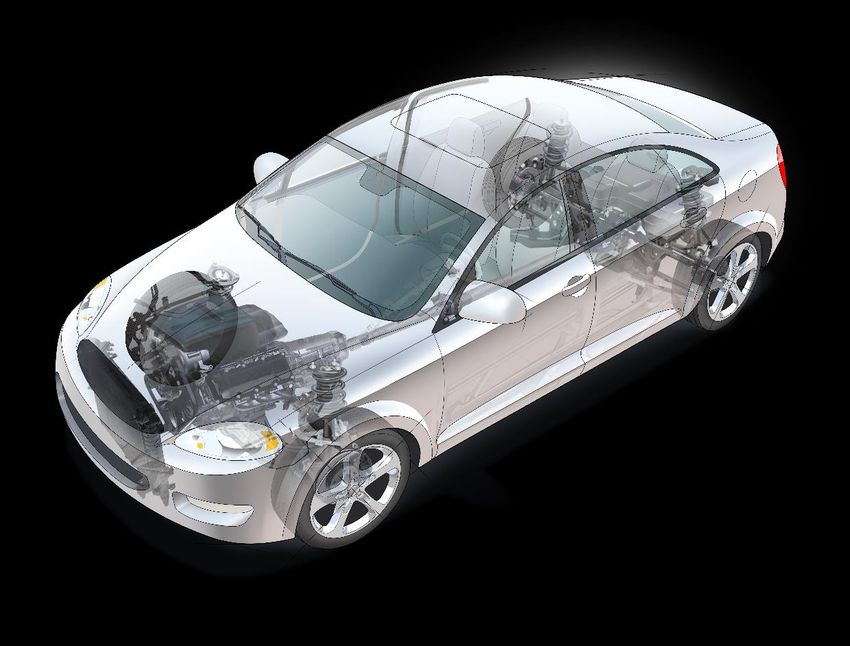
1   MARKET LEADER

     Large, Fragmented Markets Represent Significant Growth Potential
                                                                                                                                     Key Competitors

                                                                                                                              CPS   Henniges
                          Sealing Systems
                          Sealing Systems                                                                                           Hutchinson
                                 $1.8B / 52%                        Global Market Size: $8.3 billion                                Standard Profil
                                                                                               1                    Market
                                                                    CPS Current Share: 24%                                          Saar Gummi
                                                                                                                                    Toyoda Gosei
                                #1 Globally
                               #1  Globally

                         Fuel & Brake Delivery                                                                                CPS
                         Fuel & Brake Delivery                                                                                      TI Automotive
                               Systems                               Global Market Size: $6.3 billion                               Martinrea
                               Systems
                                 $0.7B / 21%                                                   2                                    Usui
                                                                     CPS Current Share:     9%                      Market          Sanoh
                                #2 Globally
                               #2  Globally

                              Fluid Transfer                                                                                        Avon
                              Fluid Transfer                                                                                  CPS
                                 Systems                            Global Market Size: $6.8 billion                                Hutchinson
                                 Systems
                                 $0.5B / 14%                                                                                        Tristone
                                                                    CPS Current Share:     7%                        Market         Teklas
                                #3 Globally
                               #3  Globally                                                                                         ContiTech

                               Anti-Vibration
                               Anti-Vibration
                                 Systems                             Global Market Size: $10.0 billion                              ContiTech
                                 Systems                                                                                      CPS
                                  $0.3B / 9%                                                                                        Hutchinson/Paulstra
                                                                     CPS Current Share:    3%                                       TBVC
                      North American Leader                                                                         Market          Tokai/Sumitomo Riko

                    Market position data by Booz & Co. (2013) and Boston Consulting Group (2016)
                    Global Market Size based on IHS light vehicle production data and average content per vehicle
                    (1) includes non-consolidated JV
                    (2) excludes Fuel Rails, included in product line revenue of $0.7B                                                                    6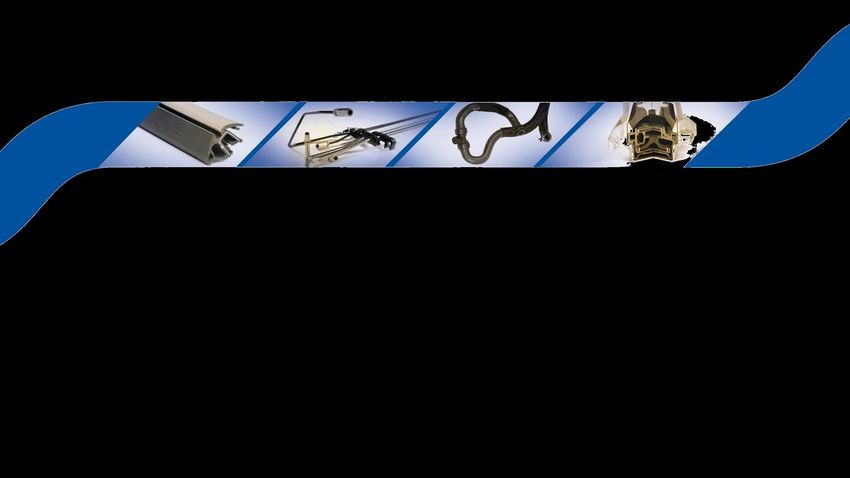
2   ACCELERATING GROWTH

     Accelerating Growth and Innovation
     Three Key Drivers (“MEGATRENDS”) Will Impact the Industry for the Next Ten Years

                                                 Emissions / Fuel                       Autonomous and
              Global Platforms                 Economy Legislation                     Connected Vehicles
                                                    Globally

         • Produced in two or more regions   • Requires weight reduction            • Creates need for quieter interiors
         • Common global architectures:      • Adherence to green materials &       • Will affect vehicle ownership
           fewer platforms, more variants      processes                              model and durability
                                                                                      requirements
         • Well positioned suppliers gain    • Introduces alternative powertrains
           market share                                                             • Technology is ready, policy is not
                                             • Public slow to adopt
         • Regional suppliers left behind

                                                                                                                           7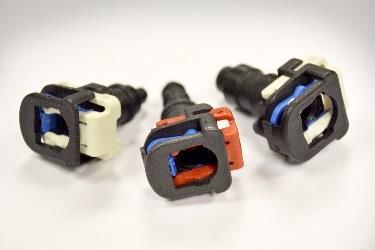
2   ACCELERATING GROWTH

     2016 Growth Highlights

                   +5.6%                                                   161                                                        $398m
            Revenue Growth excl. FX                                  New Product Launches                                   Net New Business1 Awards
           $3.47B in Sales was Company Record                           Majority on Global Platforms                              Majority on Global Platforms

                         1   Defined as annualized new sales awards net of replacement and runout business at currently forecasted vehicle production rates.
                                                                                                                                                                 8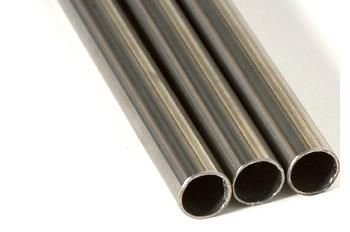
2   ACCELERATING GROWTH

     2017 Planned New Product/Plant Launches

                                                                      •   Planned launches up nearly 9% vs.
                          Q1       Q2       Q3       Q4       Total       2016
      North America            9    16       14           9     48    •   Majority of new launches are on global
                                                                          platforms
      Europe               14       22       20       20        76
                                                                      •   Includes both new and replacement
      Asia Pacific             6    15       14       14        49        business

      South America            0        0        3        0       3   •   Newly launched business, continued
                                                                          improvements in operating efficiency
      Total                29       53       51       43       176        and restructuring savings expected to
                                                                          drive higher margins in 2H 2017

                                                                                                                   9
3   ADVANTAGED GLOBAL FOOTPRINT

     Positioned to Win More Business on Global Platforms

            NORTH AMERICA                 SOUTH AMERICA                    EUROPE        ASIA PACIFIC
                  52%*                         2%*                            30%*             16%*
               34 Manufacturing              3 Manufacturing         24 Manufacturing    29 Manufacturing
                         8 R&D                1 Sales/Admin                    8 R&D     5 R&D
                  4 Sales/Admin                      4 Brazil           6 Sales/Admin    4 Admin/Sales
                       12 Other                                                6 Other   1 Other
            30 US, 11 CA, 9 MEX                                 17 Eastern, 17 Western   15 China, 11 India, 6 Korea,
                                                                                         2 Japan, 1 Thailand

              * % of 2016 Total Revenue

                                                                                                                        10
3 ADVANTAGED GLOBAL FOOTPRINT
Products Well Represented on Key Global Vehicles
Global Projected Fuel and Fluid Anti-
Vehicle Platform Units
1 Sealing
Brake Transfer Vibration
Ford F-150 1,024 • • • •
GM Cruze 1,942 • • •
GM Silverado 1,165 • • •
Ford Explorer 160 • • •
GM Malibu 852 • • •
Ford Edge 898 • • •
Ford Focus 2,028 • • •
Daimler C-Class 1,121 • •
Ford Fiesta 1,320 • • • •
FCA 1500 618 • •
(1) Average annual planned production for 2017 – 2021 in thousands. Source: IHS 113 ADVANTAGED GLOBAL FOOTPRINT
Supporting Global Customers
2016 Revenue
$3.47B RENAULT
VW
6%
FCA PSA
12% 7%
Daimler
GM 6%
20%
Renault
Nissan
3%
Tata
3%
Ford Other
30% BMW
9%
2%
Geely
2%
123 ADVANTAGED GLOBAL FOOTPRINT
Enhancing Revenue Diversification by Region
2004A 2016A
Asia Pacific
4%
South America
3% Asia Pacific
South America 16%
2%
North America
Europe 70% North America
23% 52%
Europe
30%
133 ADVANTAGED GLOBAL FOOTPRINT
Strategic Expansion in Asia
Accelerating Top-line Growth • Cooper Standard is currently #1 automotive
(USD millions) sealing supplier in China
~ $600
• Rapidly growing fuel and brake business and
$541
fluid transfer systems business
• New fuel and brake plant to open in 2017
$435
• Available capacity to support rapid growth in
$249 all product lines
$220
• Strong backlog of booked business
• New product/plant launches expected to drive
increasing revenue and margin in back half of
2017
144 INNOVATION / VALUE-ADD TECHNOLOGY
Providing Customer Solutions through Innovation
Driving Sustainable Competitive Advantage for Cooper Standard
Fortrex™ Sealing
Reduces weight, improves performance, and offers appearance options
ArmorHose™, ArmorHose™ II, and ArmorHose™ III
Eliminates requirement for protective sleeves on hoses
MagAlloy™ Coating
Improves corrosion performance and product life utilizing proprietary technology
Gen III Posi-Lock Quick Connector
Simplifies systems; reduces mass and complexity
154 INNOVATION / VALUE-ADD TECHNOLOGY
Fortrex™ Sealing Family
Fortrex™ is a next generation lightweight elastomer that reduces mass
and improves performance
Fortrex™ material technologies will change the
auto industry’s expectation involving weight,
functional performance and finish part
aesthetics for static weatherseal systems.
164 INNOVATION / VALUE-ADD TECHNOLOGY
ArmorHose™ Family
ArmorHose™ provides 100% abrasion coverage while reducing mass by 30%
ArmorHose™ technology eliminates the need for
abrasion sleeves by integrating the abrasion
resistance directly into the hose construction.
174 INNOVATION / VALUE-ADD TECHNOLOGY
Advancing Material Science and Innovation
1Q 2017 Update
• Obtained significant production contract for Fortrex™
static sealing system on major SUV platform
• Fortrex™ technology now validated static sealing
systems and being quoted broadly with OEMs
• Using artificial intelligence modeling to adapt and
expand technology into additional applications
• Supporting global customers through expansion of
technical / innovation centers
184 INNOVATION / VALUE-ADD TECHNOLOGY
Delivering Breakthrough Innovations to the Market
1Q 2017 Update
$61m $70m $415m
1Q Annual Booked Business1 Pending Open Quotes Additional Targeted Quotes
2 5 49
Fortrex™ Production Contracts Fortrex™ Development Additional Active Innovation
Contracts Projects
1 Commercialized innovation products include: MagAlloy™, ArmorHose™, ArmorHose™ TPV, Gen III Posi-Lock, TP Microdense, and Fortrex™
Includes new and replacement business. 195 WORLD-CLASS OPERATIONS INITIATIVE
Advancing Toward World-Class Operations
15
Facilities achieved
Diamond Plant status in 2016
• Safety
• Customer Score Card
• 6S
• Operating Improvement
• Product Quality
• Scrap rate
• Launch execution
205 WORLD-CLASS OPERATIONS INITIATIVE
Improving Performance Through BBP
BBP Metrics
• Identifies areas to decrease
conversion costs, increasing
efficiencies and improving
Opportunity for margins
Accelerated
Improvement
• Accelerates continuous
improvement with quantifiable
targets by cost category
CPS Benchmark
• Plants target 30% gap closure to
benchmark annually
Annual Plant Performance
215 WORLD-CLASS OPERATIONS INITIATIVE
Improving Performance Through BBP Over Time
BBP Metrics
• Overall plant improvement resets
benchmark, challenging on-going
improvement / consistency
Opportunity for
Accelerated • Speeds acquisition integration to
Improvement
realize synergies
• Focus innovation resources at
New CPS Benchmark
top performing plants
Annual Plant Performance
Annual Performance Improvement
Base Performance
22FINANCIAL OVERVIEW
23Financial Results
(USD millions, except per share amounts)
First Quarter
(2)
2017 2016
Sales $902.1 $862.5
Gross Profit $170.1 $159.8
% Margin 18.9% 18.5% + 40 Bps
Adjusted EBITDA1 $111.0 $103.5
% Margin 12.3% 12.0% + 30 Bps
Net Income $41.7 $31.3 + 33%
EPS (Fully diluted) $2.20 $1.67
1
Adjusted Net Income $55.9 $48.2
Adjusted EPS (Fully diluted) $2.95 $2.57 + 15%
CAPEX $58.3 $55.1
% of Sales 6.5% 6.4%
1 See Appendix for definitions and reconciliation to U.S. GAAP.
2 Certain amounts have been recast due to the adoption of ASU 2016-09. 24Consistent Margin Expansion
TTM Adjusted EBITDA Margin1
12.0% 12.1%
11.6% 11.7%
11.3%
10.8%
10.5%
9.9%
9.6% 9.7%
9.1%
3Q 4Q 1Q 2Q 3Q 4Q 1Q 2Q 3Q 4Q 1Q
2014 2015 2016 2017
1 See appendix for definitions and reconciliation to U.S. GAAP 25Strong Balance Sheet and Credit Profile
Gross Debt and Net Debt (USD millions) Liquidity Profile (USD millions)
Net Debt Cash Cash Revolver
$778 $762 $587
$313 $450 $180
$407
$137
$465 $407
$355 $313
1Q 2016 1Q 2017 1Q 2016 1Q 2017
Leverage Ratio (Gross Debt / TTM Adj. EBITDA1) Interest Coverage Ratio (TTM Adj. EBITDA1 / Interest)
2.0x 9.9x 9.9x
1.8x
1Q 2016 1Q 2017 1Q 2016 1Q 2017
1 See Appendix for definitions and reconciliation to GAAP.
Numbers are subject to rounding 26Priorities for Capital Allocation
Win and Launch New Business
Profitable Growth Organic growth
Innovation
Complete Europe Restructuring Defined program to enhance margins
Strategic M&A Plug-ins with immediate synergies
Stakeholders
Share Repurchase ~ $100 million remaining authorization
Return to
Pay Down Debt Balance sheet flexibility
27APPENDIX
28Non-GAAP Financial Measures
EBITDA, adjusted EBITDA, adjusted net income and adjusted earnings per share are measures not recognized under U.S. GAAP and which exclude
certain non-cash and special items that may obscure trends and operating performance not indicative of the Company's core financial activities.
Management considers EBITDA, adjusted EBITDA, adjusted net income and adjusted earnings per share to be key indicators of the Company's
operating performance and believes that these and similar measures are widely used by investors, securities analysts and other interested parties in
evaluating the Company's performance. In addition, similar measures are utilized in the calculation of the financial covenants and ratios contained in
the Company’s financing arrangements and management uses these measures for developing internal budgets and forecasting purposes. EBITDA is
defined as net income adjusted to reflect income tax expense (benefit), interest expense net of interest income, depreciation and amortization, and
adjusted EBITDA is defined as EBITDA further adjusted to reflect certain items that management does not consider to be reflective of the Company's
core operating performance. Adjusted net income is defined as net income adjusted to reflect certain items that management does not consider to be
reflective of the Company's core operating performance. Adjusted earnings per share is defined as adjusted net income divided by the weighted
average number of basic and diluted shares.
When analyzing the Company’s operating performance, investors should use EBITDA, adjusted EBITDA, adjusted net income and adjusted earnings
per share as supplements to, and not as alternatives for, net income, operating income, or any other performance measure derived in accordance with
U.S. GAAP, and not as an alternative to cash flow from operating activities as a measure of the Company’s liquidity. EBITDA, adjusted EBITDA,
adjusted net income and adjusted earnings per share have limitations as analytical tools and should not be considered in isolation or as substitutes for
analysis of the Company’s results of operations as reported under U.S. GAAP. Other companies may report EBITDA, adjusted EBITDA, adjusted net
income and adjusted earnings per share differently and therefore the Company's results may not be comparable to other similarly titled measures of
other companies. In addition, in evaluating adjusted EBITDA and adjusted net income, it should be noted that in the future the Company may incur
expenses similar to or in excess of the adjustments in the below presentation. This presentation of adjusted EBITDA and adjusted net income should
not be construed as an inference that the Company's future results will be unaffected by special items. Reconciliations of EBITDA, adjusted EBITDA,
and adjusted net income.
29EBITDA and Adjusted EBITDA Reconciliation
(USD thousands)
Three Months Ended March 31,
(1)
2017 2016
Net income attributable to Cooper-Standard Holdings Inc. $ 41,706 $ 31,323
Income tax expense 11,890 14,766
Interest expense, net of interest income 11,239 9,752
Depreciation and amortization 31,857 30,205
EBITDA $ 96,692 $ 86,046
Restructuring charges 9,988 10,832
Impairment charges (2) 4,270 —
(3)
Secondary offering underwriting fees and other expenses — 6,500
Other — 155
Adjusted EBITDA $ 110,950 $ 103,533
(1) Certain amounts have been recast due to the adoption of ASU 2016-09
(2) Impairment charges related to fixed assets.
(3) Fees and other expenses associated with the March 2016 secondary offering.
30Adjusted EBITDA Margin, Financial Ratios
Twelve Months Ended March 31, 2017 Twelve
Months
(USD thousands) Three Months Ended Ended
30-Jun-16 (1) 30-Sep-16 31-Dec-16 31-Mar-17 31-Mar-17
Net income attibutable to Cooper Standard Holdings Inc. $ 40,189 $ 36,362 $ 31,114 $ 41,706 $ 149,371
Income tax expense 16,021 12,525 11,009 11,890 51,445
Interest expense, net of interest income 9,995 10,114 11,528 11,239 42,876
Depreciation and amortization 30,169 31,325 30,961 31,857 124,312
EBITDA $ 96,374 $ 90,326 $ 84,612 $ 96,692 $ 368,004
Restructuring charges 12,206 10,430 12,563 9,988 45,187
Impairment charges (2) - - 1,273 4,270 5,543
(3)
Loss on refinancing and extinguishment of debt - - 5,104 - 5,104
Settlement charges (4) - - 281 - 281
Other - - - - -
Adjusted EBITDA $ 108,580 $ 100,756 $ 103,833 $ 110,950 $ 424,119
Net Debt
Debt payable within one year $33,470
Long-term debt 728,470
Less: cash and cash equivalents (406,925)
Net Debt $ 355,015
Net Leverage Ratio (Net debt/Adjusted EBITDA) 0.8
Interest coverage ratio (Adjusted EBITDA/Interest expense) 9.9
Sales $ 879,304 $ 855,656 $ 875,434 $ 902,051 $ 3,512,445
Adjusted EBITDA Margin (Adj. EBITDA/Sales ) 12.3% 11.8% 11.9% 12.3% 12.1%
(1) Certain amounts have been recast due to the adoption of ASU 2016-09
(2) Impairment charges related to fixed assets.
(3) Loss on refinancing and extinguishment of debt relating to the refinancing of our term loan facility.
(4) Settlement charges related to the initiative to de-risk the U.K pension plans.
31Adjusted Net Income and Adjusted EPS
(USD thousands except share and per share amounts)
Three Months Ended March. 31,
(1)
2017 2016
Net income attributable to Cooper-Standard Holdings Inc. $ 41,706 $ 31,323
Restructuring charges 9,988 10,832
Impairment charges (2) 4,270 —
(3)
Secondary offering underwriting fees and other expenses — 6,500
Other — 155
(4)
Tax impact of adjusting items (95) (658)
Adjusted net income $ 55,869 $ 48,152
Weighted average shares outstanding
Basic 17,742,994 17,442,364
Diluted 18,972,550 18,746,600
Earnings per share
Basic $ 2.35 $ 1.80
Diluted $ 2.20 $ 1.67
Adjusted earnings per share:
Basic $ 3.15 $ 2.76
Diluted $ 2.95 $ 2.57
(1) Certain amounts have been recast due to the adoption of ASU 2016-09.
(2) Impairment charges related to fixed assets.
(3) Fees and other expenses associated with the March 2016 secondary offering.
(4) Represents the elimination of the income tax impact of the above adjustments, by calculating the income tax impact of these adjusting items using the appropriate tax rate for the jurisdiction where the
charges were incurred.
32You can also read