Infection Prevention. For Life - 2021 HALF YEAR RESULTS - Nanosonics

Page created by Jessica Quinn
 
CONTINUE READING
Infection Prevention. For Life - 2021 HALF YEAR RESULTS - Nanosonics
Infection
Prevention.
For Life.
2021            HALF YEAR
                RESULTS

INVESTOR PRESENTATION
Michael Kavanagh – CEO and President
McGregor Grant – CFO and Company Secretary
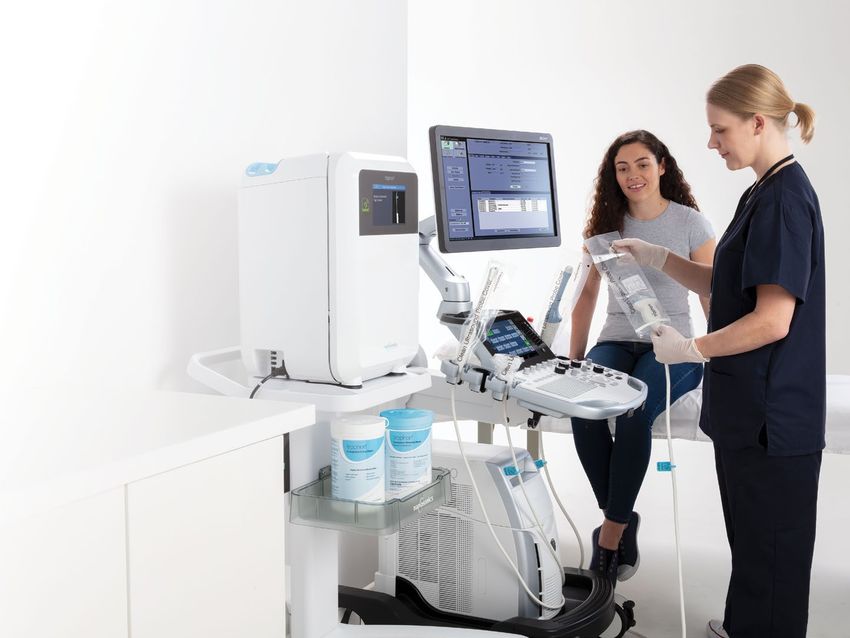
Infection Prevention. For Life - 2021 HALF YEAR RESULTS - Nanosonics
DISCLAIMER

This presentation is intended to provide a general outline only and is not intended to be a definitive statement on the subject matter covered in it. The information in
this presentation, whether written or verbal, has been prepared without taking into account the commercial, financial or other needs of any individual or organisation.
Certain information may relate to protected intellectual property rights owned by Nanosonics Limited (Nanosonics) and its subsidiaries (together the Group).
While due care has been taken in compiling the information based on the information available to Nanosonics at the date of this presentation material, neither
Nanosonics nor its officers or advisors or any other person warrants the accuracy, reliability, completeness or timeliness of the information or guarantees the
commercial or investment performance of the Group.
The information does not constitute advice of any kind and should not be relied on as such. Investors must make their own independent assessment of the
Group and undertake such additional enquiries as they deem necessary or appropriate for their own investment purposes. Any and all use of the information is at your
own risk.
No representation, warranty or assurance (express or implied) is given or made in relation to any forward looking statement or estimate by any person (including
Nanosonics). In particular, no representation, warranty or assurance (express or implied) is given in relation to any underlying assumption or that any forward
looking statement will be achieved. Actual future events may vary materially from the forward looking statements and the assumptions on which the forward looking
statements are based.
Subject to any continuing obligations under applicable law or any relevant listing rules of the Australian Securities Exchange, Nanosonics disclaims any obligation
or undertaking to disseminate any updates or revisions to any forward looking statements in these materials to reflect any change in expectations in relation to any
forward looking statements or any change in events, conditions or circumstances on which any such statement is based. Nothing in these materials shall under any
circumstances create an implication that there has been no change in the affairs of the Group since the date of these materials.

                                                                                                                                            Nanosonics Limited | Half Year 2021   1
Infection Prevention. For Life - 2021 HALF YEAR RESULTS - Nanosonics
“It is very          H1 FY21 Highlights

 encouraging to      • Global installed base up 12% in last 12 months and up 6% in last 6 months to 25,100 units.
                        Importantly, the number of new units installed in Q2 FY21 was up 38% compared with Q1 FY21.

 see a significant   • Half year revenue of $43.1 million, down 11% compared with prior corresponding period.
                        − The lower revenue was primarily driven by the foreshadowed reduction in purchases by GE Healthcare as a result
 recovery in the          of the impacts of COVID-19 on its inventory at 30 June 2020 as well as the impact of a stronger Australian dollar.
                        − Global revenue recovered strongly in Q2 FY21, up 48% compared with Q1 FY21. This growth resulted from
 underlying growth        stronger installed base growth across all regions, GE Healthcare resuming purchases of capital equipment in
                          Q2 FY21 as well as an increase in consumables and service revenue.

 momentum of the        − All revenue associated with I-MED’s upgrade of its 200+ trophon®EPR fleet, announced in November 2020,
                          is expected to be recognised in H2 FY21 as new trophon2 systems are installed across their network.

 business across     • Half year consumables and service revenue of $33.7 million, down 1% compared with prior
                        corresponding period.
 trophon adoption,      − Revenue from consumables and service in Q2 FY21 was up 29% compared with Q1 FY21. This growth
                          reflects the recovery in ultrasound procedure volumes experienced in the half leading to increased purchases

 consumables              by GE Healthcare, along with the growing installed base.
                        − Q2 FY21 consumables and service revenue in constant currency 1 terms represented the Company’s highest

 usage and overall        quarter on record.

                     • Half year capital revenue of $9.4 million, down 35% compared with prior corresponding period.

 growth, despite        − Capital revenue was impacted by the foreshadowed reduction in trophon unit sales to GE Healthcare as a
                          consequence of COVID-19. This impact was primarily experienced in Q1 FY21 with GE resuming purchases

 the continuing           of capital in Q2 F21.

                     • Continued investment in the Company’s growth strategy with first half operating expenses of $33.0

 impacts of             million, up 8% on prior corresponding period.

 COVID-19.”          • Operating profit before tax of $0.2 million, compared with $6.7 million in prior corresponding period.
                        This result reflects the impacts of COVID-19, particularly on Q1 revenue, and the ongoing investment in
                        the Company’s growth strategy.
 Michael Kavanagh,   • Free cash flow for the half year was a net outflow of $2.4 million compared with a net cash inflow of
 CEO and President      $10.0 million in the prior corresponding period due to the amount and timing of customer receipts and
                        the timing of supplier payments.
                     • Cash and cash equivalents of $87.9 million, providing ongoing strong foundation for continued
                        investment in growth. The Company has negligible debt.

                     1. Constant currency (CC) removes the impact of foreign exchange rate movements to facilitate comparability of operational performance. This is done
                        by converting the current period sales of entities that use currencies other than Australian dollars at the rates that were applicable in the prior period.
                        The average exchange rate used for the Company’s major foreign currency for the 6 months to Dec20/Dec19 was AUD/USD 0.72/0.68.

                                                                                                                                       Nanosonics Limited | Half Year 2021            2
Infection Prevention. For Life - 2021 HALF YEAR RESULTS - Nanosonics
C O M PA N Y O V E R V I E W

                                 ASX 200 listed healthcare company specialised in the development and                                                                                                                                                                                  KEY CORPORATE DATA 1
                                 commercialisation of infection prevention solutions
                                                                                                                                                                                                                                                                                       Share price                           $6.05
                                 • First product, trophon® – proprietary automated technology for low
                                      temperature, high level disinfection (HLD) of ultrasound probes                                                                                                                                                                                  Shares on issue                301.0 million
                                                                                                                                                                                                                                                                                       Market capitalisation         $1,821 million
                                 • Approved for sale in most major markets including: US/Canada, ANZ,
                                      UK, Europe, Singapore, HK, South Korea, Japan                                                                                                                                                                                                    Liquidity (30 day avg.) 0.8 million shares
                                                                                                                                                                                                                                                                                       Cash (31 Dec 20)               $87.9 million
                                 • 323 staff across Australia, US, Canada, UK, Ireland, Germany,
                                      France, Norway, Sweden and Japan                                                                                                                                                                                                                 Share Register              Founders 14.2%

Our Mission                      • Sold direct and through distribution partners, including leading brands
                                      such as: GE Healthcare, Philips, Samsung, Siemens and Canon
                                                                                                                                                                                                                                                                                       Breakdown
                                                                                                                                                                                                                                                                                       (31 Dec 20)
                                                                                                                                                                                                                                                                                                                 Institutions 58.7%
                                                                                                                                                                                                                                                                                                                      Private 27.1%

                                 • Active R&D program targeting expansion of product portfolio for
We improve the safety of              Infection Prevention market
patients, clinics, their staff   SHAREHOLDER RETURN 1                                                                                                                                                                                                                                  FINANCIAL OVERVIEW
and the environment by           Market Capitalisation ($ million)                                                                                                                                                                                Share Price                          SALES REVENUE ($M)
                                                                                                                                                                                                                                                                                                                     100.0
transforming the way infection   $3,000                                                                                                                                                                                                                                           9
                                                                                                                                                                                                                                                                                                          84.3
                                                                                                                                                                                                                                                                                        67.5                         51.6
prevention practices are                                                                                                                                                                                                                                                          8     31.4
                                                                                                                                                                                                                                                                                                60.7
                                                                                                                                                                                                                                                                                                          43.6
                                                                                                                                                                                                                                                                                                                              43.1
                                                                                                                                                                                                                                                                                                30.7
understood and conducted         $2,500
                                                                                                                                                                                                                                                                                        36.1              40.7       48.5     43.1
                                                                                                                                                                                                                                                                                                30.0
and introducing innovative                                                                                                                                                                                                                                                        7
                                                                                                                                                                                                                                                                                        2017    2018      2019       2020    H1 2021

technologies that deliver        $2,000                                                                                                                                                                                                                                           6    PBT ($M)
                                                                                                                                                                                                                                                                                                          16.8

improved standards of care.                                                                                                                                                                                                                                                       5
                                                                                                                                                                                                                                                                                        13.9
                                                                                                                                                                                                                                                                                                                     12.4
                                 $1,500
                                                                                                                                                                                                                                                                                  4              5.6

                                 $1,000                                                                                                                                                                                                                                           3                                            0.2
                                                                                                                                                                                                                                                                                        2017    2018      2019       2020    H1 2021
                                                                                                                                                                                                                                                                                  2    CASH ($M)
                                 $500                                                                                                                                                                                                                                                                                91.8     87.9
                                                                                                                                                                                                                                                                                  1             69.4      72.2
                                                                                                                                                                                                                                                                                        63.0

                                 $0                                                                                                                                                                                                                                               0
                                        Jun 08
                                                 Dec 08
                                                          Jun 09
                                                                   Dec 09
                                                                            Jun 10
                                                                                     Dec 10
                                                                                              Jun 11
                                                                                                       Dec 11
                                                                                                                Jun 12
                                                                                                                         Dec 12
                                                                                                                                  Jun 13
                                                                                                                                           Dec 13
                                                                                                                                                    Jun 14
                                                                                                                                                             Dec 14
                                                                                                                                                                      Jun 15
                                                                                                                                                                               Dec 15
                                                                                                                                                                                        Jun 16
                                                                                                                                                                                                 Dec 16
                                                                                                                                                                                                          Jun 17
                                                                                                                                                                                                                   Dec 17
                                                                                                                                                                                                                            Jun 18
                                                                                                                                                                                                                                     Dec 18
                                                                                                                                                                                                                                              Jun 19
                                                                                                                                                                                                                                                       Dec 19
                                                                                                                                                                                                                                                                Jun 20
                                                                                                                                                                                                                                                                         Dec 20
                                      Market Capitalisation ('000)                                                                   Closing share price                                                                                                                                2017    2018      2019       2020    H1 2021

                                 1. As at 23 February 2021.

                                                                                                                                                                                                                                                                                      Nanosonics Limited | Half Year 2021            3
Infection Prevention. For Life - 2021 HALF YEAR RESULTS - Nanosonics
I N S TA L L E D B A S E
                                                               GLOBAL

Global installed
                                                       CUMULATIVE INSTALLED BASE UNITS

                                                                                                   25,100

base grew 12%
                                                                                          23,720
                                                                                20,930

in last 12 months                                                   17,740

and 6% in last                                         14,160
                                                                                                                     In last
                                                                                                                     12 months
                                                                                                                                         In the last
                                                                                                                                         6 months

6 months to                                                                                                         12 %                 6%
25,100 units
                                                        2017            2018    2019      2020     H1 2021

                                                               GLOBAL

The Company experienced                                NEW INSTALLED BASE UNITS BY QUARTER (Q3 FY20–Q2 FY21)

a return in the underlying                                                                800
growth momentum of                                      730
the installed base with
the number of new units                                                         580
installed in Q2 FY21                                                     490

up 38%                                                                                             Q1 FY21
                                                                                                   vs Q4 FY20
                                                                                                                         Q2 FY21
                                                                                                                         vs Q1 FY21
compared with Q1 FY21.
                                                                                                   18 %                  38 %

Graphs are not to scale and therefore not comparable   Q3 FY20      Q4 FY20    Q1 FY21   Q2 FY21

                                                                                                                Nanosonics Limited | Half Year 2021    4
Infection Prevention. For Life - 2021 HALF YEAR RESULTS - Nanosonics
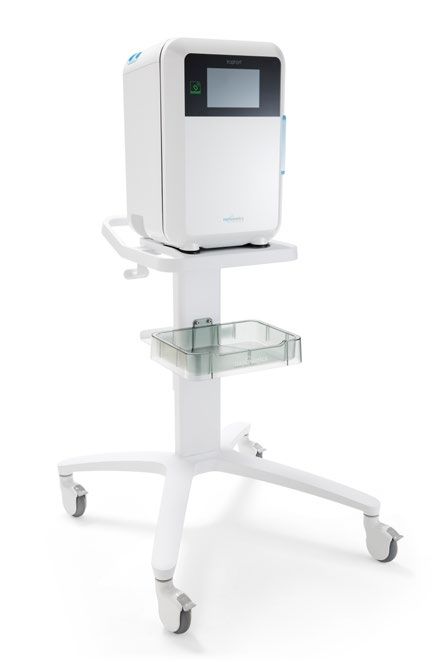
I N S TA L L E D B A S E B Y R E G I O N

                                              CUMULATIVE INSTALLED BASE                                        NEW UNITS INSTALLED
                                                       UNITS                                               BY QUARTER (Q3 FY20–Q2 FY21)

         NORTH
         AMERICA

                                                                                   In last     In last                                                 Q1 FY21        Q2 FY21
                                                                20,990   22,120    12 months   6 months     650                             650        vs Q4 FY20     vs Q1 FY21
                                                       18,570
                                           15,620
                                                                                   11%         5%                     410
                                                                                                                                480
                                                                                                                                                       17 %           35 %
                                            2018       2019     2020     H1 2021                          Q3 FY20   Q4 FY20   Q1 FY21     Q2 FY21

         EUROPE AND
         MIDDLE EAST

                                                                                   In last     In last                                                 Q1 FY21        Q2 FY21
                                                                          1,320    12 months   6 months                                     120        vs Q4 FY20     vs Q1 FY21
                                                                1,120
                                             730
                                                        880
                                                                                   31%         18 %         60        50
                                                                                                                                80
                                                                                                                                                       60 %           50 %
                                            2018       2019     2020     H1 2021                          Q3 FY20   Q4 FY20   Q1 FY21     Q2 FY21

         ASIA
         PACIFIC

                                                                                   In last     In last                                                 Q1 FY21        Q2 FY21
                                                                1,610     1,660    12 months   6 months               30                    30         vs Q4 FY20     vs Q1 FY21
                                            1,390      1,480
                                                                                   6%          3%           20                  20
                                                                                                                                                       33 %           50 %
                                            2018       2019     2020     H1 2021                          Q3 FY20   Q4 FY20   Q1 FY21     Q2 FY21

Graphs are not to scale and therefore not comparable

                                                                                                                                        Nanosonics Limited | Half Year 2021   5
Infection Prevention. For Life - 2021 HALF YEAR RESULTS - Nanosonics
R A N G E O F S E L L I N G M O D E LS                                                     1

   DIRECT CHANNEL                                                                                                                                                                           DISTRIBUTION CHANNEL

                                                                             MANAGED                                                                                                        FULL SERVICE
   CAPITAL SALE                                                              EQUIPMENT SERVICE                                    RENTAL                                                    DISTRIBUTION                                     CAPITAL RESELLER
   • Capital equipment                                                       • Nanosonics provides capital                        • Customer rents capital                                  • Distributor purchases capital                  • Distributor purchases capital
                             sold upfront with                                  equipment to customer.                               equipment.                                               equipment, consumables and                       equipment from Nanosonics
                             12-month warranty.                                                                                                                                               spare parts from Nanosonics.                     and sells to end customer.
                                                                             • Equipment fully maintained by                      • Equipment fully maintained
   • Customer purchases                                                         Nanosonics.                                          by Nanosonics.                                         • Distributor sells capital                      • Customer purchases
                             consumables as required.                                                                                                                                         equipment, consumables                           consumables and service
                                                                             • Customer purchases                                 • Customer purchases                                        and service to customer on                       from Nanosonics.
   • Customer elects to purchase                                                consumables as required at                           consumables as required.                                 a similar basis to the Direct
                             service contracts from                             an ‘all-inclusive’ price.                                                                                     Channel Capital Sale Model.
                             Nanosonics (usually after
                             warranty period expires) or                     • Nanosonics owns capital
                             pays for service and parts,                        equipment, depreciated over
                             as required.                                       5 years.
NANOSONICS REVENUE PROFILE

                               0 yrs                                 5 yrs          0 yrs                                 5 yrs         0 yrs                                  5 yrs          0 yrs                                 5 yrs     0 yrs                       5 yrs

                              1. The information in the revenue profile charts is intended to be illustrative only, demonstrating the cumulative revenue associated with a single unit sale over five years under each selling model.

                                                                                                                                                                        Capital                                        Consumables                               Service/parts

                                                                                                                                                                                                                                    Nanosonics Limited | Half Year 2021        6
Infection Prevention. For Life - 2021 HALF YEAR RESULTS - Nanosonics
FINANCIAL
RESULTS REVIEW
T O TA L R E V E N U E

Total revenue down
                                                       TOTAL REVENUE BY HALF ($M)

11% vs PCP to
                                                        48.5

                                                                  43.1

$4 3 .1 m                                                                     H1 FY21
                                                                              vs PCP
The lower revenue was primarily
driven by the foreshadowed                                                   11 %
reduction in purchases by
GE Healthcare as a result of the
impacts of COVID-19 on its inventory
at 30 June 2020 as well as the                         H1 FY20   H1 FY21
impact of a stronger Australian dollar.

                                                       TOTAL REVENUE BY QUARTER (Q3 FY20–Q2 FY21) ($M)

                                                        26.3                             25.7
                                                                   25.3
Global revenue recovered strongly
in Q2 FY21, up 48% compared
with Q1 FY21. This growth resulting
                                                                            17.4
from stronger installed base growth
across all regions, GE Healthcare                                                                 Q1 FY21            Q2 FY21
                                                                                                  vs Q4 FY20         vs Q1 FY21
resuming purchases of capital
equipment in Q2 FY21 as well as
an increase in consumables and
                                                                                                  31 % 48 %
service revenue.

                                                       Q3 FY20   Q4 FY20   Q1 FY21      Q2 FY21
Graphs are not to scale and therefore not comparable

                                                                                                     Nanosonics Limited | Half Year 2021   8
T O TA L R E V E N U E B Y R E G I O N

                                                                   TOTAL REVENUE                    TOTAL REVENUE BY QUARTER
                                                                    BY HALF ($M)                       (Q3 FY20–Q2 FY21) ($M)

        NORTH
        AMERICA
The impact in revenue was primarily associated with the
foreshadowed significant reduction in capital equipment
purchases and a reduction in purchases of consumables in
Q1 FY21 by GE Healthcare in response to increased inventory                            H1 FY21                                                Q1 FY21         Q2 FY21
                                                                    43.8               vs PCP     23.3      23.2                   22.4       vs Q4 FY20      vs Q1 FY21
holdings at the end of Q4 FY20. Importantly, GE Healthcare                    36.9
resumed purchasing capital equipment in Q2 FY21 and
increased purchases of consumables as a result of the recovery
                                                                                       16 %                           14.5                    38 %           54 %
in ultrasound procedures across the half coupled with increasing
sales by Nanosonics direct operations. This resulted in total      H1 FY20   H1 FY21             Q3 FY20   Q4 FY20   Q1 FY21     Q2 FY21
revenue growing 54% between Q1 FY21 and Q2 FY21.

        EUROPE AND
        MIDDLE EAST
Total revenue for the half was $3.6 million, up 50% compared
with prior corresponding period. Revenue growth momentum
was also experienced between the first and second quarter
with Q2 FY21 revenue up 25% compared with Q1 FY21.                                     H1 FY21                                                Q1 FY21         Q2 FY21
                                                                               3.6     vs PCP                                       2.0       vs Q4 FY20      vs Q1 FY21
                                                                                                   1.6                 1.6
                                                                     2.4
                                                                                       50 %                  1.2                              33 %           25 %
                                                                   H1 FY20   H1 FY21             Q3 FY20   Q4 FY20   Q1 FY21     Q2 FY21

        ASIA
        PACIFIC
In Asia Pacific, total revenue for the half was $2.6 million, up
8% compared with prior corresponding period.

                                                                                       H1 FY21                                                Q1 FY21         Q2 FY21
                                                                     2.4       2.6     vs PCP      1.4                 1.3          1.3       vs Q4 FY20      vs Q1 FY21
                                                                                       8%                    0.9
                                                                                                                                              44 %           0%
                                                                   H1 FY20   H1 FY21             Q3 FY20   Q4 FY20   Q1 FY21     Q2 FY21

Graphs are not to scale and therefore not comparable
Quarterly revenue data is based on management accounts

                                                                                                                               Nanosonics Limited | Half Year 2021    9
C A P I TA L R E V E N U E

Capital Revenue
                                                       CAPITAL REVENUE BY HALF ($M)

down 35% vs PCP to
                                                        14.4

$ 9 .4 m                                                           9.4

                                                                              H1 FY21
                                                                              vs PCP

                                                                             35 %

                                                       H1 FY20   H1 FY21

Impact was primarily felt in the first                 CAPITAL REVENUE BY QUARTER (Q3 FY20–Q2 FY21) ($M)

quarter where no capital units were
                                                         8.2
sold to GE Healthcare resulting in a                               7.4
reduction in capital revenue of 64%                                                       6.7
between Q4 FY20 and Q1 FY21.
As GE Healthcare resumed capital
                                                                                                  Q1 FY21            Q2 FY21
purchases in the second quarter,                                                                  vs Q4 FY20         vs Q1 FY21
coupled with increasing capital
sales by Nanosonics’ direct                                                  2.7                  64 % 148 %
operations and other distributor
partners, capital revenue grew by
148% compared with Q1.
                                                       Q3 FY20   Q4 FY20   Q1 FY21      Q2 FY21
Graphs are not to scale and therefore not comparable

                                                                                                     Nanosonics Limited | Half Year 2021   10
C A P I TA L R E V E N U E B Y R E G I O N

                                                  CAPITAL REVENUE               CAPITAL REVENUE BY QUARTER
                                                    BY HALF ($M)                    (Q3 FY20–Q2 FY21) ($M)

        NORTH
        AMERICA

                                                                     H1 FY21                                                  Q1 FY21         Q2 FY21
                                                    13.5             vs PCP      7.3       6.8                                vs Q4 FY20      vs Q1 FY21
                                                             7.2     47 %                                      5.4
                                                                                                                              74 %           200 %
                                                                                                     1.8

                                                 H1 FY20   H1 FY21             Q3 FY20   Q4 FY20   Q1 FY21   Q2 FY21

        EUROPE AND
        MIDDLE EAST

                                                                     H1 FY21                                                  Q1 FY21         Q2 FY21
                                                             1.5     vs PCP                                    0.9            vs Q4 FY20      vs Q1 FY21

                                                    0.5
                                                                     200 %       0.5
                                                                                           0.4
                                                                                                     0.6
                                                                                                                              50 %           50 %
                                                 H1 FY20   H1 FY21             Q3 FY20   Q4 FY20   Q1 FY21   Q2 FY21

        ASIA
        PACIFIC

                                                                     H1 FY21                                                  Q1 FY21         Q2 FY21
                                                             0.7     vs PCP      0.4                           0.4            vs Q4 FY20      vs Q1 FY21
                                                    0.4              75 %                  0.2
                                                                                                     0.3
                                                                                                                              50 %           33 %
                                                 H1 FY20   H1 FY21             Q3 FY20   Q4 FY20   Q1 FY21   Q2 FY21

Graphs are not to scale and therefore not comparable
Quarterly revenue data is based on management accounts

                                                                                                                       Nanosonics Limited | Half Year 2021   11
CONSUMABLE / SERVICE REVENUE

Consumables/
                                                       CONSUMABLES/ SERVICE REVENUE BY HALF ($M)

Service Revenue
                                                        34.1      33.7

down 1% vs PCP to
$ 3 3 .7m                                                                     H1 FY21
                                                                              vs PCP

                                                                             1%
Revenue from consumables and
service in Q1 FY21 was impacted
by a reduction in ultrasound
procedure volumes in Q4 of FY20.
                                                       H1 FY20   H1 FY21
This led to a reduction in purchases
by GE Healthcare in Q1 FY21.
                                                       CONSUMABLES/ SERVICE REVENUE BY QUARTER (Q3 FY20–Q2 FY21) ($M)

                                                                                         19.0
                                                        18.1       17.9
Importantly, total consumables
and service revenue in Q2 FY21                                              14.7

was up 29% compared with Q1
FY21. This growth reflects the                                                                     Q1 FY21            Q2 FY21
recovery in ultrasound procedure                                                                   vs Q4 FY20         vs Q1 FY21
volumes experienced in the half
leading to increased purchases                                                                     18 % 29 %
by GE Healthcare, along with the
growing installed base.

                                                       Q3 FY20   Q4 FY20   Q1 FY21      Q2 FY21
Graphs are not to scale and therefore not comparable

                                                                                                      Nanosonics Limited | Half Year 2021   12
CONSUMABLES/SERVICE REVENUE BY REGION

                                                   CONSUMABLES/SERVICE          CONSUMABLES/SERVICE REVENUE
                                                    REVENUE BY HALF ($M)       BY QUARTER (Q3 FY20–Q2 FY21) ($M)

        NORTH
        AMERICA

                                                                     H1 FY21                                                  Q1 FY21        Q2 FY21
                                                    30.3    29.7     vs PCP     16.0      16.4                17.0            vs Q4 FY20     vs Q1 FY21
                                                                     2%                             12.7
                                                                                                                              23 %           34 %
                                                 H1 FY20   H1 FY21             Q3 FY20   Q4 FY20   Q1 FY21   Q2 FY21

        EUROPE AND
        MIDDLE EAST

                                                                     H1 FY21                                                  Q1 FY21        Q2 FY21
                                                             2.1     vs PCP      1.1                 1.0       1.1            vs Q4 FY20     vs Q1 FY21
                                                    1.9
                                                                     11 %                  0.8
                                                                                                                              25 %           10 %
                                                 H1 FY20   H1 FY21             Q3 FY20   Q4 FY20   Q1 FY21   Q2 FY21

        ASIA
        PACIFIC

                                                                     H1 FY21                                                  Q1 FY21        Q2 FY21
                                                    1.9      1.9     vs PCP      1.0                 1.0                      vs Q4 FY20     vs Q1 FY21
                                                                                                               0.9
                                                                     0%                    0.7
                                                                                                                              43 %           10 %
                                                 H1 FY20   H1 FY21             Q3 FY20   Q4 FY20   Q1 FY21   Q2 FY21

Graphs are not to scale and therefore not comparable
Quarterly revenue data is based on management accounts

                                                                                                                       Nanosonics Limited | Half Year 2021   13
O P E R AT I N G E X P E N S E S

$ 33.0 m
                                                       OPERATING EXPENSES
                                                       ($M)                        63.2

                                                                            49.2
   Continued investment in the
                                                                    42.6           32.5
   Company’s growth strategy with
                                                       37.0
   first half operating expenses of                                         27.7
   $33.0 million, up 8% on prior                                    23.3
   corresponding period and up                         19.9
   2% compared with H2 FY20.
                                                                                   30.7          33.0
                                                                    19.3    21.5
                                                       17.1

                                                       2017        2018     2019   2020        H1 2021

P R O F I T B E F O R E TA X                           PROFIT BEFORE TAX
                                                       ($M)
                                                                            16.8

$ 0. 2 m                                               13.9
                                                                                   12.4

   Operating profit before tax
   was $0.2 million compared to
   $6.7 million in prior corresponding
   period. This reflects the impacts                                5.6
   of COVID-19, in particular on
   Q1 revenue, the ongoing investment
   in the Company’s growth strategy                                                               0.2
   and a stronger Australian dollar.
                                                       2017        2018     2019   2020        H1 2021

Graphs are not to scale and therefore not comparable

                                                                                          Nanosonics Limited | Half Year 2021   14
FREE CASH FLOW

( $ 2.4 m )
                                                       FREE FLOW CASH
                                                       ($M)                           20.9

Free cash flow for the half year                       15.1
was a net outflow of $2.4 million
compared with a net cash inflow of
$10.0 million in prior corresponding
period due to the amount and
                                                                   6.2
timing of customer receipts and the
timing of supplier payments.                                                   2.6

                                                                                                   (2.4)

                                                       2017        2018       2019    2020       H1 2021

C A S H A N D C A S H E Q U I VA L E N T S             CASH AND CASH EQUIVALENTS
                                                       ($M)

$ 87. 9 m
                                                                                      91.8
                                                                                                   87.9

                                                                               72.2
                                                                   69.4
                                                       63.0
as at 31 December 2020
Cash and cash equivalents of
$87.9 million, providing ongoing
strong foundation for continued
investment in growth. The
Company has negligible debt.

                                                       2017        2018       2019    2020       H1 2021

Graphs are not to scale and therefore not comparable

                                                                                             Nanosonics Limited | Half Year 2021   15
PROFIT AND LOSS SUMMARY

                                                                                              HIGHLIGHTS

                                     FY21     FY20      CHANGE%       FY20      CHANGE%       • Half year revenue of $43.1 million down 11%
$ Million                              H1       H1     (vs H1 FY20)     H2     (vs H2 FY20)      (down 8% in constant currency 1) compared
                                                                                                 with prior corresponding period.
Capital revenue                        9.4    14.4           (35%)    15.6           (40%)
                                                                                              • Gross profit of $34.2 million, or 79% of revenue.
Consumables/Service revenue          33.7     34.1            (1%)    36.0            (6%)
                                                                                              • Selling, general and administration expenses
Total revenue                        43.1     48.5           (11%)    51.6           (16%)       of $25.4 million compared with $23.9 million
                                                                                                 in prior corresponding period.
Gross profit                         34.2     36.4            (6%)    39.1           (13%)
                                                                                              • Research and development expenses of
%                                    79%      75%                     76%                        $7.6 million, the majority associated with
                                                                                                 new products.
Operating expenses
                                                                                              • Other losses comprised mainly of net foreign
    Selling and general              (17.8)   (17.7)           1%     (17.0)           5%        currency losses.

    Admin                             (7.6)    (6.2)          23%      (6.7)          13%     • Income tax benefit of $1.3 million compared
                                                                                                 with expense of $1.0 million in the prior year.
    Research and development          (7.6)    (6.8)          12%      (8.8)         (14%)
Other income                           0.0      0.0             —       0.0             —
Other (losses)/gains-net              (1.2)     0.6         (300%)     (1.3)          (8%)

Earnings before interest and tax       0.0      6.3         (100%)      5.3         (100%)

Finance income (net)                   0.2      0.4          (50%)      0.4          (50%)

Operating income before income tax     0.2      6.7          (97%)      5.7          (96%)

Income tax benefit/(expense)           1.3     (1.0)        (230%)     (1.3)        (200%)

Profit after income tax                1.5      5.7          (74%)      4.4          (66%)

                                                                                              1. Constant currency removes the impact of foreign exchange rate
                                                                                                 movements to facilitate comparability of operational performance. This is
                                                                                                 done by converting the current year sales of entities that use currencies
                                                                                                 other than Australian dollars at the rates that were applicable in the prior
                                                                                                 year. The average exchange rate used for the Company’s major foreign
                                                                                                 currency for the 6 months to Dec20/Dec19 was AUD/USD 0.72/0.68.

                                                                                                                  Nanosonics Limited | Half Year 2021                           16
SIGNIFICANT GLOBAL MARKET OPPORTUNITY

Installed base opportunity                    Market Penetration                              Cumulative Installed Base                                       25,100
                                                                                                                                              23,720
                                                                                                                              20,930
         GLOBAL                                                                                               17,740
                                                                                             14,160
                                                                                                                                                                                • Increasing number of international guidelines requiring

120 , 000
                                                                                                                                                                                  high level disinfection (HLD) supporting growing
                                                                                                                                                                                  international demand.
                                                                           21%
units                                                                                                                                                                           • Nanosonics expanding its footprint geographically
                                                                                                                                                                                  both direct and through distributors.
                                                                                               2017            2018             2019            2020          H1 2021

Installed base opportunity                    Market Penetration                              Cumulative Installed Base                        20,990           22,120
                                                                                                                                                                                • Fundamentals for adoption strong with requirements
                                                                                                                               18,570                                             for HLD in place.
         NORTH AMERICA                                                                                        15,620
                                                                                             12,400                                                                             • trophon installed base over 22,120 and already in

40 , 000
units
                                                                           55%
                                                                                                                                                                                  over 5,000 hospitals and clinics, including majority
                                                                                                                                                                                  of luminary hospitals.
                                                                                                                                                                                • Nanosonics has a direct sales operation of 74 people
                                                                                                                                                                                  as well as partnerships with all leading ultrasound
                                                                                               2017             2018            2019             2020          H1 2021            companies to drive ongoing adoption.

Installed base opportunity                    Market Penetration                              Cumulative Installed Base                                         1,320
                                                                                                                                                1,120
         EUROPE AND                                                                                                                                                             • Expanded geographical reach, strengthening fundamentals
         MIDDLE EAST                                                                                                            880                                               for adoption and growing awareness.
                                                                                                                730

40 , 000
units
                                                                           3%
                                                                                               490
                                                                                                                                                                                • Expanded infrastructure covering sales, marketing,
                                                                                                                                                                                  clinical, regulatory and operations.
                                                                                                                                                                                • A range of business models in place to support
                                                                                                                                                                                  market requirements.
                                                                                               2017            2018             2019            2020           H1 2021

Installed base opportunity                    Market Penetration                              Cumulative Installed Base                         1,610            1,660
                                                                                                         1,390
                                                                                                                     1,480                                                      • Sales mainly in ANZ where market penetration is >75%.
                                                                                              1,270
         ASIA PACIFIC                                                                                                                                                           • Japan market development strategy continues with
                                                                                                                                                                                  five distribution agreements in place.

40 , 000
units
                                                                           4%
                                                                                                                                                                                • Continued development of China market entry strategy.
                                                                                                                                                                                • Assessment underway for further expansion across
                                                                                                                                                                                  Asia Pacific with regulatory approvals now in Thailand
                                                                                               2017             2018            2019             2020          H1 2021
                                                                                                                                                                                  and Indonesia with Malaysia underway.

1.             Current installed base.     Remaining potential opportunity. Graphs are not to scale and therefore not comparable.
2. Internal estimate based on historical regional estimates of the installed base of ultrasound consoles and those associated with procedures where high level disinfection may be required.

                                                                                                                                                                                                 Nanosonics Limited | Half Year 2021        17
E X PA N D I N G G L O B A L P R E S E N C E

Nanosonics distributes its products in 27 countries, either through direct operations or via distributor partners.

                                                                                                             RUSSIA

                                                                     SWEDEN
                                                                                       FINLAND
                                                                NORWAY

                                                                DENMARK         ESTONIA
                                               UNITED KINGDOM
            CANADA                                                          GERMANY
                                                    IRELAND                   AUSTRIA
                                                         BELGIUM           SWITZERLAND
                                                        FRANCE
                                                                                  ROMANIA
        UNITED STATES                                                                                                       JAPAN
                                                    PORTUGAL       SPAIN
                                                                                        LEBANON
                                                                              ISRAEL
                                                                                            KUWAIT

                        MEXICO                                                                              HONG KONG

                                                                                                        SINGAPORE

                                                                                                     AUSTRALIA

                                                                                                                               NEW ZEALAND

                                                                                                      Nanosonics Limited | Half Year 2021    18
NEW PRODUCT
DEVELOPMENT
NEW PRODUCT DEVELOPMENT

Nanosonics continues      FIVE CORE AREAS OF FOCUS

to invest in a number
of innovations aimed
                           COMPLIANCE AND                                                                 INSTRUMENT
at addressing a                 TRACEABILITY                                                              CLEANING

broader range of             Digitally-enabled tools
                           to increase visibility and
                                                                                                          Mandatory critical first
                                                                                                          step which sets up
                                                                     Infection
infection prevention       control around infection
                                      risk mitigation.              Prevention.
                                                                                                          the effectiveness of all
                                                                                                          downstream disinfection
requirements.                                                        For Life.                            procedures.

                             ENVIRONMENTAL                                                                INSTRUMENT
                           DECONTAMINATION                                                                DISINFECTION
                           Novel technologies and                                                         High level and low
                             chemistries to reduce                                                        level disinfection and
                              cross-contamination                                                         sterilisation for medical
In addition, ongoing              risk coming from              STORAGE SOLUTIONS                         devices before re‑use
                                                                                                          with a patient.
                             high contact surfaces              Assurance that reprocessed
investigations into              and environment.               devices are not subsequently

potential strategic                                             contaminated and are always
                                                                   available for next use.
acquisitions and/
or product licensing
or collaboration              Active programs are in place covering a number
opportunities continue                  of the areas outlined above.
through the newly
established business
development function.
                                        All research and new product development programs involve inherent risks
                                              and uncertainties which can impact commercialisation timelines.

                                                                                              Nanosonics Limited | Half Year 2021     20
NEW PRODUCT DEVELOPMENT

In the first half         The R&D team continued to make
$7.6 million was          significant progress across a number
invested in R&D,          of projects including a new platform
up 12% on prior           technology and a solution for further
corresponding             digital traceability and reporting.
period.
                          INVESTMENT IN R&D
                          ($M)
                                                      15.6

                                               11.4
                                                      8.8
                                         9.9
                           9.5

                                               5.9

                                         5.3
                           5.2

                                                                          7.6
                                                      6.8
                                               5.5
                           4.3           4.6

                          2017          2018   2019   2020             H1 2021

                                                        Nanosonics Limited | Half Year 2021   21
O U R S T R AT E G I C P R I O R I T I E S

         TROPHON AS                          EXPAND GEOGRAPHIC           PRODUCT EXPANSION                  INVEST TO GROW
      STANDARD OF CARE                           FOOTPRINT

     • Support establishment of              • Expand operations         • Expand portfolio of            • Maintain strong financial
        international guidelines.              across Asia Pacific and     infection prevention             position to support
                                               EMEA with trophon plus      solutions to address             growth.
     • Provide awareness                       new products.               unmet needs.
        and education to                                                                                  • Deliver operational
        highlight risks of cross                                         • Leverage technology              efficiencies, scale and
        contamination for all semi                                         platforms for potential          leverage.
        critical transducers.                                              expanded indications.
     • Ensure customers have a
        positive experience with
        all aspects of the product
        and brand.

                                                                                                     Nanosonics Limited | Half Year 2021   22
BUSINESS OUTLOOK

“The positive growth       FY21 EXPECTATIONS
 trend and improving       •   Based on current market improvements the Company is anticipating ongoing growth
                               in total revenue and profitability into the second half, driven by increasing installed
 market conditions             base growth and increased usage of consumables across all regions. With COVID-19
 experienced across            vaccination programs underway, the Company is optimistic that overall market
                               conditions, in particular access to hospitals, are likely to continue to improve.
 the half are expected     •   The underlying fundamentals for the business remain strong and we maintain our
 to continue, subject of       commitment to continue to invest in the strategic growth priorities of the business
                               through market expansion, R&D and infrastructure and capability growth. Total
 course to the inherent        operating expenses for the year are now expected to be at the lower end of the
 risks and uncertainties       $75 million to $78 million range indicated previously.

 associated with the
 COVID-19 pandemic”
 Michael Kavanagh,
 CEO and President

                                                                                        Nanosonics Limited | Half Year 2021   23
BUSINESS OUTLOOK

Despite the current              BEYOND FY21
challenges of the                Our forward looking growth agenda remains very much intact and indeed the COVID-19
                                 pandemic increases our resolve to execute on this agenda. Beyond FY21, Nanosonics
COVID-19 pandemic                is targeting:
our longer term strategic        •   Continued growth in the trophon eco system and installed base across all regions;
growth agenda remains            •   Growth in upgrades of trophon EPR to trophon2;
very much intact.                •   Japan to become an important contributor to global installed base growth as well as
                                     further expansion into Asia Pacific including China;
                                 •   Proactive expansion of our product portfolio through internal product development and
                                     opportunities for strategic acquisitions and product licensing across key vectors of infection;
                                 •   Ongoing investment in R&D, infrastructure, people and capability to continue driving
                                     the global strategic growth agenda with the aim of establishing Nanosonics as a global
                                     leader in infection prevention.

      TROPHON AS            EXPAND GEOGRAPHIC                   PRODUCT EXPANSION                        INVEST TO GROW
   STANDARD OF CARE             FOOTPRINT

                                                                                                  Nanosonics Limited | Half Year 2021   24
APPENDIX
A REAL MARKET NEED
                                                               Fundamentals for adoption continue to strengthen
Risk of cross                                                  with an increasing number of international guidelines
contamination                                                  requiring high level disinfection for semi critical probes
with ultrasound
probes well                                                    Traditional mechanisms                   trophon® setting
                                                               of decontamination                       a new Standard
established
                                                               unchanged in decades                     of Care globally
• 0.9-9% of barrier sheaths
   and condoms leak. 1
                                                               THE TRADITIONAL METHODS:                 SAFE
• A meta-analysis has shown                                    SOAK, SPRAY OR WIPE
                                                                                                                        	Patient proven effective
   that 12.9% of transducers are contaminated
                                                                 Chemical spills and vapour                               on wide range of
   with pathogenic bacteria following
                                                                 control present OH&S risks.                              pathogens.
   routine disinfection. 2
                                                                                                                        	User safe for user.
• HPV, a known cause of cervical cancer, has been                Probes often must be transported
   found on up to 7.5% of transvaginal ultrasound                to a central sterilisation facility.                   	Environment water
   transducers following routine disinfection. 3                                                                          and oxygen by products.
                                                                 Pathogens may remain – increased
• A fatal case of hepatitis B and non-fatal case                 risk of cross contamination.
                                                                                                        VERSATILE
   of hepatitis C have been attributed to improper
   ultrasound transducer disinfection. 4,5                       Wipes and sprays not approved                           Compatible with
                                                                                                                        	
                                                                 by the FDA for HLD.                                     > 1,000 probes.
• Ultrasound transducer handles are not routinely
   disinfected and can harbour pathogens                         Toxic chemicals must be disposed                        Can be used at point
                                                                                                                        	
   including MRSA. 6                                             of as chemical waste.                                   of care.

• Six year population‑level study demonstrates                                                                           Supports streamlined
                                                                                                                        	
   increased risk of infection and antibiotic                                                                            practice workflows.
   prescriptions following semi-critical
   ultrasound procedures. 7                                                                             SIMPLE
                                                                                                                         Simple to use –
                                                                                                                        	
                                                                                                                         one button operation.
1. Vickery et al, J InfPub Health 2013; in press.
                                                                                                                         Fast 7 minute cycle.
                                                                                                                        	
2. Leroy, S. J HospInfect 2013 83(2): 99-106.
3. Ma S et al. EmergMed J. 2013 30(6): 472-5.
4. FerhiK, et al. Case Rep Urol, 2013: p. 797248.
5. Medicines and Healthcare products Regulatory Agency (UK),
   Medical Device Alert Ref: MDA/2012/037.
6. McNally G, NguA, ISUOG world congress, Sydney, 2013.
7. Scott D et al. Ultrasound. 2018 26(3):168-177.

                                                                                                               Nanosonics Limited | Half Year 2021   27
trophon is an automated system that delivers effective,
          ®
TROPHON

The latest innovation in   efficient and safe high level disinfection of ultrasound
ultrasound probe high      probes
level disinfection.        trophon®                             Consumables                            Accessories

                           KEY FEATURES
                           • Highly effective in killing bacteria, fungi and viruses including the highly resistant HPV virus.

                           • Easy to use with fast 7 minute cycle.

                           • Can be placed at point of care to support efficient clinical workflows.

                           • Over 1000 ultrasound probes from all major ultrasound brands approved for use in the system.

                           • Safe for the operator, patient and environment with oxygen and water as by products.

                           • Fully automated delivering reproducible results every time.

                           • Data logs each cycle for excellent traceability.

                           trophon is covered by 14 patent families. Most are
                           active through to 2025 and in many cases beyond
                           including patents relating to the consumables which
                           go out to 2029.

                                                                                                            Nanosonics Limited | Half Year 2021   28
You can also read