THRIVING IN THE NEW NORMAL - Impact of COVID-19 on apparel sector in China - Oliver Wyman

Page created by Javier Yang
 
CONTINUE READING
THRIVING IN THE NEW NORMAL - Impact of COVID-19 on apparel sector in China - Oliver Wyman
THRIVING IN
THE NEW NORMAL
Impact of COVID-19 on apparel sector in China

May 2020
THRIVING IN THE NEW NORMAL - Impact of COVID-19 on apparel sector in China - Oliver Wyman
A TURBULENT YEAR WITH STRUCTURAL LONGER TERM SHIFTS

                 US$ 60 Billion expected to be wiped out of the largest global apparel market, putting most apparel
                 players at risk

                 Further growth of e-commerce with accelerated penetration into sub segments such as high income
                 customer groups, requiring further strengthening of online offering to cater to their needs

                 Offline stores still important but imperative for retailers to re-exam the role and footprint of their offline
                 stores, and fundamentally change the format / offerings / experience in stores

                 Further polarization of the market (across income levels and city tiers), brands stuck in the middle will need
                 to rethink their positioning to survive in this market: either be truly value for money or have a clear and
                 proven higher quality proposition

© Oliver Wyman                                                                                                                    2
THRIVING IN THE NEW NORMAL - Impact of COVID-19 on apparel sector in China - Oliver Wyman
COVID-19 PLACES THE LARGEST APPAREL MARKET OF US$ 370BN AT RISK

Global apparel & footwear retail market1                                                      China apparel & footwear market1
US$ BN; 2014–19                                                                               US$ BN; 2014–19
                                                                                    CAGR%                                                              CAGR%
                                                                                    ’14–’19                                                            ’14–’19
400                                                                                                                                  371
                                                                     China           +3.5%                        5.9%
                                                                                                                              353
                                                                     US              +2.2%                                            36    Footwear    -1.4%
350                                                                                                                  327       37
                                                                                                            308                       45    Sportswear 16.4%
                                                                                                     293                 37
300                                                                                            278           37                38
                                                                                                      38                 31
                                                                                               38            27
250                                                                                                   24
                                                                                               21
200

150                                                                                                                           278    291 Apparel        5.8%
                                                                                                            244      259
                                                                                               219   231
100                                                                  Japan           -0.9%
                                                                     Germany -3.0%
  50                                                                 India          +10.2%

   0
   2014          2015      2016        2017        2018       2019                            2014   2015   2016    2017      2018   2019

1. Exchange rate: USD/RMB = 7.06; USD/JPY = 106.7; USD/EUR = 0.91; USD/INR = 75.8
Source: Euromonitor; Statista; China National Bureau of Statistics

© Oliver Wyman                                                                                                                                                  3
WE EXPECT ~US$ 60BN TO BE WIPED OUT OF THE MARKET IN 2020

China apparel market projection1, 2018–2020E
US$ BN

                                                                                                          ~15%
                                                                                    +5%
                                        +5%                                                  ~390
                                                              371                   -10%
                   353

                                                                                                          market value wiped out
                                                                                                          because of COVID-19

                                                                                                          ~25%
                   353                                        371
                                                                                             ~330
                                                                                             329                      decline for offline

                                                                                                          ~15%         growth for online

                  2018                                       2019                           2020E

                    Market growing as trend                          Market growth impacted by COVID-19

1. Exchange rate: USD/RMB = 7.06
Source: Euromonitor, Financial reports, Oliver Wyman consumer survey and analysis

© Oliver Wyman                                                                                                                              4
IMPACT ON PROFITABILITY OF FASHION PLAYERS WILL BE SEVERE AND FAST ACTION
IS NEEDED FOR SURVIVAL

Revenue and operating income projection1 if offline sales drop by 25%

      Offline sales percentage                                                     Total revenue drop by                                                  Operating income drop by

         70–90%                                                                      19–24%                                                                           ~55%

1. Projection based on 5 Chinese apparel brands’ 2019 financial reports
Assumptions: Unchanged COGS as percentage of revenue as last year, unchanged online and offline sales split as last year, unchanged online sales revenue as last year, unchanged operating expenses as last year
Source: Company reports, Financial Reports, Oliver Wyman analysis

© Oliver Wyman                                                                                                                                                                                                     5
WE TALKED TO CONSUMERS TO UNDERSTAND WHAT WILL BE NEXT

                                               Demographics of respondents

                                               Gender                                 City tiers

                                                                                                                 Tier 1
                                                                                   Tier 3+                 30%
                                                                                             35%
                                               Female 50%               50% Male

                                                                                                     35%
                                                                                                      Tier 2

Survey background                              Monthly household income in RMB        Age
• Conducted between April 30 and May 12
                                                          36%
• 1,000 respondents who have purchased                            32%
                                                                                      40+                        20-29
  apparel and footwear products in 2019                                                      33%           33%
                                                                          23%
• Key topics
  – Spending changes and expectation in 2020      9%
  – Online/offline shifts
  – Product preference shifts                                                                      33%
1
OVERALL 2020 MARKET OUTLOOK
WE LOOKED AT 3 WAVES OF IMPACT OF COVID-19

Indicative performance of China’s apparel and footwear market

                                                                                                                                                                           2019 avg.
                                                                                                                                                                           2020 avg1:
                                                                                                                                                                           -10% Y-o-Y

               In-COVID                                    Recovery                                                 Post-COVID new normal
               Jan–Mar                                     Apr–May                                     (with new dynamics and new shopping patterns)
                                                                                                                                  Jun+
             Y-o-Y2: -45%                                 Y-o-Y3: -5%                                                         Y-o-Y: +3%
1. Generalized average internalizing seasonal variation including Double 11
2. National Statistics Bureau stated apparel spending (companies with annual revenue over CNY 5MM only) dropped by 32% Y-o-Y in 2020 Q1 and dropped by 18% in April 2020
3. Initial statistics on apparel spending in early May was up 31% comparing to early April. Total e-commerce sales also shows Y-o-Y growth at ~30%

© Oliver Wyman                                                                                                                                                                     8
>75% OF CONSUMERS POSTPONED PURCHASES AND TOTAL SPENDING REDUCED BY
45% DURING 2020 Q1

Did you reduce your apparel and footwear spending                % spending reduced from 2019 average
during coronavirus outbreak?                                     by monthly household income group (RMB)

                                      I postponed
                       I spent more                                Below
                                      all spending                                                                -45%
                                                                    5,000
                                3% 3%
  I spent as usual
                     20%                                           5,000–
                                                                                                                  -45%
                                                                   15,000

                                                                  15,000–
                                                                                                                   -46%
                                                                   25,000

                                                                   25,000
                                                                                                           -38%
                                                                  or above
                                             74%
                                                     I reduced
                                                     spending    Weighted
                                                                                                                  -45%
                                                                  Average

© Oliver Wyman                                                                                                           9
NO NEED FOR NEW CLOTHES AND A LOWER INCOME ARE THE TOP REASONS FOR
REDUCED SPENDING

Why did they reduce their spending during the outbreak?         How was their income impacted?
% of maximum score                                              % respondents by income group

   Limited need for new clothes
                                                          56%     Below
          while staying at home                                                         72%                    28%
                                                                   5,000
  The outbreak has impacted my
                                                    45%
 income and I limit my spending
                                                                  5,000–
            Unable / Unwilling to                                                       70%                  29%
                                                  38%             15,000
         leave home for shopping

       I normally buy online but
delivery of my prefered store(s)            29%                  15,000–
                were suspended                                                     62%                     37%       1%
                                                                  25,000
   I only buy apparel offline and
                                          21%
          the stores were closed
                                                                  25,000
 I normally buy online but items                                                  56%                    42%         1%
                                    11%                          or above
      I wanted were out of stock

                                                                              Reduced         Same   Increased

© Oliver Wyman                                                                                                        10
LITTLE RETALIATORY SPENDING IN APRIL AND MAY, AND LOW INCOME GROUP STILL
EXPECTS TO SPEND ~15% LESS THAN NORMAL

Estimated apparel and footwear spending compared to usual in April and May
% vs 2019 average
                                                                  Casual and format
 Monthly household                                                                                      Sports apparel
 income (RMB)                     Total                 Apparel                     Footwear             & outerwear

 Below 5,000         -14%                  -14%                         -11%                   -19%

 5,000–15,000               -5%                    -3%                 -12%                           -6%

 15,000–25,000              -5%                   -5%                           -4%                     -3%

 25,000 or above                      2%                          3%            -4%                     -3%

 Weighted average           -5%                   -4%                         -7%                     -6%

© Oliver Wyman                                                                                                           11
DISCOUNTS ARE A KEY DRIVER FOR RECOVERY IN SPENDING IN APRIL
AND MAY, ACROSS ALL INCOME GROUPS

Why are consumers spending more in April and May?
% respondents
                                                    By income group

There are steep discounting and
promotions which makes it very              47%       Below
                                                                             53%
attractive to buy now                                  5,000

                                                     5,000–
                                                                       47%
                                                     15,000
I want to check out some product in
offline store but was not able to do that   28%
during the outbreak
                                                    15,000–
                                                                             54%
                                                     25,000

I have not been purchasing as much
during the outbreak so now I need to        22%      25,000
                                                                      44%
make up for that                                    or above

© Oliver Wyman                                                                     12
FOR THE REST OF THE YEAR, MARKET MAY REVERT BACK TO SOME GROWTH,
YET STILL LOWER THAN HISTORIC 5%+ GROWTH

Estimated apparel and footwear compared to usual in the rest of 2020?
% vs 2019 average
                                                               Casual and format
 Monthly household                                                                           Sports apparel
 income (RMB)                   Total                Apparel                   Footwear       & outerwear

 Below 5,000         -4%                      -5%                       -6%                   -1%

 5,000–15,000                           2%                        3%          -1%                      2%

 15,000–25,000                           3%                      3%                     1%                         6%

 25,000 or above                        2%                       3%                     0%                    4%

 Weighted average                         3%                       4%              0%                         4%

© Oliver Wyman                                                                                                     13
CONSUMERS ARE MORE OPTIMISTIC ABOUT THEIR INCOME FOR THE REST
OF 2020

Question: What is the outlook of your income for the rest of 2020?
% respondents by income group

   Below
                 4%     25%                                    45%                                 20%           7%
    5,000

   5,000–
                 6%              35%                                      44%                             14%         2%
   15,000

 15,000–
                 5%                40%                                          44%                         10%       1%
  25,000

 25,000
                  7%                      47%                                         37%                       9%    0%
or above

                              Very optimistic   Optimisitic   Neutral   Pessimistic    Very pessimistic

© Oliver Wyman                                                                                                         14
2
SHOPPING PATTERN SHIFTS IN THE NEW NORMAL
EXPECTED LONGER-TERM SHOPPING PATTERN SHIFTS

                                 Pre-COVID                                 Post-COVID new normal

 1
                 Further shift   • E-commerce represented 34% in 2019,     • The shift to e-commerce is accelerated, expected to be 40-
                 to online         up from 12% in 2014                       50% in 2020
                                 • A multichannel journey                  • High income group will embrace online as a major channel
                                 • A small share of pure online shoppers     for apparel, surpassing other income groups
                                                                           • Further increase in pure online shoppers, especially for
                                                                             younger age groups
                                                                           • Brand online flagship stores on major platforms will gain
                                                                             even more attention, potential for brand’s own app / online
                                                                             store / mini-program remains to be unlocked

 2
                 Higher bar      • Offline stores already under            • Offline stores will still have a role to play, especially for
                 for offline       pressure, with many players slowing       sportswear, but the bar to draw in traffic is increasing
                                   down offline expansion or even          • Experience and quality will be the major differentiators,
                                   closing stores                            especially for middle and upper classes in tier 1/2 cities
                                 • Some leading players have started to
                                                                           • Personalized clothing suggestion could be the most wanted
                                   re-invent offline experience              service, followed by more digital in-store experience

 3
                 Further         • Brands with no clear positioning        • Trade-up remains strong in middle and upper classes, while
                 polarization      already suffering and many                strong trade-down emerges in lower income group
                                   international brands left China         • Players with clear value-for-money proposition are more
                                                                             likely to survive
                                                                           • Those without distinctive proposition (e.g. value-for-money,
                                                                             quality) may fall into a tough situation and suffer

© Oliver Wyman                                                                                                                               16
1   OFFLINE CHANNEL WAS ALREADY UNDER PRESSURE BEFORE COVID-19

    Online is the main driver of market growth                                          Slow down in offline expansion

    China apparel market, 2017–2019                                                     # of stores nationwide, 2017–2019
    US$ BN
                                                                                                                                    ’17–’18 ’18–’19
                                                                                                         2017     2018      2019    Growth Growth
                                     +7%
                                                             371              CAGR%
                                     353                                      ’17–’19                     645      726       807     13%     11%
             327
                                                             34%    Online      19%                     2,410    2,670      2,815    11%      5%
                                     31%
             28%

                                                                                                          640      659       655      9%      -1%

                                                                                                        4,251    4,594      4,427     8%      -4%

             72%                     69%                     66%    Offline      2%
                                                                                                        7,181    7,305      5,970     2%     -18%

                                                                                                        9,448    9,269      4,878    -2%     -47%

            2017                    2018                     2019
    Exchange rate: USD/RMB = 7.06
    Source: Euromonitor, Company reports, Oliver Wyman analysis

    © Oliver Wyman                                                                                                                                  17
1   INTEREST IN BRANDS’ OFFLINE STORE WILL REBOUND, BUT IN LONG RUN THERE
    CONTINUES TO BE AN INCREASING INTERESTS IN ONLINE CHANNELS

    Question: How do you expect your spending to change in the following channels comparing to 2019?

                           Offline                                              Online

    Net          -24% -6%            -30% -26%    +20% +37%      -7%   -1%      +12% +26%        -31% -15%           -28% -10%

                                                         49%                          42%
                                                  43%                           36%
                           23%                                  25% 27%                                 19%
    More             21%              19%
                                            15%                                                  12%                 15% 26%

    As
    usual

                                                  23% 12%                       24% 16%
    Less             45% 29%          49% 41%                   32% 28%                                                    36%
                                                                                                 43% 34%             44%

                      Brand’s        Department     Brands’     Brand’s app/    3rd parties’   3rd parties’ app/   Livestreaming
                     own store          store       Tmall/      online store/     Tmall/         online store/
                                                  JD flagship   mini-program    JD flagship     mini-program

                                                                                                       April–May           June+

    © Oliver Wyman                                                                                                            18
1   HIGH INCOME GROUP JUMPS FROM THE LOWEST USE OF E-COMMERCE TO
    THE HIGHEST DURING COVID-19

    Question: What is the % of apparel and footwear             By monthly household income
    spending made online? (best estimate)
                                                                                     2019            2020

                                                                  Below
                                                                                      55%     +0% 55%
                                                                   5,000
                                        39%           Offline
                     47%

                                                                  5,000–
                                                                                     53%       +9% 62%
                                                                  15,000

                                                                 15,000–
                                                                                      54%       +8% 63%
                                                                  25,000
                                        61%           Online
                     53%

                                                                  25,000
                                                                                   47%        +17%      64%
                                                                 or above

                     2019           2020 Jan–Mar

    © Oliver Wyman                                                                                            19
1   MAJORITY REMAINS A MULTI-CHANNEL SHOPPER, THOUGH SOME GROWTH IN SHARE
    OF PURE ONLINE SHOPPERS

    Shoppers by shopping channels                                       Pure online shoppers by age group
    % respondents                                                       % respondents
                                                                                      25%
          2%           5%             3%        2%      Non-shopper                                 24%
                               3%
                                                        Pure offline
                                                        shopper                          23%

                                                                                                    19%
                                                                                      18%

                      71%            78%
                                                        Multi-channel                               13%
                                               90%
         95%                                            shopper                                              12%
                                                                                                                      20–29

                                                                                                              8%
                                                                                                                      30–39
                                                                         4%                                   6%
                                                                                                                      40+

                                                                        4%
                      22%            19%                Pure online           2%
                                                8%      shopper
          4%
         2019        Jan–Mar        Apr–May   Jun–Dec                    2019        Jan–Mar      Apr–May   Jun–Dec
                       2020          2020E     2020E                                   2020         2020      2020

    © Oliver Wyman                                                                                                          20
1   SPORTSWEAR SECTOR ENJOYED A FASTER GROWTH THAN GENERAL APPAREL, AND
    OFFLINE STORES HAVE BEEN MORE RESILIENT

    Both online and offline are driving the market growth                               Still expanding their offline store footprints

    Sportwear market value by channel, 2017–2019                                        # of stores nationwide, 2017–2019
    US$ BN
                                                                                                                                     ’17–’18 ’18–’19
                                                                                                         2017     2018       2019    Growth Growth

                                                              45              CAGR%
                                    +20%                                      ’17–’19                     165       174       204      5%     17%

                                      38
                                                             30%    Online      31%
                                                                                                       10,617    12,188     12,943    15%      6%
              31                     27%

             25%
                                                                                                         6,262    7,137      7,550    14%      6%

                                                             70%    Offline     16%                    ~6,000     6,230      6,379     4%      2%
                                     73%
             75%

                                                                                                         5,808    5,539      5,519    -5%      0%

            2017                    2018                     2019
    Exchange rate: USD/RMB = 7.06
    Source: Euromonitor, Company reports, Oliver Wyman analysis

    © Oliver Wyman                                                                                                                                  21
1   SPORTSWEAR CUSTOMERS APPRECIATE BRANDS’ OWN STORES MORE

    In the next 1 to 2 years, do you think you will shop in the following channels?

                               Offline                                                                                Online

    Net              +5%     -7%              -16% -27%                  +45% +36%                   -11%       0%    +26% +26%             -10% -16%           -22% -9%

                                                                          57% 48%                                     45% 41%
                     30% 22%
    More                                       22% 15%                                                23% 27%                               25% 19%                   26%
                                                                                                                                                                23%

    As
    usual

                                                                          12%
                                                                                    12%                               18% 16%
    Less             25%                                                                              34% 27%                               35% 34%             45% 35%
                             29%               38% 41%

                      Brand’s                Department                     Brands’                 Brand’s app/      3rd parties’        3rd parties’ app/   Livestreaming
                     own store                  store                       Tmall/                  online store/       Tmall/              online store/
                                                                          JD flagship               mini-program      JD flagship          mini-program

    1. Big sportswear spenders are those with monthly spending above median (RMB 700/month) and share of sportswear
    spends out of total spends above median (33% of total spends on sportswear)                                                      Big sportswear spenders1         Others

    © Oliver Wyman                                                                                                                                                       22
2   OFFLINE STORES WILL ALWAYS HAVE A ROLE TO PLAY, WITH EXPERIENCE AND
    QUALITY BEING THE MAJOR DIFFERENTIATORS

    Why consumers prefer going to offline stores?
    % of maximum score

                      Experience - I can feel, touch, and try on the product                                           49%

                Quality - Products quality and authenticity is more assured                                      42%

    Convenience - I can buy it right away without waiting for the delivery                                 22%

             Experience - I enjoy walking around the store when shopping                             15%

                     Convenience - It is easier to find what I am looking for                        15%

                                   Service - I can return/change easily; etc.                  12%

                             Experience - I enjoy shopping with my friends                     12%

                                      Security - Transaction is more secure                 11%

       Experience - I can talk to a shop assistant in person and get advice                 11%

                         Convenience - Shopping offline is simple and easy               9%

                                                              Experience related   Quality related

    © Oliver Wyman                                                                                                       23
2   BUT THE BAR TO DRAW IN TRAFFIC IS INCREASING

    What features will attract you to visit and/or make a purchase in an offline store in the future?
    % respondents
           New technology (e.g. VR fitting room, AI styling advices,
                                                                                         31%                           37%                        23%          7% 2%
                                                     face payment)

                                                 Offline exclusive product           24%                         39%                         27%               7% 3%

        Personalized services (e.g. personalized recommendations)                   21%                        41%                          28%               7% 3%
             Pre-booked services (e.g. 1-on-1 services, fitting room,
                                                                                    22%                       36%                        27%              11% 4%
                                        professional styling advices)

                     Additional services (e.g. styling advice, gear rental)       16%                    38%                          29%                13%     5%

                                 Convenient pick-up for online purchase          16%                    38%                          29%                 12%     5%

    Activities (e.g. mix-and-match courses, workshops, gatherings)                18%                    35%                          32%                 12% 4%

                                            Instagramable in-store décor         15%                    38%                           32%                 11% 4%

                              Food & beverage service (e.g. brand café)          14%                  36%                           34%                   12% 4%

              Entertainment (e.g. interactive games, VR experience)               16%                 31%                       32%                     16%      6%

                                 5-Very interested    4-Interested     3-Fairly interested     2-Slightly interested    1-Not at all interested

    © Oliver Wyman                                                                                                                                                    24
2   TIER 1 CONSUMERS ARE MOST DEMANDING; OFFLINE EXCLUSIVE PRODUCTS AND
    ADDITIONAL SERVICE COULD HELP GAIN MORE TRACTION

    Preferred features for offline stores by city tier
    % respondents indicated attractive or very attractive

     Offline exclusive product

     New technology (e.g. VR fitting room, AI styling advices, face payment)

     Personalized services (e.g. personalized recommendations)

     Pre-booked services (e.g. 1-on-1 services, fitting room, professional styling advices)

     Food & beverage service (e.g. brand café)

     Additional services (e.g. styling advice, gear rental)

     Convenient pick-up for online purchase

     Instagramable in-store décor

     Activities (e.g. mix-and-match courses, workshops, gatherings)

     Entertainment (e.g. interactive games, VR experience)

                                                                                               0%   40%   50%   60%   70%   80%
                                                                 Tier 1    Tier 2     Tier 3

    © Oliver Wyman                                                                                                           25
2   FANCY IN-STORE ENVIRONMENT AND EXPERIENCE IS EVEN MORE IMPORTANT FOR
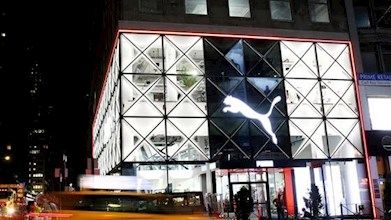
    SPORTSWEAR CONSUMERS

    Preferred features for offline stores                                        Global example – PUMA NYC Flagship
    % respondents indicated attractive or very attractive
     New technology (e.g. VR fitting room,
     AI styling advices, face payment)

     Offline exclusive product

     Pre-booked services (e.g. 1-on-1 services,
     fitting room, professional styling advices)

     Instagramable in-store décor
                                                                                 • PUMA’s first flagship store in New York City opened in
     Convenient pick-up for online purchase                                        Aug 2019 focus on immersive entertainment experience
                                                                                 • Professional Formula-1 simulators were installed for
     Personalized services (e.g. personalized
                                                                                   visitors’ trial to advertise its lesser-known motorsports
     recommendations)
                                                                                   wear product line
     Entertainment (e.g. interactive games,
     VR experience)                                                              • Basketball and soccer simulation and gaming sections are
     Activities (e.g. mix-and-match courses,                                       included to push its lines of functional sportswear
     workshops, gatherings)

     Food & beverage service (e.g. brand café)

     Additional services (e.g. styling advice,
     gear rental)
                                                   0%   50%       60%      70%

                                        Big sportswear spenders         Others

    © Oliver Wyman                                                                                                                             26
2   PERSONALIZED CLOTHING SUGGESTION COULD BECOME THE MOST WANTED
    EXPERIENCE, FOLLOWED BY MORE DIGITAL IN-STORE ELEMENTS

    What type of personalized experience would you like in an offline store?
    % respondents replied (open question)

    38%          want personalized
                 clothing suggestion    14%         want more digital
                                                    in-store experience      13%        want personalized
                                                                                        tailored apparel design   12%         want VIP 1-on-1
                                                                                                                              service in store

    挑选搭配试穿都有搭配师指导,                      想有新科技试衣间,或者能使                        希望可以有个性化的定制服务,                       希望能够得到一对一的服务,
    可以根据客人的身材和脸型,                       用虚拟现实来看到服装搭配上                        量体裁衣。                                就我看中的商品可以和其他品
    推荐适合的衣服。自己不怎么                       身的效果,这样更方便,有更                                                             牌或样式的商品进行介绍对比
    会穿衣服。                               好的购物体验。                                                                   以便我更好的做出选择。

    Would be great that stylist could   Would like to have new technology    I wish I could have personalized     I would like to get 1-on-1 service,
    guide and assist customers in       for fitting rooms, or have virtual   tailor service, design apparel       such as helping me to compare
    choosing apparel based on their     reality to see how it looks when I   based on my personal                 the product with similar
    body shapes and face shapes.        wear new clothes. It would offer     characteristics.                     products or brands for me
    I personally do not know much       more convenient and better                                                to make better decisions.
    how to choose apparels.             shopping experiences.

    Observed key difference across different customer groups / city tiers

      Tier 1&2             Tier 3         Age ≤30             Age >30            Male              Female            Tier 1&2              Tier 3

       35%           VS   43%              16%         VS     10%               16%         VS     10%                13%         VS       8%

    © Oliver Wyman                                                                                                                                  27
2   FOREIGN PLAYERS ARE RECOGNIZED AS LEADERS IN CUSTOMER EXPERIENCE

    Which brand do you think offers the best offline store experience? Why?
    % respondents replied (open question)

                         17%
                                            Selected comments
    #1                                      Personalized recommendation                     Personalized apparel design
                         of respondents

                                            阿迪达斯。品种比较齐全,可选择性強,                              耐克做的非常好,因为它产品可以定制手

                         16%
                                            每次我一进店,销售员是询问我的需求后                              绘个性图案。
                                            再向我推荐产品。
    #2
                         of respondents     Adidas. Product range is comprehensive and      Nike do better on in-store experience
                                            easy to choose form. Every time I shop there,   because you can personalize the products
                                            staff always ask for my needs and then          with hand-drawn patterns.
                                            recommend products to me.

    #3                   12%
                         of respondents
                                            Good fitting experience & services              Good customer services

                                            优衣库,因为它有试衣改衣服务,                                 海澜之家的服务员很热情,会推荐个性化

                         8%
                                            不合适可以改。                                         的搭配技巧。

    #4                                      Uniqlo’s in-store fitting and alteration        HLA, staff are very warm-hearted,
                         of respondents     services are very convenient.                   will give you personalized matching
                                                                                            recommendations.

    © Oliver Wyman                                                                                                                     28
3    HIGH INCOME CONSUMERS STILL TRADE-UP AND GO FOR BOTH VALUE
     AND FUNCTIONALITY

     High income group                                        Product preferences
     Monthly household income ≥ 25,000                        % respondents will likely buy more products which are…

                                                                of high value-for-money                         56%
             More       4%    22%                   20%                of higher quality
                                                                                                               54%
                                                                        or functionality
                                         Trade-up
                                                                 durable or that are not

                        3%     3%                   10%
                                                                                                        39%
    Pieces

                                                                  quickly out-of-fashion
             Same

                                                                       are essential only             34%

                       16%     17%                  5%
                                                                            unique items
                                                                                                  27%
             Less                                             (limited edition/crossover)

                                                                  with good brand name
                                                                          (Luxury brand/        23%
                      Lower      Same                Higher           Street wear brand)

                               Unit price

     © Oliver Wyman                                                                                                  29
3    LOW INCOME CONSUMERS WILL TRADE-DOWN FOR ESSENTIALS

     Low income group                                Product preferences
     Monthly household income < 5,000                % respondents will likely buy more products which are…

                                                       of high value-for-money                         72%
             More      11%    14%          12%
                                                              are essential only                     63%

                                                        durable or that are not

                        2%     2%          5%
                                                                                               51%
    Pieces

                                                         quickly out-of-fashion
             Same

                                                              of higher quality
                                                                                        20%
                                                               or functionality

                       45%     6%          5%
                                                                   unique items
                                                                                   3%
             Less                                    (limited edition/crossover)

                                                         with good brand name
                                                                 (Luxury brand/    3%
                      Lower     Same        Higher           Street wear brand)

                              Unit price

     © Oliver Wyman                                                                                        30
3   TIER 1 CONSUMERS CARE MORE ABOUT QUALITY & FUNCTIONALITY, WHILE
    VALUE-FOR-MONEY IS MORE IMPORTANT IN LOWER TIER CITIES

    In the upcoming months, which of the following describe your product preference better?
    I would prefer products which are:
    % of maximum score
                                                                                                                                  Value-for-money
                                                                                                                                       is more
                                          Tier 1 Cities               Tier 2 Cities                Tier 3 Cities                     important in
                                                                                                                                   lower tier cities

               of high value-to-money                           60%                          72%                           70%

                     of higher quality
                                                            51%                       42%                      34%
                      or functionality                                                                                             Product quality
                                                                                                                                 and functionalities
                durable or that are not
                                                          42%                          49%                           51%         are highly valued in
                 quickly out-of-fashion                                                                                            higher tier cities

                     are essential only               34%                             43%                          47%

                                 basics            25%                        22%                            27%

                          unique items
                                                  23%                       17%                          16%
            (limited edition/crossover)
              with good brand name
                                                 22%                      11%                          10%
    (Luxury brand/Street wear brand)

    © Oliver Wyman                                                                                                                                      31
3
HOW TO MINIMIZE 2020 LOSSES WHILE PREPARING
FOR THE NEW ERA
WINNERS WILL FOCUS ON MINIMIZING 2020 LOSSES WHILE ALSO PREPARING FOR
THE FUTURE

 Key levers                     What to do to minimize 2020 financial impact    What to do to prepare for the new normal
           Adjust               • Be smart about prices and markdowns           • Decide which part of the market to play in and
           proposition to fit     to address clear value-for money                develop a distinct proposition to win
           with changing          preference while preventing excessive         • Adjust store format, product offering, service, and
           consumer needs         and unneeded markdowns                          consumer experience for both online and offline
                                • Simplify and adjust collections by focusing     stores to fit with customers’ new shopping
                                  more on core products and re-using              preferences
                                  some excess stock

           Rationalize store    • Close loss making stores in non               • Redefine the roles between offline stores and online
           network                strategic locations                           • Develop longer term offline store network
                                • Re-negotiate for loss making stores in          rationalization strategy to strengthen your footprint
                                  strategic locations                           • Prioritize investment for service and experience
                                                                                  enhancements in most competitive locations

           Take active cost     • Manage short-term cash                        • Strategically redesign operating model
           management           • Implement one-off cost optimization program   • Launch rigorous fact-based assortment planning
           initiatives
                                • Put rapid COGS reduction methods into place • Strengthen long term supplier strategy
                                  (product profitability review,              • Adopt leaner store operations
                                  supplier management)
                                                                              • Redefine longer term markdown strategy via
                                • Optimize inventory management/ markdowns      structural and analytical levers

© Oliver Wyman                                                                                                                            33
QUALIFICATIONS, ASSUMPTIONS, AND LIMITING CONDITIONS
This report is for the exclusive use of the Oliver Wyman client named herein. This report is not intended for general circulation or publication, nor is it to be reproduced,
quoted, or distributed for any purpose without the prior written permission of Oliver Wyman. There are no third-party beneficiaries with respect to this report, and
Oliver Wyman does not accept any liability to any third party.
Information furnished by others, upon which all or portions of this report are based, is believed to be reliable but has not been independently verified, unless otherwise
expressly indicated. Public information and industry and statistical data are from sources we deem to be reliable; however, we make no representation as to the
accuracy or completeness of such information. The findings contained in this report may contain predictions based on current data and historical trends. Any such
predictions are subject to inherent risks and uncertainties. Oliver Wyman accepts no responsibility for actual results or future events.
The opinions expressed in this report are valid only for the purpose stated herein and as of the date of this report. No obligation is assumed to revise this report to
reflect changes, events, or conditions, which occur subsequent to the date hereof.
All decisions in connection with the implementation or use of advice or recommendations contained in this report are the sole responsibility of the client. This report
does not represent investment advice nor does it provide an opinion regarding the fairness of any transaction to any and all parties. In addition, this report does not
represent legal, medical, accounting, safety, or other specialized advice. For any such advice, Oliver Wyman recommends seeking and obtaining advice from a qualified
professional.
You can also read