Analyst & Investor Presentation November 2018 - Anglo ...
←
→
Page content transcription
If your browser does not render page correctly, please read the page content below
Analyst & Investor Presentation November 2018

CAUTIONARY STATEMENT
     Disclaimer: This presentation has been prepared by Anglo American plc (“Anglo American”) and comprises the written materials/slides for a presentation concerning Anglo American. By attending this presentation
     and/or reviewing the slides you agree to be bound by the following conditions. The distribution of this document in certain jurisdictions may be restricted by law and persons into whose possession this document
     comes should inform themselves about, and observe, any such restrictions.
     This presentation is for information purposes only and does not constitute an offer to sell or the solicitation, inducement or an offer to buy shares in Anglo American or any other securities. Further, it does not
     constitute a recommendation by Anglo American or any other party to sell or buy shares in Anglo American or any other securities and should not be treated as giving investment, legal, accounting, regulatory,
     taxation or other advice.
     No representation or warranty, either express or implied, is provided in relation to the accuracy, completeness or reliability of the information contain herein. None of Anglo American, its affiliates, advisors or
     representatives shall have any liability whatsoever (in negligence or otherwise) for any loss howsoever arising from any use of this material or otherwise in connection with this material.
     Forward-looking statements
     This presentation includes forward-looking statements. All statements other than statements of historical facts included in this presentation, including, without limitation, those regarding Anglo American’s financial
     position, business, acquisition and divestment strategy, dividend policy, plans and objectives of management for future operations (including development plans and objectives relating to Anglo American’s products,
     production forecasts and reserve and resource positions), are forward-looking statements. By their nature, such forward-looking statements involve known and unknown risks, uncertainties and other factors which
     may cause the actual results, performance or achievements of Anglo American, or industry results, to be materially different from any future results, performance or achievements expressed or implied by such
     forward-looking statements.
     Such forward-looking statements are based on numerous assumptions regarding Anglo American’s present and future business strategies and the environment in which Anglo American will operate in the future.
     Important factors that could cause Anglo American’s actual results, performance or achievements to differ materially from those in the forward-looking statements include, among others, levels of actual production
     during any period, levels of global demand and commodity market prices, mineral resource exploration and development capabilities, recovery rates and other operational capabilities, the availability of mining and
     processing equipment, the ability to produce and transport products profitably, the availability of transport infrastructure, the impact of foreign currency exchange rates on market prices and operating costs, the
     availability of sufficient credit, the effects of inflation, political uncertainty and economic conditions in relevant areas of the world, the actions of competitors, activities by governmental authorities such as permitting
     and changes in taxation or safety, health, environmental or other types of regulation in the countries where Anglo American operates, conflicts over land and resource ownership rights and such other risk factors
     identified in Anglo American’s most recent Annual Report. Forward-looking statements should, therefore, be construed in light of such risk factors and undue reliance should not be placed on forward-looking
     statements. These forward-looking statements speak only as of the date of this presentation. Anglo American expressly disclaims any obligation or undertaking (except as required by applicable law, the City Code
     on Takeovers and Mergers (the “Takeover Code”), the UK Listing Rules, the Disclosure and Transparency Rules of the Financial Conduct Authority, the Listings Requirements of the securities exchange of the JSE
     Limited in South Africa, the SIX Swiss Exchange, the Botswana Stock Exchange and the Namibian Stock Exchange and any other applicable regulations) to release publicly any updates or revisions to any forward-
     looking statement contained herein to reflect any change in Anglo American’s expectations with regard thereto or any change in events, conditions or circumstances on which any such statement is based.
     Nothing in this presentation should be interpreted to mean that future earnings per share of Anglo American will necessarily match or exceed its historical published earnings per share.
     Certain statistical and other information about Anglo American included in this presentation is sourced from publicly available third party sources. As such it has not been independently verified and presents the
     views of those third parties, but may not necessarily correspond to the views held by Anglo American and Anglo American expressly disclaims any responsibility for, or liability in respect of, such information.
     No Investment Advice
     This presentation has been prepared without reference to your particular investment objectives, financial situation, taxation position and particular needs. It is important that you view this presentation in its entirety. If
     you are in any doubt in relation to these matters, you should consult your stockbroker, bank manager, solicitor, accountant, taxation adviser or other independent financial adviser (where applicable, as authorised
     under the Financial Services and Markets Act 2000 in the UK, or in South Africa, under the Financial Advisory and Intermediary Services Act 37 of 2002).
     Alternative Performance Measures
     Throughout this presentation a range of financial and non-financial measures are used to assess our performance, including a number of the financial measures that are not defined or specified under IFRS, which
     are termed ‘Alternative Performance Measures’ (APMs). Management uses these measures to monitor the Group’s financial performance alongside IFRS measures to improve the comparability of information
     between reporting periods and business units. These APMs should be considered in addition to, and not as a substitute for, or as superior to, measures of financial performance, financial position or cash flows
     reported in accordance with IFRS. APMs are not uniformly defined by all companies, including those in the Group’s industry. Accordingly, it may not be comparable with similarly titled measures and disclosures by
     other companies.

                                                                                                                                                                                                                                        2
                                                                                                                                                                                                                                            2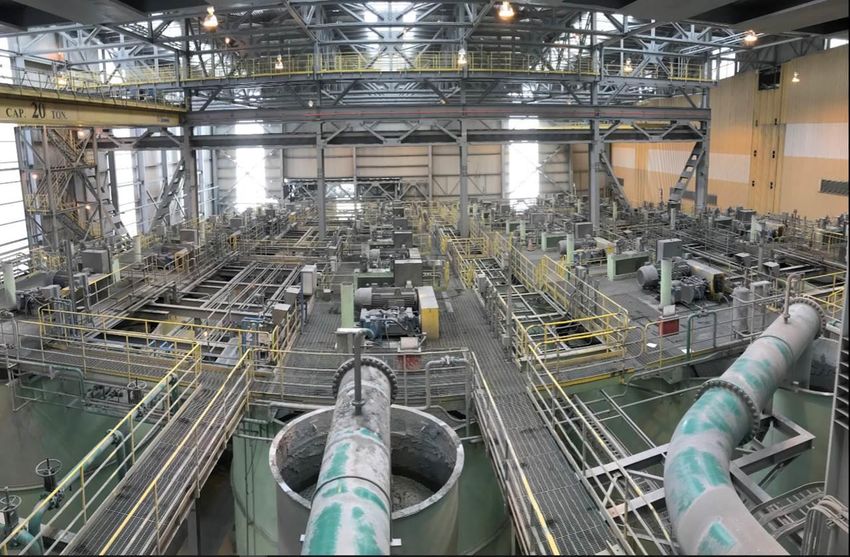
01
    ÍNDICE
    OVERVIEW
DE CONTENIDOS
       02
    FACILITIES

       03
  PERFORMANCE

       04
  SUSTAINABILITY

       05
    GROWTH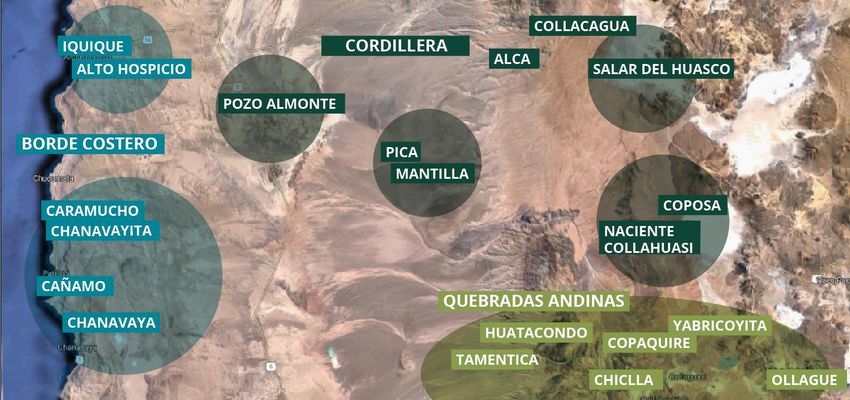
Location
• Collahuasi is located in the
  Region of Tarapaca in Northern
  Chile

• The operation is located in the
  high Andes between 3,000 and
  5,000 metres above sea level
  just 10km from the border with
  Bolivia
                                       EMBARUE

• Our port facilities are located at
  Punta Patache which is close to
  200km from the minesite and
  70km to the south of the city of
  Iquique

                                                 5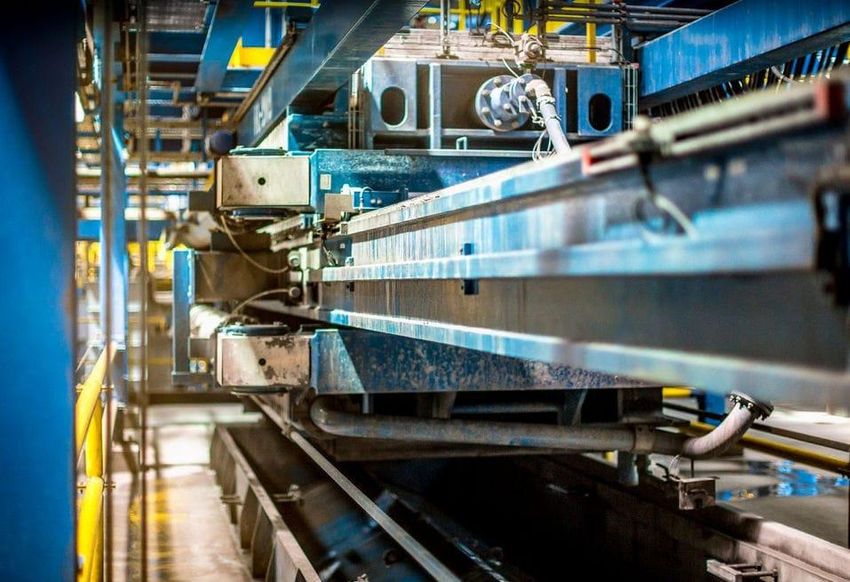
9,000

                                          8,000
                                                           8.7 million tonnes in
                                          7,000
                                                           cumulative copper
Collahuasi History                        6,000
                                                           sales since start of
                                          5,000
                                                           operations
• First commercial activity in the        4,000

  Collahuasi Region dates back to         3,000

  the 1880s where exploitation of         2,000

  high grade copper and silver            1,000

  veins took place                           -
                                                     ´00    ´01    ´02    ´03   ´04   ´05   ´06   ´07   ´08   ´09   ´10   ´11   ´12   ´13   ´14   ´15   ´16   ´17 ´18F

• The current operation was
  constructed at a cost of
                                          14,000            US$12.7 billion in dividends
  US$1.792 billion between 1996
                                                            returned to shareholders
  and 1999, with first commercial         12,000
                                       EMBARUE              from     original     capital
  production in 1999 and sales in         10,000
                                                            contribution of US$657
  2000                                     8,000            million
• The original project was funded          6,000

  through a mixture of capital             4,000

  contributions and bank funding           2,000

• Ujina – Rosario transition project             -
                                                      ´00    ´01    ´02   ´03   ´04   ´05   ´06   ´07   ´08   ´09   ´10   ´11   ´12   ´13   ´14   ´15   ´16   ´17 ´18F

  was constructed in 2004                                                                                                                                                6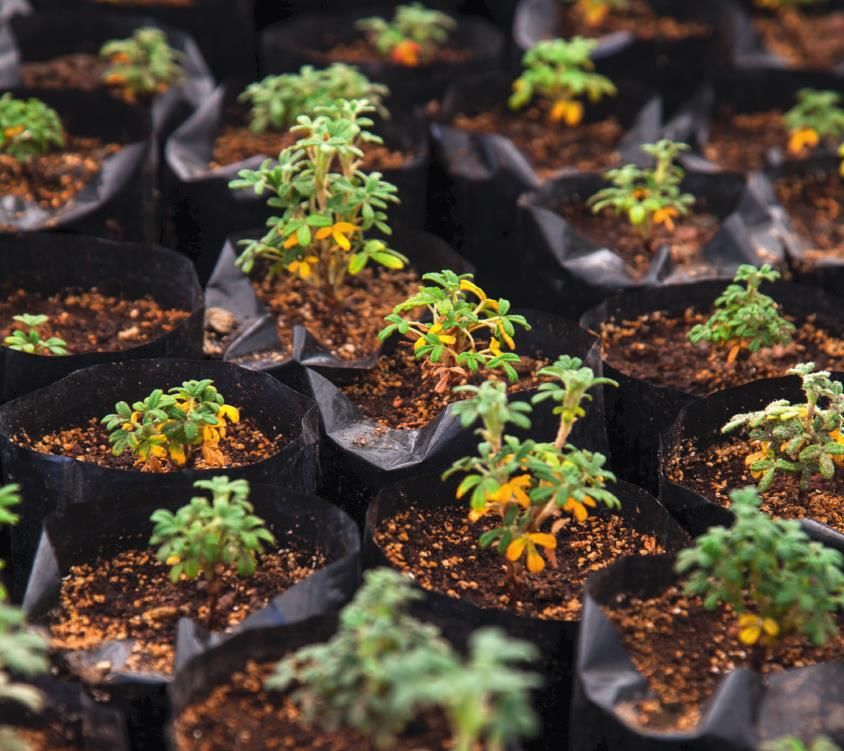
A World Class Resource                                                  Inclusive
                                                            Reserves   Resources
• With close to 10 billion tonnes of                        3.2 Bt @    9.9 Bt @
  Reserves & Inclusive Resources                           0.93% CuT
  at 0.79% Total Copper, the                                           0.79% CuT
                                                 ROSARIO
  Collahuasi deposit is one of the
  best on the planet 1

• Collahuasi    has   consistently
  ranked within the top 4 copper
  mines by production globally         ROSARIO
  over the past decade 2                OESTE

                                                                             UJINA
• With a life until 2087 at current
  production rates, the orebody
  provides significant opportunity
  and optionality for expansion            ROSARIO
                                             SUR

                                                                                     3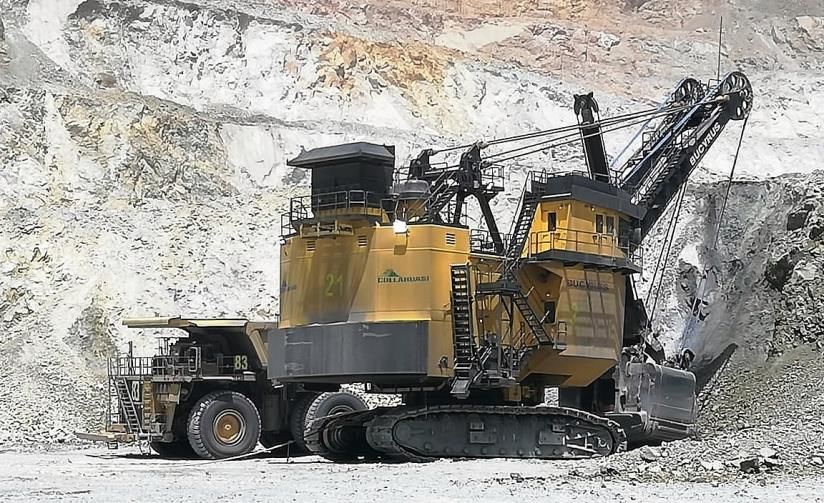
CEO

                                                                Jorge
                                                               Gomez

                            VP Finance &                      VP Development &        VP Human
                                             EVP Operations                                             VP Projects
Experienced Management     Administration                        Sustainability       Resources

Team                      Michael           Francisco          Mario              Fernando           Dalibor
                          Farrelly           Carvajal         Quiñones            Hernandez         Dragicevic

                         EMBARUE

                              VP Mining       VP Processing                         Manager Legal    Manager Safety

                          Marcos             Marcos                               Soledad             Javier
                          Marquez           Guerrero                              Martinez          Cantuarias

                                                                                                                      8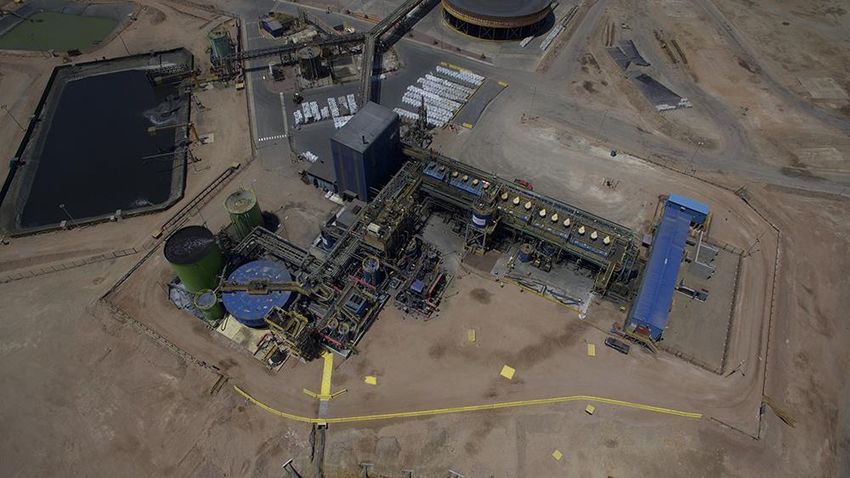
01
    ÍNDICE
    OVERVIEW
DE CONTENIDOS
       02
    FACILITIES

       03
  PERFORMANCE

       04
  SUSTAINABILITY

       05
    GROWTH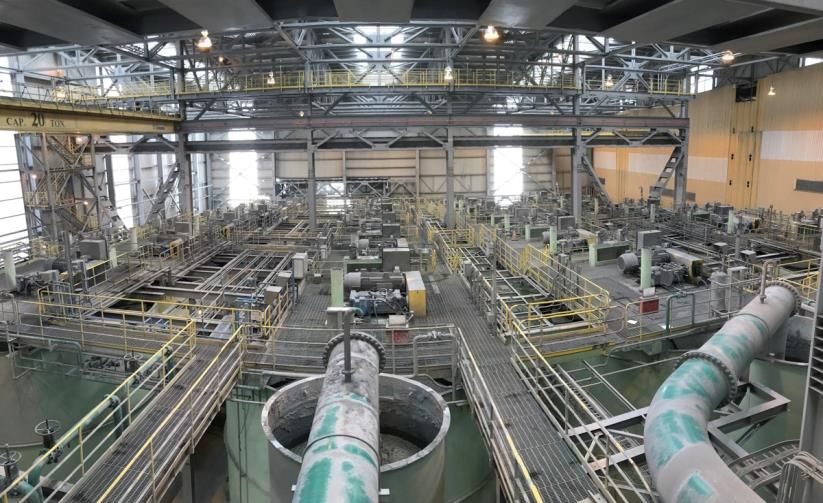
Iquique
                                         Alto Hospicio
                                                                            Pozo
FACILITIES OVERVIEW                                                       Almonte
                                                                                                  Pica

                                       Borde
• Two primary open cut pits –         Costero
  Rosario & Ujina
                                                                                                                                                   Mine &
• Rosario is the current primary                                                                                                                    Plant
                                                                                        Pipeline
  operating pit due to higher       Patache Port

  grade of copper contained
• Copper concentrate plant with
  155-165 ktpd capacity             EMBARUE
                                      PORT                FILTER PLANT               PIPELINE                  PLANT                        MINE
                                                                                                                                               Rosario Pit
• Molybdenum concentrate       is                                                                         Milling

  extracted at Punta Patache                                                        Concentrate
                                                                                      Pipeline                       Stock Pile
                                                                Molybdenum                                                        Primary
                                    Molybdenum                     Plant                                                          Crusher

                                                                                                                                                   Ujina Pit
                                                      Concentrate                                        Flotation
                                                       Stockpile

                                     Shiploader
                                                                    Filter Plant                                                                               10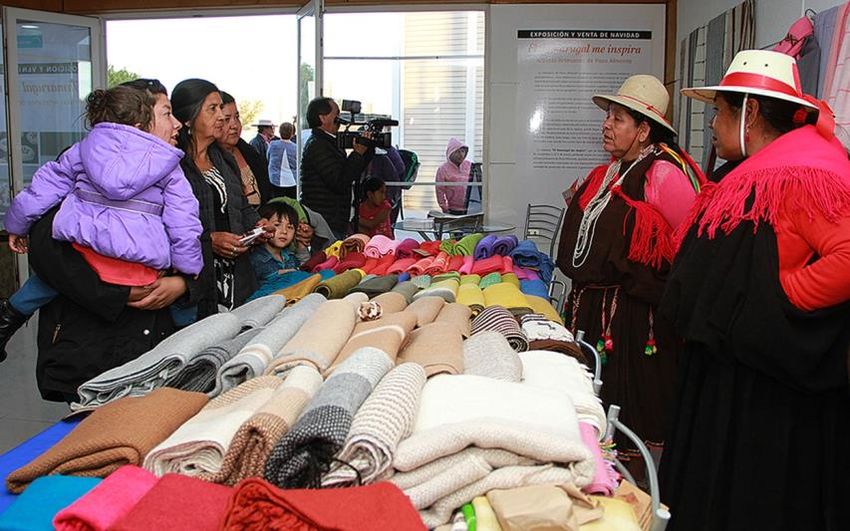
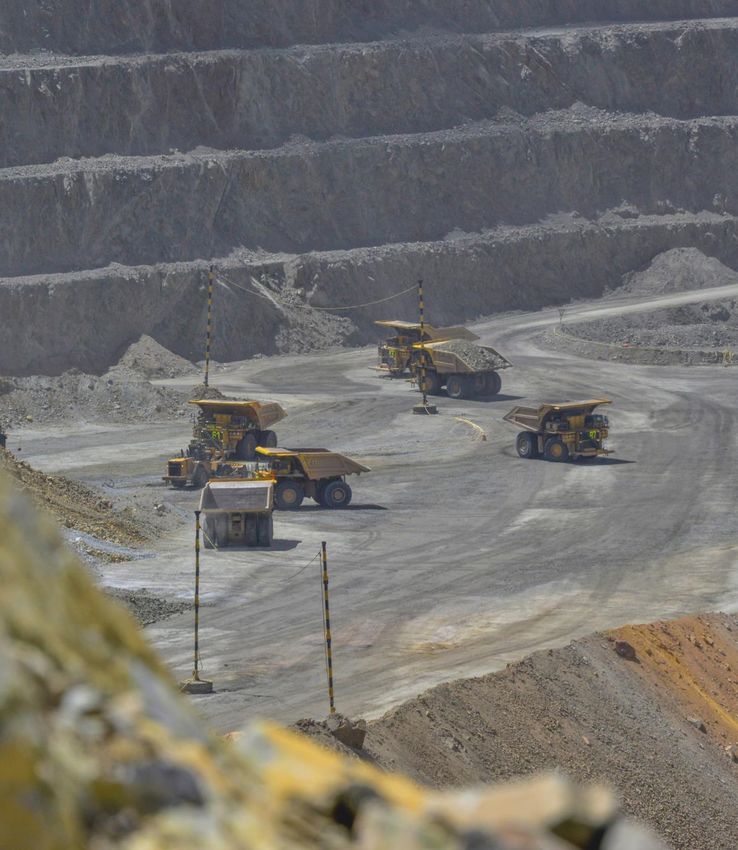
MINE
Main Equipment
• 4 Bucyrus 73 yd3 shovels, 4 P&H 73
  yd3 shovels, 1 CAT-7495 79 yd3
  shovel
• 3 Hydraulic Shovels: 1 PC-8000 and 2
  PC-5500
• 3 Front-end loaders - Letourneau
  1850
• 95 Komatsu 930s, 5 Komatsu 980s, 6
  Liebherr T 282s
• 15 drills

Material Moved
• Current average 750Ktpd, or 275Mt
  per year. This will move to 300Mt by
  2021 3

                                         11
VIEW OF ROSARIO PIT
12PLANT
Main Facilities
• 3 SAG mills and 4 ball mills with
sequential flotation (3 lines)
• 36 rougher cells 127m3 & 24 300m3
• 27 cleaner cells 127m3 & 27 160m3
• 190km pipeline carries slurry to
Punta Patache where molybdenum
concentrate and moisture are
extracted
PRODUCTS
• Cu concentrates ῀ 530kt p.a. 4
• Mo concentrates ῀ 5kt p.a. 5
• Ag credits ῀ 8 million ounces p.a. 6
• Au credits ῀ 0.1 million ounces p.a. 7
13PATACHE PORT
• Wholly-owned allowing unlimited
access to port facilities
• 7 & 8 inches dual concentrate
pipelines from mine site to port
• Molybdenum selective flotation
Plant
• Filter plant to remove moisture
• Shiploading facility for export
shipments and road haulage to
local smelters and alternative
ports
1401
ÍNDICE
OVERVIEW
DE CONTENIDOS
02
FACILITIES
03
PERFORMANCE
04
SUSTAINABILITY
05
GROWTHRisk Management Cycle
Operating Model
Planning Execution Verification
• Through a simple and effective
management model, Collahuasi
has continued to strengthen
Process Work Procedures Verification&
Risk Matrix MitigationPlans
business performance Maps Authorisation
• Key focus on the Risk
Management Cycle – Planning, Knowledge
Execution, Verification, Learning &
Learnings
• Rests on two key pillars – Process
Management & Asset Investigation of
Incidents
Management
Process Management Asset ManagementCICLO DE GESTIÓN DE RIESGO COLLAHUASI
Safety Performance
• Continuous improvement in safety
indicators since 2012
• Industry-leading results in Chile 8 2.6
2.5
• Rigorous focus on risk 2.0
management in the processes and 1.5
heavy involvement from senior 1.2
management team – “Turno 1.0
0.9 0.9
0.8
Trabajo Seguro” (“Safe Work 0.6
0.5 0.5
Shift”) 0.4
0.1
• Regretfully we had one fatality in 2012 2013 2014 2015 2016 2017 2018YTD
2017
TRIFR LTIFR
17115
Productivity
1.0
CICLO DE GESTIÓN DE RIESGO COLLAHUASI108t
Safety & Productivity 85 per person
0.7
55 LTIFR
0.4
• Improved Risk Management LTIFR 0.1
performance – both safety and
25 0.1
operational, has resulted in 2012 2013 2014 2015 2016 2017 2018
significant improvements in Productivity LTIFR
productivity
• Focus on health of employees has
Cardio
also resulted in significant BMI Cholesterol Blood
vascular
Pressure
improvements in safety & Risk
productivity performance 2014 42.5% 4.1% 81%
29.2 (39% National (26.9% National (54.7 Low
Average) Average) Cardio
Vascular Risk)
2018 27.1 25.2% 1.5% 98.5%
(39% National (27.5% National (54.7 Low
Average) Average) Cardio
Vascular Risk)
18Material Mined (million tonnes) Throughput (million tonnes)
Operational Performance
• Mining rates increasing from
300 60
275mt per annum up to 300mt 278 ῀
275 44
48 48
44
49 50 ῀50
by 2020 in order to maximise 257 254
268
252
264
resource returns at current
plant throughput rates 2012 2013 2014 2015 2016 2017 2018F LT 2012 2013 2014 2015 2016 2017 2018F LT
• Long-term average grades in Grade (%) Copper (kt)
excess of 1%
• Throughput in plant to increase
to 160KTPD once final plant
overhauls and stator 1.22% 1.25%
῀
1.30%
524
῀
550 530
1.08%
1.15% 507
1.07% 1.04% 470
replacement is completed 9 0.76%
445 455
282
• 2018 Copper Production
expected to be a historical 2012 2013 2014 2015 2016 2017 2018F LT 2012 2013 2014 2015 2016 2017 2018F LT
record 19Tonnes of Copper Produced per Person
(major Chilean Operations)
Productivity 120
• Collahuasi is the most 100
productive operation in Chile
and one of the most productive
in the world 10 80
• Workforce numbers including
60
permanent contractors have
108
fallen from over 9,000 people in
2012 to below 6,000 people 40
today En 2017 se
20
registraron 2
incidentes.
0
Mine 1 Mine 2 Mine 3 Mine 4 Mine 5 Collahuasi Mine 7 Mine 8 Mine 9 Mine 10 20Operating Costs (US$b)
Costs
• Mine costs have reduced by 33% 1,650 1,610 1,528 Operating Costs Split
from $1.65 billion in 2012 down 1,242
1,073 1,071
῀
1,130
to $1.10 billion today
Other
12% Manpower
17%
• C1 Costs which are approaching 2012 2013 2014 2015 2016 2017 2018F
the first cost quartile have
continued to fall in 2018 even C1 Costs (US$/lb) Contractors Supplies &
though there has been upward 25% Consumables
17%
pressure from input costs and
negative exchange rate impacts Fuel
7%
Spare Parts Power
• ῀50% of operating costs are CLP 2.34 14% 8%
denominated 1.62
1.48 1.41
1.14 1.14 ῀
1.10
• ῀50% of operating costs are fixed
2012 2013 2014 2015 2016 2017 2018F
21Moving down the Cost Curve
11
US$/lb
4.00
• Significant progress has been Collahuasi
made by the management team Collahuasi
3.00 2012
Collahuasi 2015
in moving down the cost curve
2.00 2018
• Move from 4th Quartile to 1.00
border of 1st and 2nd quartile
0.00
since 2012
-1.00
• Expected 1st Cost Quartile
-2.00
Performance in the coming years
-3.00
0% 1st Quartile 25% 2nd Quartile 50% 3rd Quartile 75% 4th Quartile 100%
22Flotation Cells Project
• This project involved the
installation of 24 additional
flotation cells in the
Concentrator plant
• Successful implementation of
the flotation cells project in 2018
has resulted in a more than 3%
increase in copper recoveries 12
• Capital Investment: US$154m
• NPV: US$504m 13
• IRR: 46% 14
• Payback: 1.5 years 15
23Copper Production KT C1 Costs US$/lb
Production & Costs Guidance
570
560 $1.14
to
530 620
to ῀
$1.10
῀
550 to
610
524 550 ῀
$1.00
2017 2018F 2019 2020 2021 2017 2018F 2019
2401
ÍNDICE
OVERVIEW
DE CONTENIDOS
02
FACILITIES
03
PERFORMANCE
04
SUSTAINABILITY
05
GROWTHArea of Influence
Community Relations
• Collahuasi is located in the Region
of Tarapaca
• Constructing a better society is
central to our business proposition
• In 2017, we contributed close to
US$10m to the local communities.
35% was used in funding our Community Involvement
Educational Foundation and 65%
was contributed to Community
Development Projects
• The Collahuasi Educational
Foundation focuses on education
of the youth in the region with a
focus on developing the skills
required to sustain our business in
the long-term
26Industry leading safety performance
Safety Key focus on risk management in the processes and health of
employees
1,969 direct employees
Workforce 3,369 contractors
44.1% of the workforce live in the region
Uso de Recursos
178 local suppliers with US$200m spend
Local 30 local schools are supported by the Collahuasi Educational
Key Sustainability Statistics 16 Communities Foundation
Medio Ambiente US$9.5m invested in community projects
79% of water is recycled
5% of electricity supplied from renewable sources with 100%
Environment
renewable certified from 2020
9,000 tonnes of waste recycled per annum
US$3.0b economic value generated in 2017
Financial
US$2.2b economic value distributed in 2017
Collahuasi Corporate Video Link
2701
ÍNDICE
OVERVIEW
DE CONTENIDOS
02
FACILITIES
03
PERFORMANCE
04
SUSTAINABILITY
05
GROWTHGrowth Inclusive
Reserves
• Significant opportunity & Resources
3.2 Bt @
optionality for controlled growth 9.9 Bt @
as a result of: 0.93% CuT
0.79% CuT
• Very large resource base with
long life
• Low risk jurisdiction
• Brownfield expansion
• Minimal community impact Resource base supports a
• Access to skilled workforce LOM with a life until 2087
• Water Supply is the key at current production
constraining factor for Collahuasi rates. This provides
meaning that any option will need
to consider alternative water
significant scope for
supply sources, as well as options expansion opportunities.
available for maximising water
efficiencyBase Case
• The current base case for Line 1 Line 2 Line 3
Collahuasi assumes the operation
of 3 processing lines in the
concentrator plant including 3 SAG
mills and 4 ball mills Feasibility stage
Copper ῀ 530kt p.a.
• Throughput in this configuration
averages 155-160Ktpd
• Long term average copper
production in this configuration is
῀ 530kt p.a.
2018 2019 2020 2021 2022 2023 2024 2025 2026 2027 2028 2029 2030 2031 2032 2033 2034 2035 2036 2037
Base Case 30170Ktpd
• Current environmental approvals Line 1 Line 2 Line 3 5th Mill
for Collahuasi allow us to increase
throughput capacity of the
concentrator plant to 170Ktpd
Pre-feasibility in process
• Capacity can be increased through Copper ῀ 580kt p.a.
the addition of a 5th ball mill as
well as upgrades to the tailings
distribution system
• Long term average copper
production in this configuration is
῀ 580kt p.a.
2018 2019 2020 2021 2022 2023 2024 2025 2026 2027 2028 2029 2030 2031 2032 2033 2034 2035 2036 2037
Base Case 170KTPD 31210Ktpd
• Collahuasi is currently going through Line 1 Line 2 Line 3 5th Mill
the submission and approval
process for a new EIA which would
extend our license to operate
beyond 2020 Concept stage
• A nominal throughput capacity Copper ῀ 650kt p.a.
expansion to 210Ktpd is being
requested as part of this application
• In addition to the 5th ball mill &
tailings distribution, this project
would involve additional primary
crushing facilities, pebble plant,
flotation cells and water supply
• Indicative total capital forecast of
US$1.2-$1.5 billion for 120kt of
Copper per annum (compared to
2018 2019 2020 2021 2022 2023 2024 2025 2026 2027 2028 2029 2030 2031 2032 2033 2034 2035 2036 2037
base case)
Base Case 170KTPD 210KTPD 32Bioleaching
• As part of the EIA process SXEW Line 1 Line 2 Line 3 5th Mill
Collahuasi is also requesting
authorisation for the development
of additional leaching pads for a
future bioleaching project Concept stage
Copper ῀ 710kt p.a.
• This projects would utilize the
existing SXEW facilities and
convert the process from an oxide
leaching process to a sulphide
leaching process
• Indicative total capital forecast of
US$0.9 - $1.1 billion
• Additional copper production
60kt p.a. of Copper Cathode 2018 2019 2020 2021 2022 2023 2024 2025 2026 2027 2028 2029 2030 2031 2032 2033 2034 2035 2036 2037
Base Case 170KTPD 210KTPD Bioleaching 334th Line
• Optionality exists for long term SXEW Line 1 Line 2 Line 3 5th Mill Line 4
major growth projects including
one complete additional line in
the concentrator plant
Concept stage
• This project would also require Copper ῀ 830kt p.a.
additional infrastructure including
water supply, flotation circuits,
concentrate pipelines, filtering &
shiploading facilities.
• Long term average copper
production in this configuration is
῀ 830kt p.a.
2018 2019 2020 2021 2022 2023 2024 2025 2026 2027 2028 2029 2030 2031 2032 2033 2034 2035 2036 2037
Base Case 170KTPD 210KTPD Bioleaching 4th Line 344th + 5th Line
• A 4th Line Project in the SXEW Line 1 Line 2 Line 3 5th Mill Line 4 Line 5
concentrator plant could be
extended into a 5th Line
• Long term average copper Concept stage
production in this configuration is Copper ῀ 925kt p.a.
῀ 925kt p.a.
2018 2019 2020 2021 2022 2023 2024 2025 2026 2027 2028 2029 2030 2031 2032 2033 2034 2035 2036 2037
Base Case 170KTPD 210KTPD Bioleaching 4th Line 5th Line 35Conclusion
• Collahuasi is world class copper
operation with significant upside
potential
• Current operational performance
in terms of safety, costs and
production confirm us as one of
Porque somos mucho más que cobre, lideramos con pasión un negocio de excelencia para construir una
the worlds leading copper mines sociedad mejor
Because we are much more than copper, we lead with passion a business of excellence in order to construct a
• With a resource base of close to better society
10 billion tonnes and a current life
of mine until 2087 there is
significant scope for us to expand
to meet future demands for
copper1. Please refer to the AA plc Ore Reserves and Mineral Resources Report
2017 for the tonnes, grades and a breakdown of the classification
categories.
2. Collahuasi has ranked in the top 4 Copper Mines globally in each of the
last 10 years apart from 2012. In 2017 Collahuasi was ranked number 2.
3. As part of the current EIA application Collahuasi is asking for approval
to increase mine movement to 300 million tonnes per annum.
4. Expected average annual copper production for the next 20 years,
excluding any possible expansions.
Footnotes 5. Expected average annual molybdenum production for the next 20
years, excluding any possible expansions.
6. Expected average annual silver production for the next 20 years,
excluding any possible expansions.
7. Expected average annual gold production for the next 20 years,
excluding any possible expansions.
8. Industry leading results in 2017. 2018 Industry results not yet available.
9. Collahuasi is completing a planned maintenance program in 2018 and
2019 to replace the stators on both ball mills in line 3. Each stator
replacement results in 90 days of interruption to the production
generated by the ball mill being overhauled.
3710. Benchmarking data based on 2017 Encare Survey. Collahuasi
productivity number reflect Collahuasi forecast 2018 productivity.
These numbers represent tonnes of copper produced per annum per
employee. Employees include both own employees and contractors.
11. Information supplied by Wood Mackenzie September 2018.
12. Additional recoveries of 3% are based on average improved recoveries
since the start of commissioning of the project in April 2018. Actual
Footnotes additional recoveries from September – November 2018 have been
close to 5% which indicates final performance of this project could be
higher than the 3% mentioned.
13. NPV calculations are based on an additional recovery of 3%.
14. IRR calculations are based on an additional recovery of 3%.
15. Payback calculations are based on an additional recovery of 3%.
16. Collahuasi 2017 Sustainability Report
38You can also read