Barclays Global Financial Services Conference 2020 - Andy Cecere Chairman, President and Chief Executive Officer - us ...
←
→
Page content transcription
If your browser does not render page correctly, please read the page content below
Barclays
Global Financial Services
Conference 2020

Andy Cecere
Chairman, President and Chief Executive Officer

Terry Dolan
Vice Chair and Chief Financial Officer

September 15, 2020

                                                  U.S. BANCORP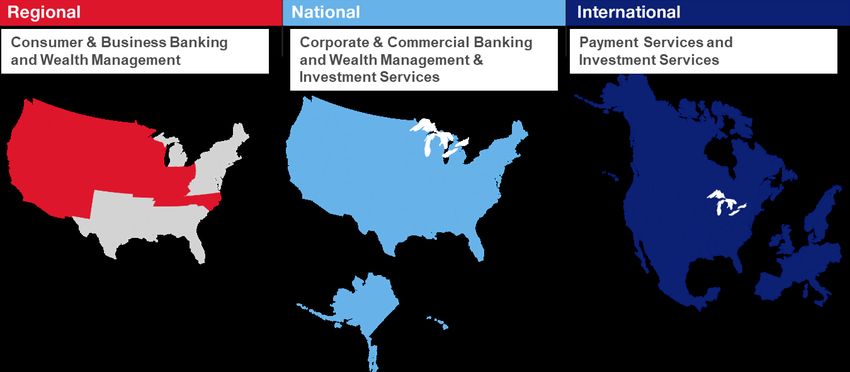
Forward-looking Statements and Additional Information

        The following information appears in accordance with the Private Securities Litigation Reform Act of 1995:
        Today’s presentation contains forward-looking statements about U.S. Bancorp. Statements that are not historical or current facts, including
        statements about beliefs and expectations, are forward-looking statements and are based on the information available to, and assumptions and
        estimates made by, management as of the date hereof. These forward-looking statements cover, among other things, anticipated future revenue
        and expenses and the future plans and prospects of U.S. Bancorp. Forward-looking statements involve inherent risks and uncertainties, and
        important factors could cause actual results to differ materially from those anticipated. The COVID-19 pandemic is adversely affecting
        U.S. Bancorp, its customers, counterparties, employees, and third-party service providers, and the ultimate extent of the impacts on its business,
        financial position, results of operations, liquidity, and prospects is uncertain. Continued deterioration in general business and economic conditions
        or turbulence in domestic or global financial markets could adversely affect U.S. Bancorp’s revenues and the values of its assets and liabilities,
        reduce the availability of funding to certain financial institutions, lead to a tightening of credit, and increase stock price volatility. In addition,
        changes to statutes, regulations, or regulatory policies or practices could affect U.S. Bancorp in substantial and unpredictable ways.
        U.S. Bancorp’s results could also be adversely affected by changes in interest rates; further increases in unemployment rates; deterioration in the
        credit quality of its loan portfolios or in the value of the collateral securing those loans; deterioration in the value of its investment securities; legal
        and regulatory developments; litigation; increased competition from both banks and non-banks; changes in the level of tariffs and other trade
        policies of the United States and its global trading partners; changes in customer behavior and preferences; breaches in data security; failures to
        safeguard personal information; effects of mergers and acquisitions and related integration; effects of critical accounting policies and judgments;
        and management’s ability to effectively manage credit risk, market risk, operational risk, compliance risk, strategic risk, interest rate risk, liquidity
        risk and reputation risk.
        For discussion of these and other risks that may cause actual results to differ from expectations, refer to U.S. Bancorp’s Annual Report on
        Form 10-K for the year ended December 31, 2019, on file with the Securities and Exchange Commission, including the sections entitled “Risk
        Factors” and “Corporate Risk Profile” contained in Exhibit 13, and all subsequent filings with the Securities and Exchange Commission under
        Sections 13(a), 13(c), 14 or 15(d) of the Securities Exchange Act of 1934, including the section entitled “Risk Factors” in the Quarterly Report on
        Form 10-Q for the quarter ended June 30, 2020. In addition, factors other than these risks also could adversely affect U.S. Bancorp’s results, and
        the reader should not consider these risks to be a complete set of all potential risks or uncertainties. Forward-looking statements speak only as of
        the date hereof, and U.S. Bancorp undertakes no obligation to update them in light of new information or future events.
        This presentation includes non-GAAP financial measures to describe U.S. Bancorp’s performance. The calculations of these measures are
        provided in the Appendix. These disclosures should not be viewed as a substitute for operating results determined in accordance with GAAP, nor
        are they necessarily comparable to non-GAAP performance measures that may be presented by other companies.

                                                                                                                                                                       U.S. BANCORP | 2
U.S. Bancorp Overview

                    NYSE Traded                   USB    Branches   2,729   Assets     $547B
                    Founded                       1863   ATMs       4,333   Deposits   $413B
                    Market Value                  $55B                      Loans      $310B

As of 6/30/20, except market value as of 9/9/20
                                                                                               U.S. BANCORP | 3
Our Position In the Industry

           Assets                                                     Deposits                                  Market Value
           Rank Company                            $ in billions      Rank Company              $ in billions   Rank Company              $ in billions
           1    J.P. Morgan                            $3,213         1    J.P. Morgan              $1,931      1    J.P. Morgan                $307
           2          Bank of America                     2,742       2    Bank of America           1,719      2    Bank of America             221
           3          Citigroup                           2,233       3    Wells Fargo               1,411      3    Citigroup                   107
           4          Wells Fargo                         1,969       4    Citigroup                 1,234      4    Wells Fargo                   98
           5          U.S. Bancorp                              547   5    U.S. Bancorp                413      5    U.S. Bancorp                  55
           6          Truist Financial                          504   6    Truist Financial            376      6    Truist Financial              51
           7          PNC                                       459   7    PNC                         346      7    PNC                           47
           8          Fifth Third                               203   8    Fifth Third                 157      8    Fifth Third                   15
           9          Citizens Financial                        180   9    Citizens Financial          144      9    KeyCorp                       12
           10         KeyCorp                                   171   10   KeyCorp                     136      10   Citizens Financial            12

 Source: company reports and Bloomberg
 Assets and deposits as of 6/30/20; market value as of 9/9/20                                                                                      U.S. BANCORP | 4
Long History of Industry-leading Returns on Equity…

             Return on Average Equity                                              Return on Average Equity                                                    Return on Average Equity
                       (5-Year        Average)*                                             (10-Year      Average)*                                                       (15-Year Average)*

                                                                                                                                                  14.6%

13.1%                                                                    13.3%
                                                                                                                                                          12.7%
        11.9%                                                                    11.7%
                11.3% 11.1%                                                                                                                                       11.1%
                                                                                         10.9% 10.6%
                              10.4%                                                                                                                                       10.1%
                                                                                                       9.8%                                                                       9.7%
                                      9.2%   9.0%                                                                                                                                        8.9%
                                                    8.4%                                                      8.6%   8.6%
                                                           8.1%
                                                                  6.9%                                                                                                                          6.6%   6.5%
                                                                                                                            5.8%
                                                                                                                                   4.9%

                                                                                                                                                                                                              3.4%
                                                                                                                                          2.8%
                                                                                                                                                                                                                     2.2%

USB     Peer 1 Peer 2 Peer 3 Peer 4 Peer 5 Peer 6 Peer 7 Peer 8 Peer 9    USB    Peer 1 Peer 2 Peer 3 Peer 4 Peer 5 Peer 6 Peer 7 Peer 8 Peer 9   USB     Peer 1 Peer 2 Peer 3 Peer 4 Peer 5 Peer 6 Peer 7 Peer 8 Peer 9

        Source: S&P Global Market Intelligence; Peer banks include: BAC, CFG, FITB, JPM, KEY, PNC, RF, TFC and WFC
        * 5-Year average ranges from 2015-2019, 10-Year average ranges from 2010-2019, 15-Year average ranges from 2005-2019
                                                                                                                                                                                                       U.S. BANCORP | 5
… driven by superior PPNR* and credit quality performance
Pre-Provision Net Revenue* Pre-Provision Net Revenue* Pre-Provision Net Revenue*
/ Avg Assets / Avg Assets 2.8% / Avg Assets
(5-Year Average)** 2.5% (10-Year Average)** 2.4% (15-Year Average)**
2.2% 2.2%
2.1% 2.1% 2.1%
2.0% 2.0% 2.0%
1.8% 1.9%
1.7% 1.7% 1.7% 1.7% 1.6% 1.6% 1.6%
1.5% 1.5% 1.5% 1.5% 1.5% 1.5%
1.4%
1.1%
0.9% 0.9%
USB Peer 1 Peer 2 Peer 3 Peer 4 Peer 5 Peer 6 Peer 7 Peer 8 Peer 9 USB Peer 1 Peer 2 Peer 3 Peer 4 Peer 5 Peer 6 Peer 7 Peer 8 Peer 9 USB Peer 1 Peer 2 Peer 3 Peer 4 Peer 5 Peer 6 Peer 7 Peer 8 Peer 9
Net Charge-off Rates
3.0%
• Our NCO ratios tend to run higher than peer
average in periods of economic strength due
2.5% to our higher than average mix of credit card
loans
2.0%
NCO Rate
• During periods of stress, our disciplined
1.5%
underwriting is validated by lower NCO ratios
1.0%
vs peers
0.5%
0.0%
2005 2006 2007 2008 2009 2010 2011 2012 2013 2014 2015 2016 2017 2018 2019
Recession Indicator NCO Rate for USB NCO Rate for Peers
Source: S&P Global Market Intelligence; Peer banks include: BAC, CFG, FITB, JPM, KEY, PNC, RF, TFC and WFC
* PPNR defined by S&P Global Market Intelligence as: Net interest income, on a fully tax-equivalent basis, plus fees and other noninterest income minus non-credit-related expenses. Nonrecurring
revenue and nonrecurring expense and securities gains and losses are excluded. U.S. BANCORP | 6
** 5-Year average ranges from 2015-2019, 10-Year average ranges from 2010-2019, 15-Year average ranges from 2005-2019Underpinning our best-in-class financial results:
• A differentiated business mix
• Through-the-cycle underwriting discipline
• A strong and nimble culture
U.S. BANCORP | 7What differentiates U.S. Bank?
Business mix Underwriting Culture
• Traditional banking • Through-the-cycle • Culture of innovation
combined with approach • Culture of optimization
differentiated high-return • Proactive portfolio • Culture of ‘doing the right
fee businesses management thing’ for all our
• Regional, national and • Relationship-based, cash stakeholders
international scope flow lender
U.S. BANCORP | 8Our differentiated business mix supports consistent growth
Consumer & Payment
Business Banking Services
42% 24%
Corporate & Wealth Management
Commercial Banking & Investment Services
21% 13%
Consumer & Business Banking Corporate & Commercial Banking Payment Services Wealth Management & Investment Services
Branch banking, small business banking, Corporate Banking, Commercial Banking and Retail Payment Solutions, Wealth Management, Asset Management,
consumer lending, mortgage banking and Commercial Real Estate Global Merchant Acquiring and Corporate Trust, Fund Services and Custody
omnichannel delivery Corporate Payment Systems
2Q 2020 YTD taxable-equivalent basis
Business line revenue percentages exclude Treasury and Corporate Support; see slide 24 for reconciliation U.S. BANCORP | 9Payment Services: industry spend pressures are abating
Spend activity is down YoY but volume trends have improved as some economies have started to re-open
Payment Fees as a % of Net Revenue % of Merchant Acquiring
Volume
2019 2Q20 Merchant Acquiring 2019 2Q20
Travel & Hospitality* 21.6% 12.7%
4.6%
7.0% Airline 14.9% 0.4%
4.8% • Payments sales volumes have rebounded
6.1% All Other 63.5% 86.9%
1.7% since bottoming in April 2020
84.0% 88.9%
2.9% % of CPS Volume
CPS 2019 2Q20 • Travel & hospitality, airline, and travel &
Travel & Entertainment 18.5% 3.5%
entertainment may take longer to recover,
Merchant Acquiring Corporate Payment Solutions All Other 81.5% 96.5%
but the revenue impact is mitigated by our
Retail Payment Solutions All Other Revenue
broad product set
% of RPS Volume
• Total payments revenue, which includes net RPS** 2019 2Q20
interest income and fee revenue, accounted for Travel*** (Credit & Debit) 6.6% 1.1%
27.0% of FY19 net revenue and 21.6% of 2Q20 All Other 93.4% 98.9%
net revenue
Merchant Sales Volume Growth YoY**** CPS Sales Volume Growth YoY**** RPS** Sales Volume Growth YoY****
0% 0%
0%
January February March April May June July August January February March April May June July August January February March April May June July August
Travel & Hospitality* Airline All Other Travel & Entertainment All Other Travel*** (Credit & Debit) All Other
* Travel and Hospitality includes hotels, restaurants, entertainment & travel
** RPS includes credit, debit, and prepaid
*** Travel includes airlines, auto rental, hotel/motel, other transportation, travel agencies U.S. BANCORP | 10
**** Data ranging from January 2020 – August 2020Unlocking the potential of our complete Payments Ecosystem
As the lines between traditional banking and payments capabilities blur, the opportunity is for us to provide
integrated banking and payments solutions to our extensive customer base
Investing in our business:
Deposits Card issuing
Lending • To enhance e-commerce capabilities and European reach:
Merchant
U.S. Bank processing
Capital solutions Payments • Opayo, formerly Sage Pay, expands our customer
Omni-commerce base in the UK and Ireland, particularly for small
Cash Ecosystem and medium-sized enterprises
management capabilities
Investment services AR and AP • To enhance our integrated solutions to small business customers:
solutions
• talech provides software that allows businesses
to manage multiple operational tasks including
Banking services Payments services order management, inventory, staff reporting, and
payment processing in a single POS solution
• Extensive network of distribution points, innovative products and capabilities
• To enhance integrated payment software solutions to large
• Uniquely positioned in the banking industry with proprietary platforms at scale enterprises in targeted verticals:
• With the estimated size of the U.S. B2B market at $23T* we are focusing on • CenPos focuses on three industry verticals:
creating use cases through our Agile Studios to bring digital solutions to automotive, travel & entertainment and general
corporate America B2B transactions
* Source: Deloitte
U.S. BANCORP | 11We are playing the long game in Mortgage Banking
Our investments in technology and people – including …are driving market share gains and cost savings
a re-imagined digital application experience…
• Increased retail market share 61 bps since 2016 while
maintaining a healthy balance of refinance and purchase activity
% Applications through portal
Market Share*
3,000 3.00%
USBHM Market Share
Industry Originations
~3x
2,000 2.00%
($ in billions)
• Over 90% of mortgage
applications now move through
the Blend platform 1,000 1.00%
2Q17 2Q20
- 0.00%
2016 2017 2018 2019 2Q20
YTD
Refinance Purchase
USBHM Retail Market Share % USBHM Market Share % (Excl. Broker)
Operations Cost Per Loan
• Today, we have Mortgage Loan
Officers in 41 states -22 %
• The number of loan officers have
increased 33% since 2Q17 • As we leverage the digital
platform, we continue to see
improved productivity and
efficiency
2Q17 2Q20
States with USB MLOs in 2016 States USB added MLOs No current USB MLO
* Source: Mortgage Bankers Association
U.S. BANCORP | 12We are a leader in Corporate Trust and Fund Services
These capital efficient businesses are a good source of deposits and fees
Corporate Trust Fund Services
Assets Under Custody and Administration ($bn) corporations, municipalities, asset managers and
2005-2019 CAGR: 8.1% credit managers registered investment advisors
$7,000 AIS Fund
Admin Ally Bank Global Expansion of
First Document
Citizens Union Bank
Custody CLO middle World-class products and Focused on complex funds;
Custody Network office
$6,000
Bank Institutional Irish technology; dominant market share; emerging global capability
SunTrust Municipal Trust Quintillion Depositary
Wachovia Corporate global footprint
Trustee (Ireland) established
Corporate Trust
AmeriServ UMB Bank
Trust Global Fund
Corporate Indiana
LaSalle Corporate Services
$5,000 National Trustee
Corporate Trust re-branding
City PIVOT
Trust
Corporate system
Trust Bank of introduced
$4,000 America structured corporate
Mutual fund Securitization #1 trustee*
#2 trustee**
Servicing of Trust
Fiduciary
Started
Management
$3,000 ETF
services
$2,000 municipal custody
2005 2006 2007 2008 2009 2010 2011 2012 2013 2014 2015 2016 2017 2018 2019 #1 trustee**
#8 administrator***
Corporate Trust Acquisitions Fund Services Acquisitions Milestones
* Source: Asset-Backed Alert
** Source: SDC Platinum U.S. BANCORP | 13
*** Source: Company filingsWhat differentiates U.S. Bank?
Business mix Underwriting Culture
• Traditional banking • Through-the-cycle • Culture of innovation
combined with approach • Culture of optimization
differentiated high-return • Proactive portfolio • Culture of ‘doing the right
fee businesses management thing’ for all our
• Regional, national and • Relationship-based, cash stakeholders
international scope flow lender
U.S. BANCORP | 14Underwriting discipline through the cycle is foundational
2Q20 Wtd Avg FICO/Bond 2Q20 Avg CRE** Growth Indexed vs. Peers (%)
Portfolio rating equivalent * LTV * 130
125
Residential mortgage 768 68%
120
Home equity 791 65% 115
110
Auto loan 792 98% 105
100
Auto lease 783 91% 95
90
Credit card 773 N/A 2014 2015 2016 2017 2018 2019
Commercial Baa3/BBB- N/A Peers U.S. Bancorp
Commercial real estate Ba1/BB+ 59%
4.0% Stress Capital Buffer vs. Est Stressed Capital – Peers***
3.3% 3.3% 3.4% 3.4%
• Prime-based lender for retail portfolios 3.0%
3.0% 3.0%
2.7% 2.7%
2.7%
• Investment grade equivalent in commercial portfolios 2.5% 2.5%
2.5%
2.5% 2.5% 2.5%
with limited leveraged lending 2.0% 2.0% 2.0%
2.1%
• Relationship-based commercial real estate lending; over
80% of CRE commitments are in-footprint 1.0% 0.8% 0.9%
• During the 2020 Fed Stress Test, USB performed best in
class versus our peer group 0.0%
USB Peer 1 Peer 2 Peer 3 Peer 4 Peer 5 Peer 6 Peer 7 Peer 8 Peer 9
SCB% Est Stressed Capital
* FICO and LTV at origination
** Data sourced from FRY-9C’s provided by S&P Global Market Intelligence
*** Source: Dodd-Frank Act Stress Test 2020: Supervisory Stress Test Results; Peer banks include: BAC, CFG, FITB, JPM, KEY, PNC, RF, TFC and WFC
U.S. BANCORP | 15
*** Note: Estimated Stressed Capital is calculated as estimated losses from DFAST plus current quarterly dividend annualized as a percentage of risk weighted assetsNear-term credit quality headwinds are expected to be manageable
Commercial Exposures by Impacted Industries*, 2Q20 Payment Relief**, 2Q20
% of Segment
Segment Commitments Loans Segment Payment Relief ($B) Loans
Retail 5.4% 4.6% Commercial $4.0 3.3%
Malls (Secured & REITs) 0.5% 0.6% Commercial Real Estate $5.5 13.4%
Energy 2.3% 1.1%
Residential Mortgages*** $6.6 9.2%
Media & Entertainment 2.2% 2.2%
Credit Cards $0.4 2.0%
Lodging 1.1% 1.4%
Airline 0.6% 0.6% Other Retail $3.3 5.8%
Loss Mitigation Daily Volumes; 5-Day Moving Avg.
• The loan portfolio remains well diversified, with the Retail
sector representing the largest segment of commercial 20,000
exposure to impacted industries at 4.6% of total loans
15,000
• Volume of new payment relief has reached a steady state
10,000
since peaking in April 2020
5,000
• 35% to 40% of consumer accounts have made at least one
0
payment while in payment relief: Credit Cards (41%),
3/11
3/13
3/18
3/23
3/26
3/31
4/3
4/8
4/13
4/16
4/21
4/24
4/29
5/4
5/7
5/12
5/15
5/20
5/26
5/29
6/3
6/8
6/11
6/16
6/19
6/24
6/29
7/2
7/7
7/10
7/15
7/20
7/23
7/28
7/31
Residential Mortgages (39%) and Other Retail (36%)
*Excludes operating leases and unfunded unconditionally cancellable
** Statistics
above are cumulative payment relief since March 2020. Payment relief generally includes payment deferrals, forbearances, extensions and re-ages.
***Residential mortgages exclude GNMA Buybacks, which are government guaranteed U.S. BANCORP | 16What differentiates U.S. Bank?
Business mix Underwriting Culture
• Traditional banking • Through-the-cycle • Culture of innovation
combined with approach • Culture of optimization
differentiated high-return • Proactive portfolio • Culture of ‘doing the right
fee businesses management thing’ for all our
• Regional, national and • Relationship-based, cash stakeholders
international scope flow lender
U.S. BANCORP | 17Culture of Innovation
Over 75% of transactions take place digitally; increasing The digital door is always open…
digital sales is still a big opportunity
Increasing interactions and Growth in mobile
Loan Sales (% of Total) Improving process interactions*
80% 75%
65%
We are increasing our mobile app DIY capabilities, >2x
60% 54%
46% recognizing the importance of being able to also
40% 35% serve our customers through ‘shared glass’ or ‘do-
25% it-together’ experiences
20%
03/19 05/20
0%
5/31/18 5/31/19 5/31/20
Total Digital Branch and Phone
Using data analytics
for the benefit of our customers
Digital Sales Share Growth in % pts YoY**
We can leverage our treasure trove of
Business CC data to create smart ‘value-added’
interactions for our customers
Auto
Smart refi
Checking
Investments
Savings Savings Below the Glass:
Business loan/line
Migration to digital will drive cost savings and efficiencies through
scaled optimization and developing ‘re-usable’ technology
0% 50% 100% 150% 200% 250% 300%
* Represents core Consumer Banking customers average daily mobile app interactions from March 2019 – May 2020
Total Digital includes both online and mobile platforms U.S. BANCORP | 18
** Data ranging from July 2019 – July 2020Culture of Optimization
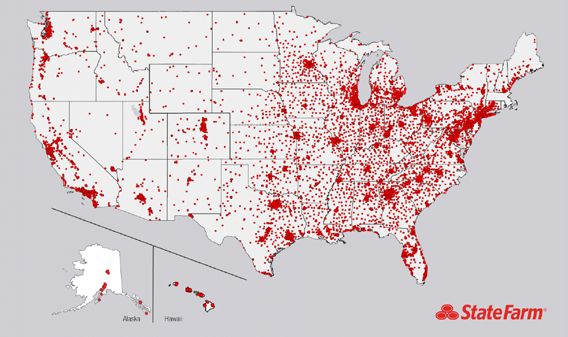
The transformation of our distribution network is aimed at creating a seamless
customer experience that integrates the best of our physical and digital assets
Branch count
3,133 3,106
3,067
Closing branches where appropriate and 3,018 -10%
optimizing square footage
2,795
2,729
Relocating and redesigning branches in
our existing markets
2015 2016 2017 2018 2019 6/30/20
U.S. Bank Digital and
Selectively entering new markets with a
Product capabilities
branch-lite physical presence
Building alliances with those that share
our values to serve customers and
communities at greater scale
+
Over 19,000 State Farm agents
U.S. BANCORP | 19Our culture is rooted in ‘doing the right thing’
We put our employees, customers and communities at the center of everything we do
Supporting financial inclusion Investing in our communities Creating an inclusive workplace
• We serve the underbanked market through • Through our Community Possible program we • One of the 2020 top 50 companies for
products such as Safe Debit Account and Simple invest billions of dollars each year in economic Diversity, DiversityInc.
Loan and community development initiatives
• Ranked No. 3 best employer for veterans in the
nationwide
• In 2019 we doubled our American Dream loans, U.S. Military Times, August 2020
which serves lower/middle income (LMI) • $2B in small business administration loans at
• One of the 2020 Best Employers for Women,
borrowers, in both applications and volume 12/31/19
Forbes
• In June 2020 we announced several initiatives to • In 2019 we made $1.1B in community
• Top score (100%) on the 2020 Disability
address social and economic inequities development loans and $3B in investments to
Equality Index, AAPD
including: organizations connecting families with
affordable housing opportunities* • One of the 2020 Best Companies for
• Will provide $100 million annually in
Multicultural Women, Working Mothers
additional capital to African-American • Since 2009 we have invested more than $110M
owned and led businesses in the Pullman neighborhood in Chicago which • 2020 Best Place to Work for LGBTQ Equality,
has catalyzed $133M in additional investments Human Rights Campaign
• Committed to doubling partnerships
with African-American suppliers • One of the 2020 World’s Most Ethical
Companies, Ethisphere Institute
* Through U.S. Bancorp Community Development Corporation
U.S. BANCORP | 20We are managing for the
long-term while delivering
near-term results that support
a pathway to the future.
U.S. BANCORP | 213Q20 Guidance Update
• Net interest income
• Noninterest income
• Expenses
• Credit quality
• Tax rate
U.S. BANCORP | 22Appendix
U.S. BANCORP | 23Non-GAAP Financial Measures
($ in millions) Net Revenue
Line of Business Financial Performance 2QYTD
Corporate and Commercial Banking $ 2,301
Consumer and Business Banking 4,707
Wealth Management and Investment Services 1,466
Payment Services 2,705
Treasury and Corporate Support 431
Total Company 11,610
Less Treasury and Corporate Support 431
Total Company excl. Treasury and Corporate Support $ 11,179
Percent of Total Company
Corporate and Commercial Banking 20%
Consumer and Business Banking 40%
Wealth Management and Investment Services 13%
Payment Services 23%
Treasury and Corporate Support 4%
Total 100%
Percent of Total Company excl. Treasury and Corporate Support
Corporate and Commercial Banking 21%
Consumer and Business Banking 42%
Wealth Management and Investment Services 13%
Payment Services 24%
Total Company excl. Treasury and Corporate Support 100%
U.S. BANCORP | 24You can also read